


Leverage Ratios PowerPoint Template
Description
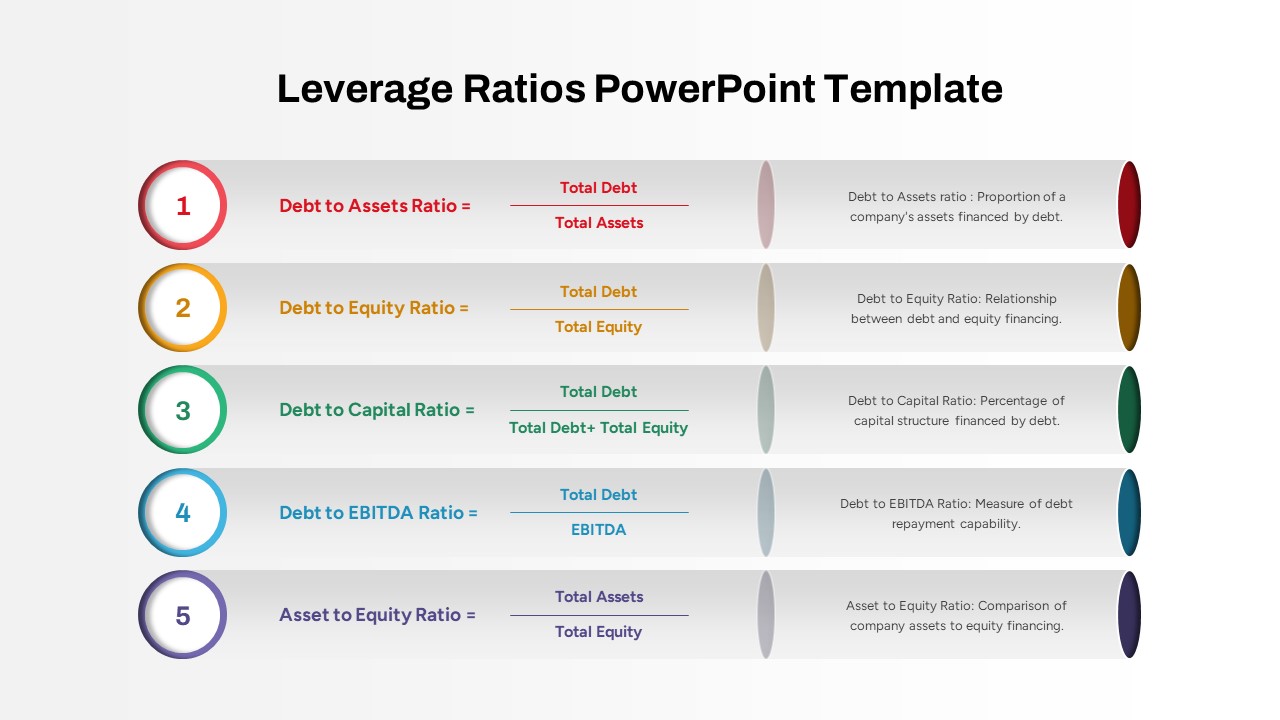
Communicate your organization’s financial leverage metrics with ease using this five-step ratio overview slide. On a clean white-to-light-gray gradient background, each ratio is introduced using a bold title in its corresponding accent color—red, orange, green, blue, and purple—paired with a numbered circle icon. Centered ratio formulas use simple division lines and matching colored text to highlight the numerator and denominator. To the right, elongated pill shapes echo each accent color, framing concise definitions of each leverage ratio: Debt to Assets, Debt to Equity, Debt to Capital, Debt to EBITDA, and Asset to Equity. This layout leverages editable vector shapes, master slides, and placeholder text boxes so you can swap ratio names, adjust formulas, or modify colors without compromising image quality. The balanced row spacing and subtle alternating shading improve readability, while consistent typography ensures clarity on any device. Optimized for both PowerPoint and Google Slides, this asset preserves full resolution and ensures consistent formatting across versions. Ideal for meeting rooms, online webinars, or printed reports, the design adapts seamlessly to different presentation modes.
Who is it for
Financial analysts, CFOs, controllers, and accounting professionals will find this asset invaluable for board presentations, investor reports, and internal reviews. Consultants, audit teams, and MBA students can also use this slide to explain capital structure metrics, risk assessments, or credit analysis frameworks.
Other Uses
Beyond leverage analysis, repurpose this design to present key performance indicators, project milestones, or process steps by updating the titles, formulas, and descriptions. Use the numbered circle format to outline audit checkpoints, compliance requirements, or multi-phase workflows. Simply duplicate rows or change accent colors to match brand guidelines and create a cohesive report or dashboard across your deck.
Login to download this file

Item ID
SB04226