search

Essentials

Must-have decks for quick wins

By Industry

Professionally tailored slides for every sector

By Style

Minimal, modern and creative designs

By Topic

Explore slides curated by purpose and theme

TimelineTimelineRoadmapRoadmapStrategyStrategyGoalsGoalsTableTableComparisonComparisonSWOTSWOTAgendaAgendaArrowArrowWorld MapWorld MapMapsMapsProcessProcessFunnelFunnelTeamTeamOrg ChartOrg ChartPyramidPyramidCircularCircular

Business PlanBusiness PlanBusiness StrategyBusiness StrategyBusiness ProposalBusiness ProposalBusiness ModelsBusiness ModelsDigital MarketingDigital MarketingMarketing FunnelMarketing FunnelCustomer ExperienceCustomer ExperienceProject StatusProject StatusGantt ChartGantt ChartRecruitmentRecruitmentEmployee PerformanceEmployee PerformanceLeadershipLeadershipAIAIMachine LearningMachine Learning

AI Presentation Maker

Install the Windows plugin for quick access to templates and design tools.

AI Infographics Maker

Use our Office 365 add - in to access templates directly from the cloud.

Exe Version

Install the Windows plugin for quick access to templates and design tools.

Office 365

Use our Office 365 add - in to access templates directly from the cloud.

Mac Version

Get the Mac plugin to easily browse, insert, and customize templates and visuals within PowerPoint.

5 Why Fishbone PowerPoint Templates

This template is part of a deck featuring multiple slides. To check out all slides, click on See All. See All round right arrow
5 Why Fishbone PowerPoint Template featured image

Description

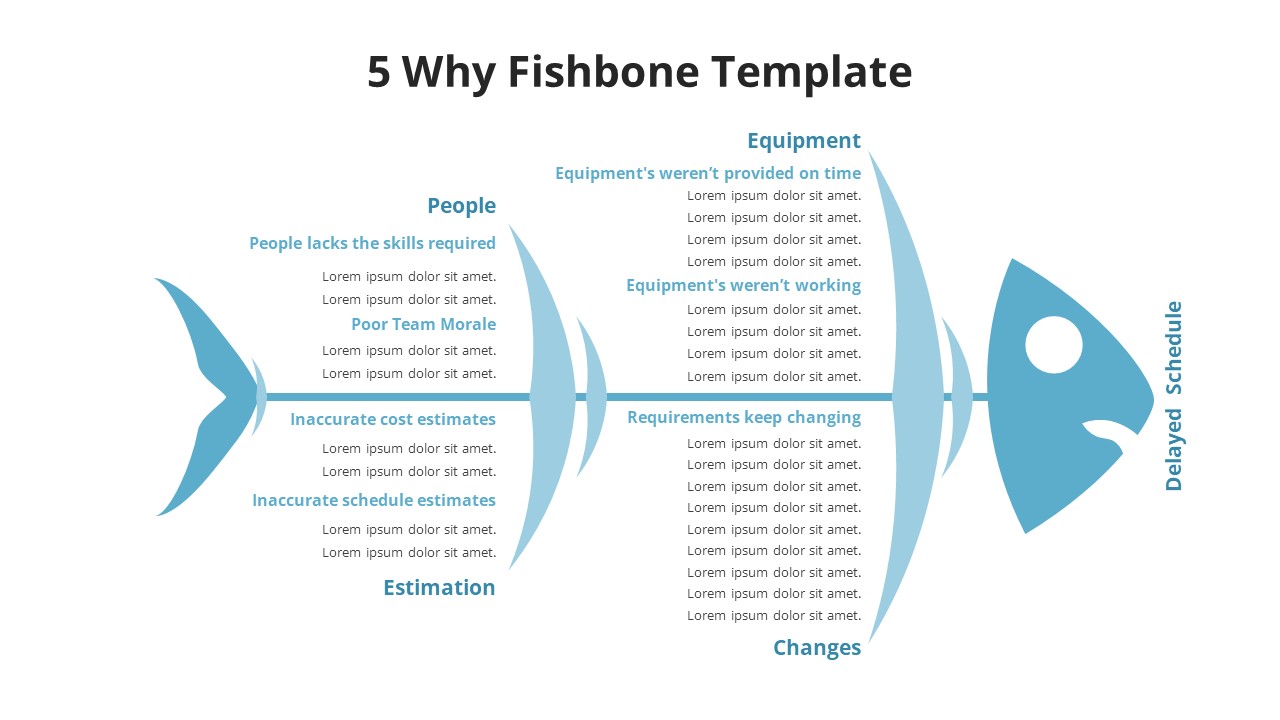
Streamline problem-solving with this 5 Why Fishbone Diagram slide, ideal for uncovering root causes in business or project challenges. Featuring a stylized fishbone layout, the template visually separates categories such as People, Equipment, Estimation, and Changes—each leading into a central spine that culminates in the core issue: Delayed Schedule. This structure encourages teams to explore contributing factors in a clear, methodical way.

Designed for quick comprehension, the diagram employs a consistent blue color scheme and legible fonts, making it presentation-ready for workshops, team reviews, and strategic planning meetings. Fully editable in both PowerPoint and Google Slides, the layout supports step-by-step analysis and can be adapted to various issues beyond time management.

Who is it for

Project managers, quality control teams, operations leads, business analysts, and consultants who need to illustrate root cause analysis processes effectively.

Other Uses

Can be repurposed for Six Sigma discussions, incident debriefs, product defect tracing, software issue mapping, or any scenario requiring visual cause-effect breakdowns.

Login to download this file