


Simple Bar Chart PPT Template

Description
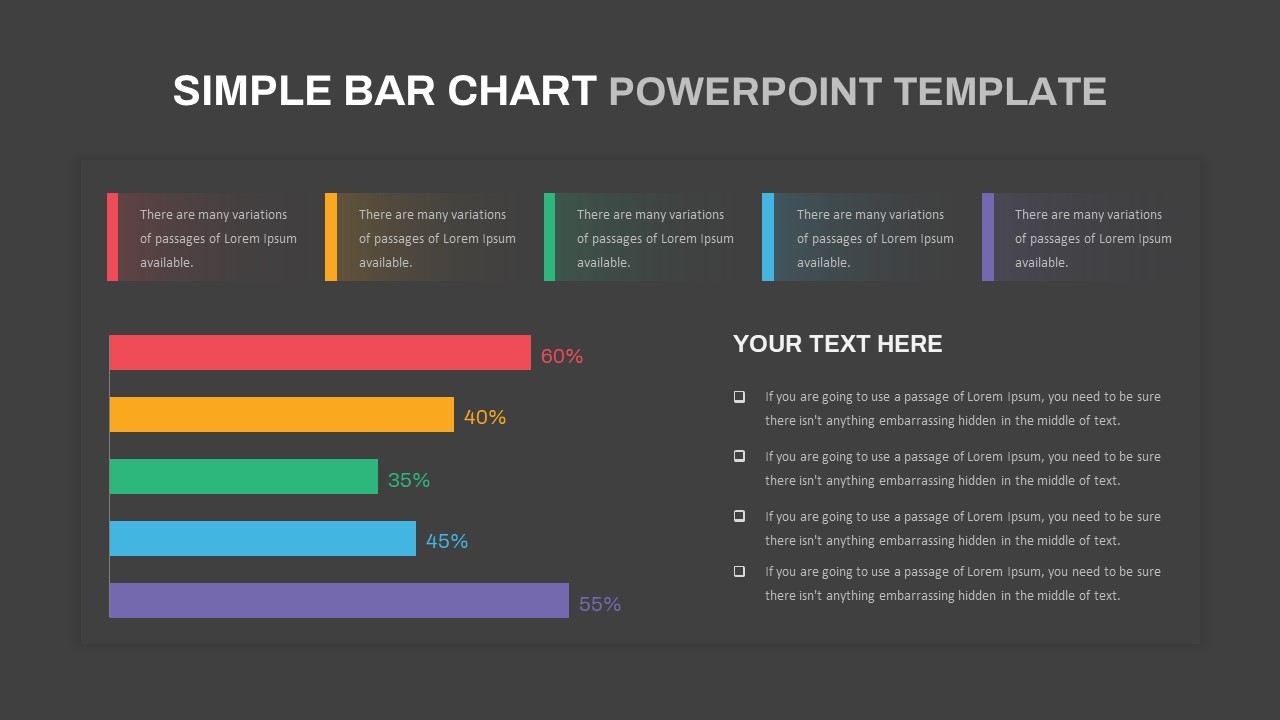
Present your percentage-based metrics with clarity using this simple bar chart slide designed for PowerPoint and Google Slides. Featuring five horizontal bars in distinct colors—red, orange, green, blue, and purple—this template enables side-by-side comparisons of key performance indicators at a glance. Each bar includes a percentage label at its end, while the accompanying text block above offers color-coded descriptions for each metric. On the right side, a clean title area and four editable checklist items allow you to elaborate on insights, action items, or supporting details without cluttering the chart area. The layout leverages master slides, vector graphics, and placeholder text to ensure seamless customization: adjust bar lengths, swap colors, edit fonts, and replace content in seconds. Its minimal flat design, with generous white space and crisp typography, maintains a professional look that adapts to corporate branding or startup themes. Fully scalable and print-ready, the slide preserves resolution quality across screens and devices, eliminating formatting headaches and version control issues.
Who is it for
Business analysts, data professionals, and marketing teams can use this slide to compare sales figures, customer satisfaction rates, or campaign performance. Project managers and operations leaders will find it ideal for tracking progress against targets or budget allocations. Trainers, educators, and consultants can also leverage the straightforward design to introduce concepts or outline steps in workshops and presentations.
Other Uses
Beyond performance comparisons, repurpose this bar chart slide for budget analysis, resource planning, competitive benchmarking, survey results, or timeline progress tracking. Use the checklist area to highlight recommendations, next steps, or critical observations. Duplicate or rearrange bars to accommodate additional data series or split items into multiple sections, making this template a versatile asset across functions and industries.
Login to download this file

Item ID
SB03602