


Current Process Vs Future Process PowerPoint infographics
Description
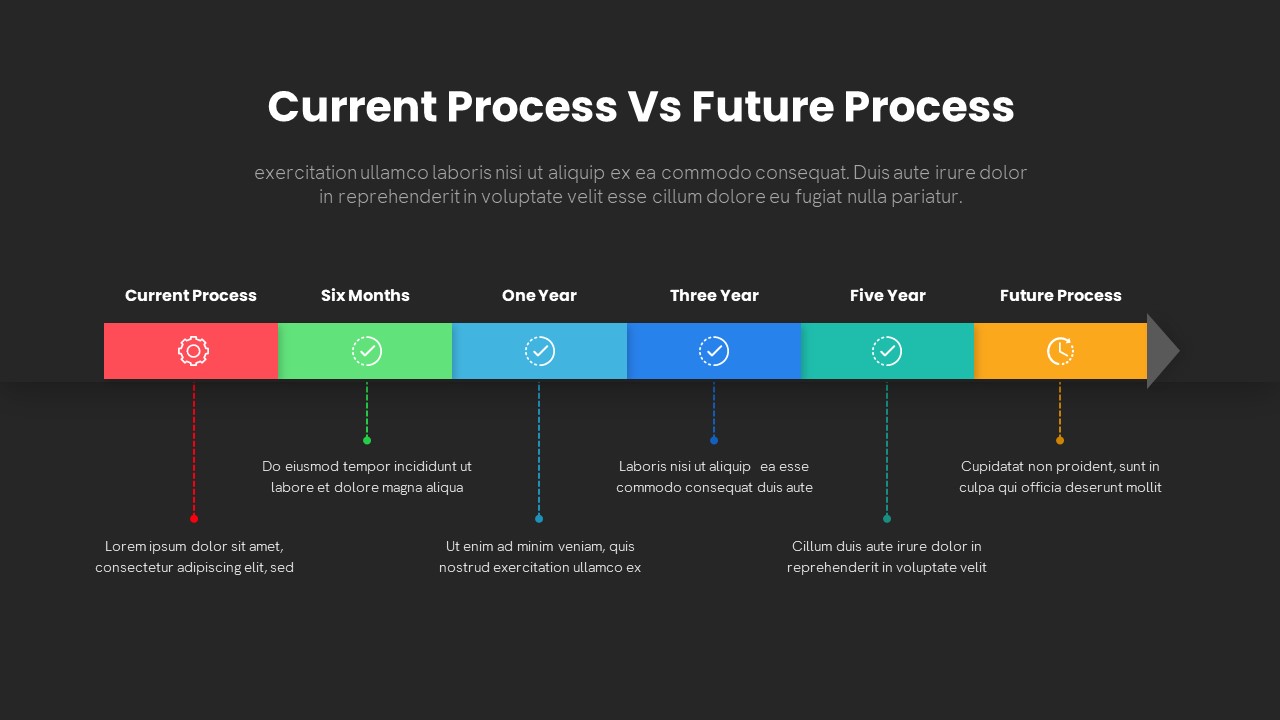
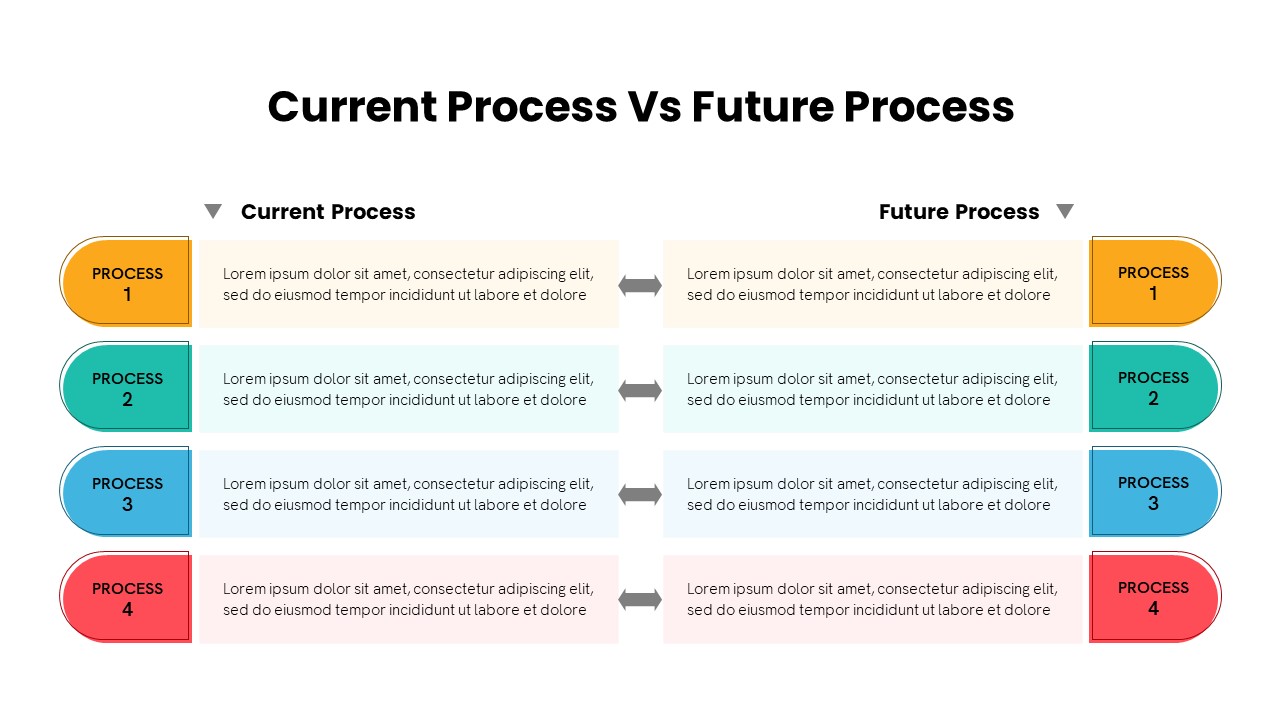
This fully editable PowerPoint & Google Slides template delivers two versatile layouts for illustrating the evolution from current to future processes. The first layout features a structured four-row comparison diagram, with side-by-side panels labeled “Current Process” and “Future Process,” each marked by bold half-capsule shapes in distinct hues and spacious text placeholders. The second layout presents a dynamic six-segment arrow timeline, complete with color-coded stages, milestone markers, dotted connector lines, and icon placeholders for concise annotations. Both variants adopt a flat, minimalist aesthetic with vibrant accent colors, consistent typography, and vector-based graphics that preserve clarity on any screen. Users can effortlessly customize color palettes, swap icons, adjust text, and leverage master slides for rapid theme updates. Designed for seamless compatibility, this template maintains full resolution across PowerPoint desktop and Google Slides online, eliminating formatting issues. Whether you’re mapping a gap analysis, outlining a transformation roadmap, or benchmarking performance targets, this unified template streamlines narrative flow and highlights key change initiatives with maximum visual impact.
Beyond the built-in layouts, the template includes a library of editable vector icons, fully customizable color themes, and optional master slide variants for dark or light backgrounds. Text placeholders support varied font sizes, ensuring readability and brand consistency. Designers can duplicate segments to create custom durations, reorder stages, or annotate transitional activities. The smart alignment guides and snap grids simplify layout adjustments, while grouped elements accelerate resizing and repositioning.
Whether presenting to C-suite stakeholders or cross-functional teams, this professional template transforms complex process narratives into engaging visuals. Its flexible design adapts to diverse project needs—from Lean Six Sigma initiatives to digital transformation roadmaps—allowing presenters to emphasize timeline milestones, performance metrics, or change management steps. With intuitive layouts and cohesive styling, this template empowers you to drive strategic alignment and foster data-driven discussions in any meeting environment.
Who is it for
Business leaders, project managers, and process improvement specialists will find this template invaluable for illustrating workflow enhancements and strategic initiatives. Marketing teams, operations analysts, Lean Six Sigma practitioners, and IT architects can leverage these layouts to communicate current-state assessments and future-state roadmaps. Consultants, trainers, and educators can adapt the designs for workshops, training sessions, and stakeholder briefings.
Other Uses
Beyond illustrating process evolution, repurpose this template for product launch timelines, technology adoption roadmaps, milestone tracking, or digital transformation frameworks. Use the comparison diagram to conduct gap analyses, maturity assessments, or “As-Is vs To-Be” evaluations. The arrow timeline variant can map marketing campaigns, sales pipelines, or annual strategic plans, making it a versatile visual asset across departments.
Login to download this file
Add to favorites
Add to collection

Item ID
SB03423