


Income Statement Template for PowerPoint
Description
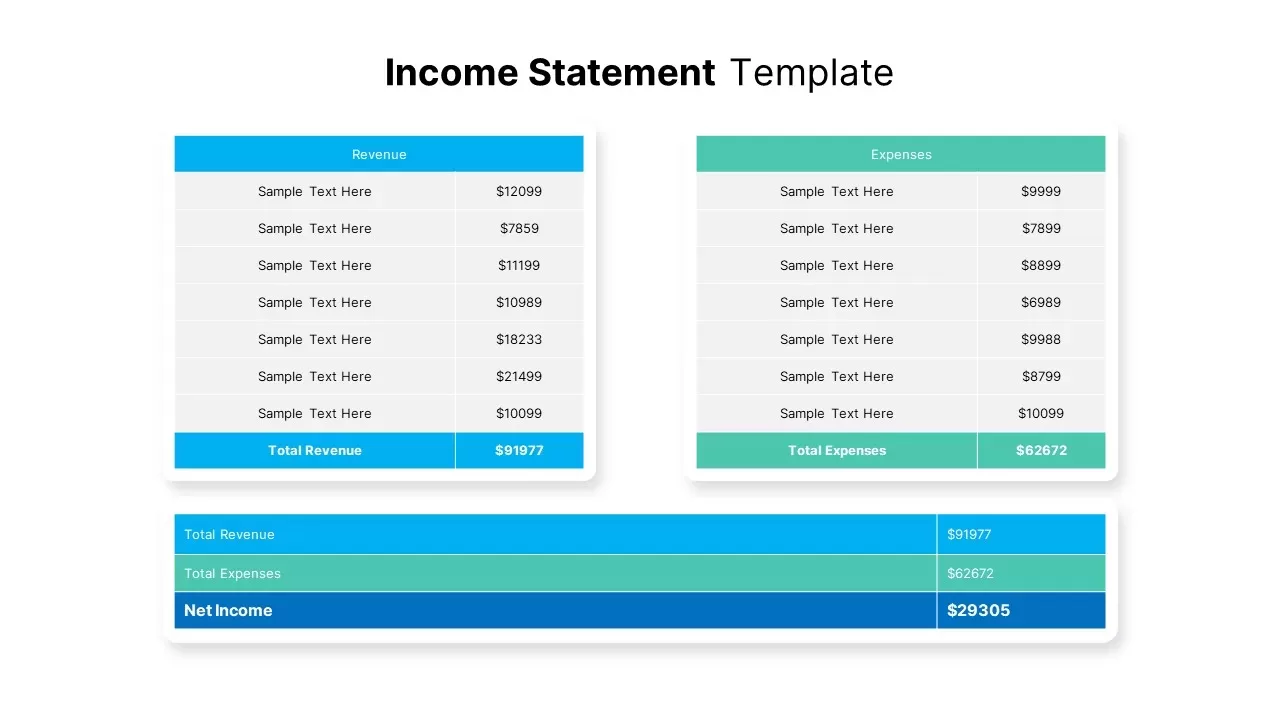
Leverage this income statement slide to present side-by-side revenue and expense breakdowns with clear totals and net income calculation. Two table panels—Revenue in vibrant blue and Expenses in mint green—list line items paired with dollar amounts and conclude with highlighted total rows. Beneath the tables, a full-width summary bar integrates total revenue, total expenses, and net income in a cohesive, color-coded format that guides stakeholders through financial performance at a glance. The flat vector design, crisp typography, and subtle drop shadows deliver a modern, professional aesthetic that enhances readability on any display.
Designed for seamless integration with PowerPoint and Google Slides, this template includes fully editable table shapes, intuitive drag-and-drop text placeholders, and master slide support for effortless customization. Resize columns, adjust header colors, or update fonts in seconds to align with corporate branding. The balanced grid layout and generous white space ensure maximum clarity and minimize visual clutter. Built-in theme settings enable consistent formatting across multi-slide decks, while modular slide masters reduce version-control headaches in collaborative workflows.
Modular by design, this asset allows you to duplicate, remove, or reorder panels to accommodate additional categories, forecast scenarios, or comparative analyses. Integrate it into budget proposals, boardroom presentations, or quarterly financial reviews without sacrificing style consistency. Empower finance teams, executives, and consultants to deliver data-driven insights with confidence, accelerating decision-making through a polished, data-rich infographic that transforms complex numbers into actionable recommendations.
Who is it for
Financial analysts, accountants, and CFOs will find this template invaluable for preparing monthly income statements, budget reports, and investor briefings. Project managers, consultants, and startup founders can also leverage the clear layout to monitor revenue streams and control expenses in strategic planning sessions.
Other Uses
Beyond traditional income statements, repurpose this slide for cash flow forecasts, departmental budget allocations, expense tracking, cost-benefit analyses, or high-level KPI dashboards. Adapt table panels to showcase sales performance, marketing ROI, or operational metrics in any professional context.
Login to download this file

Item ID
SB02984