


Isometric Map Powerpoint Keynote template 1
Description
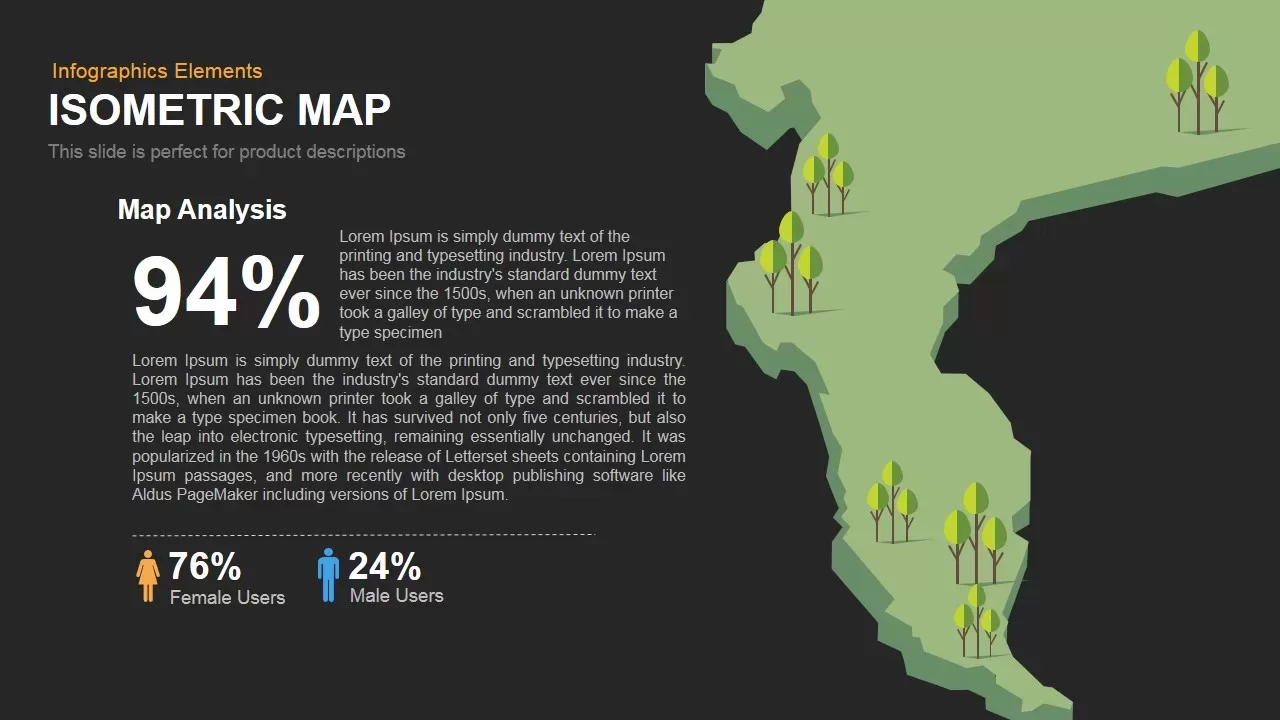
Leverage this impactful isometric map slide to illustrate regional metrics with precision and style. Dominating the right side of the canvas, a layered green isometric map of North America serves as an engaging backdrop for data visualization. Scattered tree icon clusters mark points of interest while a bold 94% callout under “Map Analysis” emphasizes key performance on a clean dark panel. Beneath the header paragraph, demographic icons display a 76% female and 24% male user split, accompanied by a dotted separator that organizes narrative text and reinforces visual hierarchy. The combination of vector shapes, high-contrast colors, and professional sans-serif typography creates a polished aesthetic that maintains clarity even when presenting dense information.
Built on fully editable master slides for PowerPoint and Google Slides, this template empowers users to customize every element effortlessly. Simply swap out the percentage metric, reposition tree icons, or recolor map zones to align with branding guidelines. Use alignment tools to add or remove icon clusters, adjust text placeholders for longer descriptions, or extend the map area to focus on different geographic regions. The slide supports both 16:9 and 4:3 aspect ratios, preserving design integrity across screens, projectors, and printed handouts. For enhanced engagement, apply sequential entrance animations to callouts and icons, guiding audience focus through each data point and narrative segment. Whether you are presenting environmental studies, market penetration, or resource distribution, this isometric map infographic slide offers the flexibility and professional polish needed to communicate complex information clearly and convincingly.
Tailor demographic metrics by replacing the gender icons and percentage figures to suit your survey results or audience profiles. The intuitive master layouts allow global theme updates, ensuring consistent styling across your entire deck.
Who is it for
Marketing managers, environmental analysts, and GIS specialists will leverage this isometric map slide to visualize geographic trends and regional performance metrics. Product strategists, sustainability teams, and operational planners can adapt the slide for resource allocation, site analyses, or survey data presentations.
Other Uses
Repurpose the layout to showcase sales territories, infrastructure projects, or demographic studies. Replace tree icons with custom symbols—such as factory, population, or facility markers—to visualize distribution data, risk assessments, or project milestones across any geographic region with the same engaging 3D effect.
Login to download this file
Add to favorites
Add to collection

Item ID
SB00105