


Process Flow Diagram Infographic Template for PowerPoint 3
Description
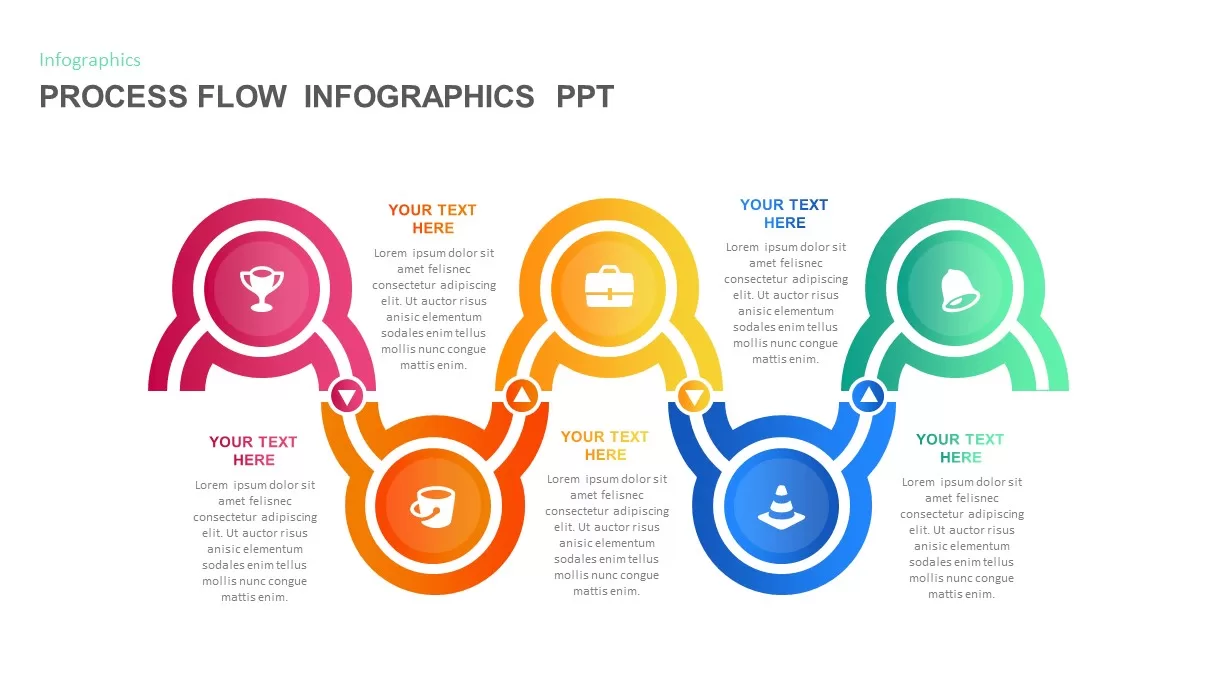
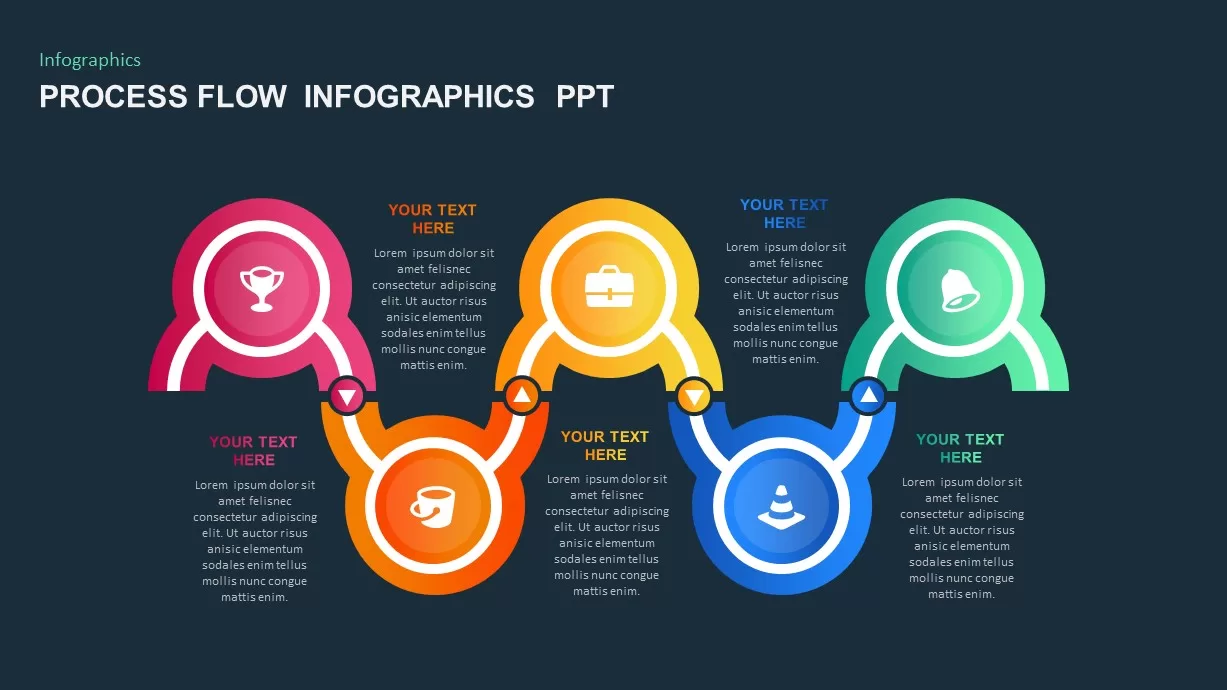
Leverage this five-step process flow infographic slide to convey sequential workflows with clarity and visual impact. Each stage is represented by a gradient circular node with a distinctive icon—trophy, coffee cup, briefcase, traffic cone, and notification bell—connected by smooth arching lines that guide audience focus from one step to the next. The modern gradient palette transitions through pink, orange, yellow, blue, and green, creating a vibrant yet cohesive aesthetic that adapts to diverse brand identities.
Designed on a clean white canvas with subtle iconography and legible typography, this slide offers intuitive placeholders for concise headlines and supporting text. The interconnected circular layout illustrates progression and interdependency, making complex processes easy to understand at a glance. Master slide integration and fully editable vector elements enable rapid customization of colors, icons, and text fields, streamlining the design workflow and ensuring consistency across presentations.
Optimized for both PowerPoint and Google Slides, this asset maintains crisp resolution and effortless formatting across platforms. Simply duplicate or rearrange nodes to accommodate additional steps or emphasize key milestones. Whether you need to map product development stages, outline project onboarding sequences, or illustrate strategic roadmaps, this versatile infographic enhances engagement and drives audience retention.
Who is it for
Project managers, business analysts, and operations teams will benefit from this process flow slide when presenting workflow designs, status updates, or procedural guidelines. Marketing professionals and consultants can leverage the clear visual progression to showcase campaign rollouts, user journeys, or event planning schedules.
Other Uses
Beyond standard process mapping, repurpose this slide to visualize customer experience flows, compliance checklists, training modules, or sales funnels. Harness the gradient circles to highlight performance metrics, risk checkpoints, or cross-departmental handoffs, making this infographic a multipurpose tool for any professional setting.
Login to download this file
Add to favorites
Add to collection

Item ID
SB01741