


ERP Systems Business PowerPoint Template
Description
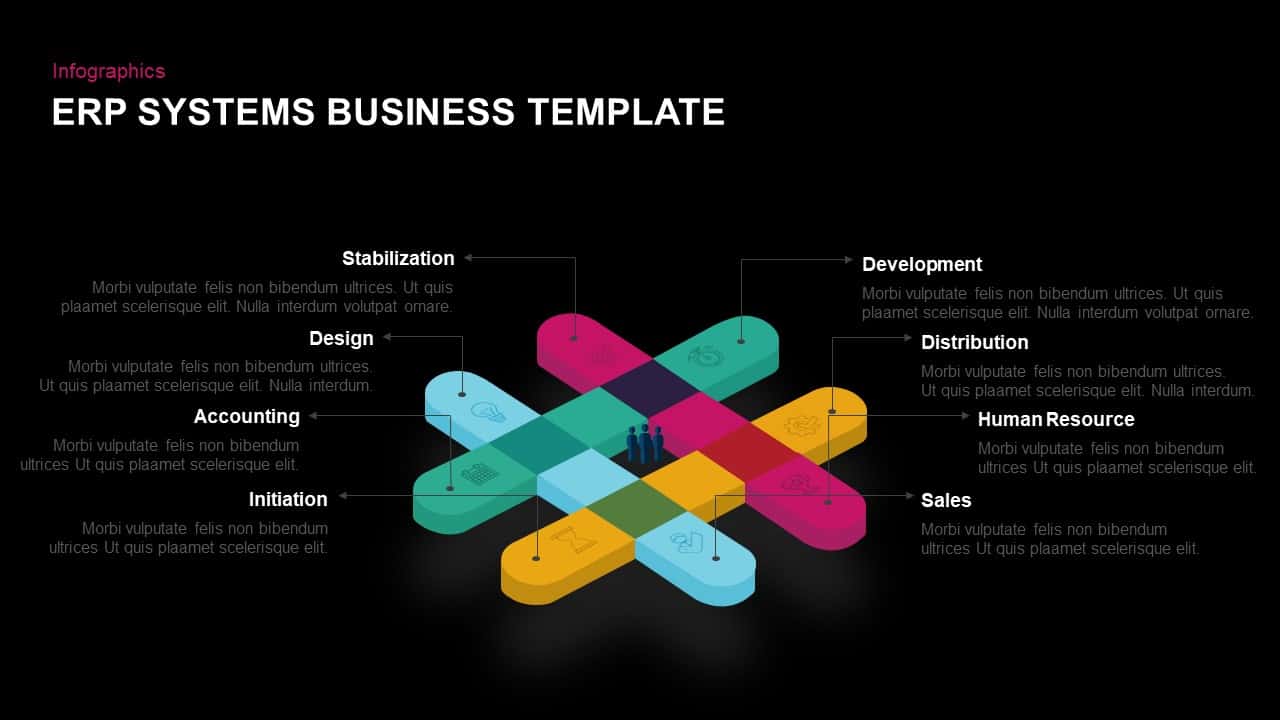
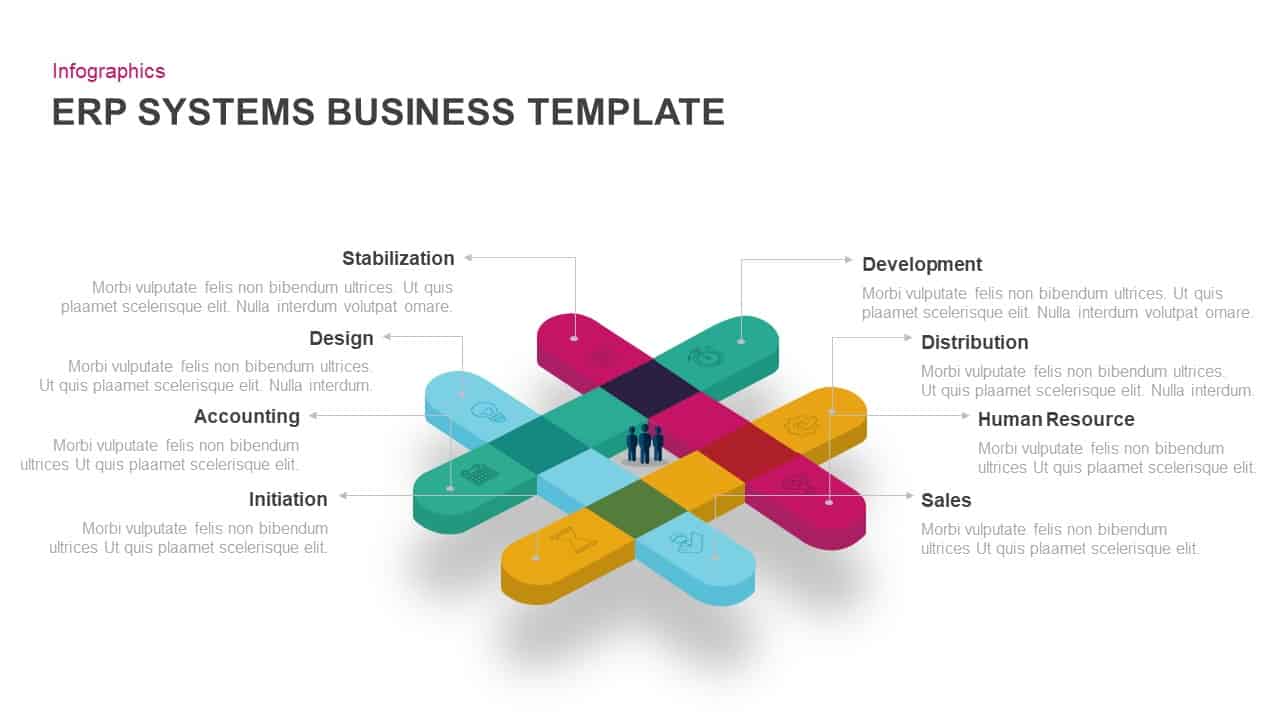
Leverage this innovative cross-shaped infographic to visualize ERP systems’ cross-functional modules in a cohesive framework. A three-dimensional lattice of eight interlocking bars radiates from a central hub, each bar topped with a distinct icon and label for key components such as Stabilization, Development, Distribution, Human Resource, Sales, Initiation, Accounting, and Design. The vibrant palette of teal, magenta, yellow, and light blue accents against a clean white background creates a professional yet engaging aesthetic, while subtle shadows add depth and clarity.
Designed for rapid customization, the slide employs fully editable vector shapes and master-slide layouts to ensure flawless scaling across screens and projectors. Simply swap module icons, update labels, or adjust color accents with a few clicks. Intuitive placeholders and connector lines align text annotations with their corresponding bars, maintaining consistent spacing and typography. Built-in guides support precise element alignment, and layered objects facilitate easy reordering or hiding of unused modules without disrupting the overall composition.
Ideal for IT managers, ERP consultants, project leaders, and senior stakeholders, this infographic slide transforms complex system architectures into an accessible visual summary. Use it to outline ERP implementation roadmaps, present functional requirements, or highlight interdependencies between core modules. The clear radial layout fosters stakeholder alignment by illustrating how each function integrates within the broader enterprise resource planning strategy.
Beyond ERP overviews, repurpose this flexible design for organizational structures, process mapping, or business model breakdowns. Duplicate bars to accommodate additional elements, switch to departmental icons for team charts, or apply custom color themes to match corporate branding. Compatible with both PowerPoint and Google Slides, this template guarantees uniform formatting and seamless integration across all devices.
Who is it for
IT managers, ERP consultants, project leaders, and senior stakeholders will benefit from this slide when mapping system modules, presenting implementation plans, or illustrating interdepartmental dependencies.
Other Uses
Repurpose this layout for organizational charts, process flows, or business model visualizations. Duplicate or hide bars to adjust module count, swap icons for functional highlights, or apply brand-specific colors for board presentations, training sessions, and strategic workshops.
Login to download this file

Item ID
SB01290