


4 Steps Onion Diagram PowerPoint Template
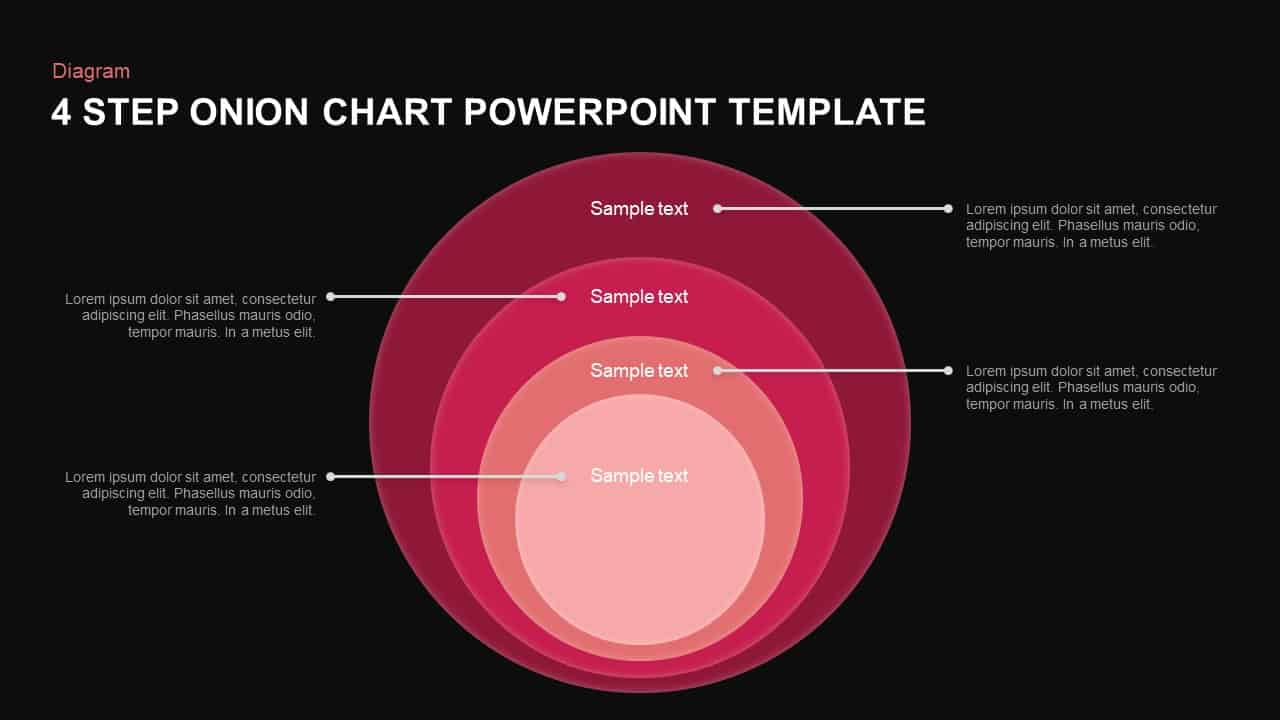
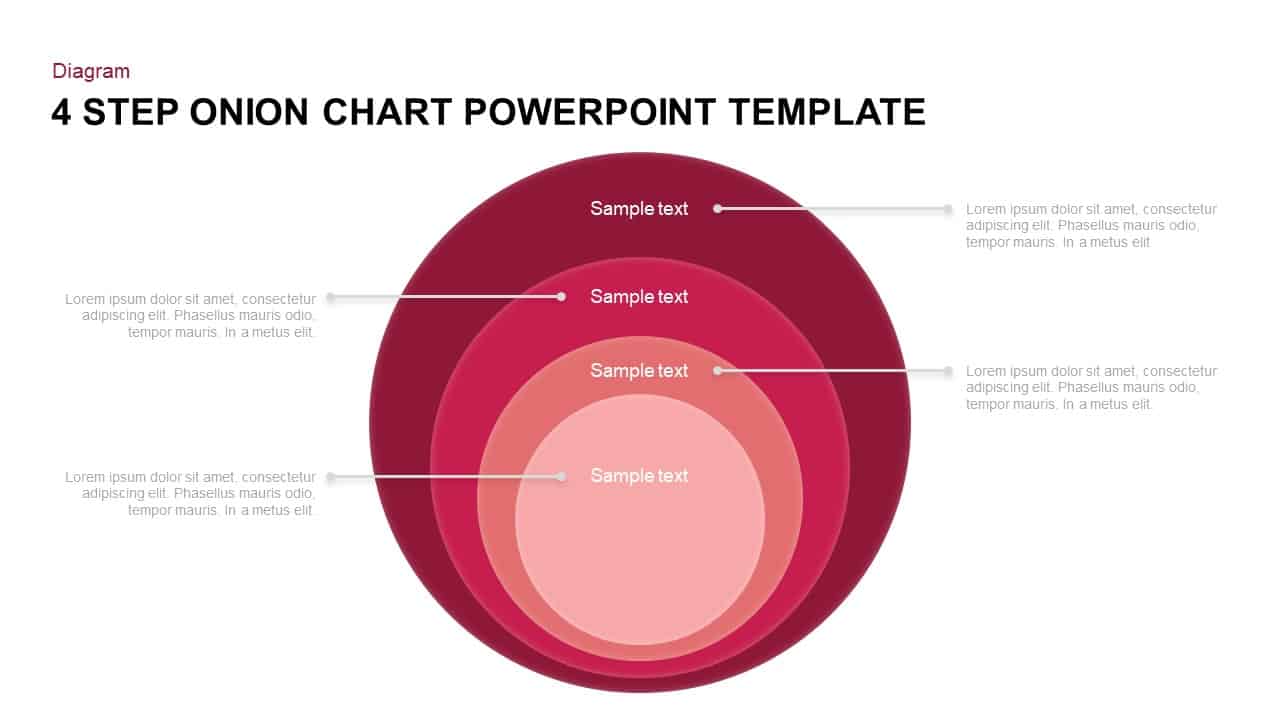
Visualize layered processes, root-cause analyses, or concentric prioritization frameworks with this bold four-step onion chart slide. Four nested circular rings in graduated red shades stack from largest (outer layer) to smallest (core), each representing a distinct step or level. Fine connector lines extend from each ring to editable text callouts for concise descriptions, objectives, or key insights. The clean white background and neutral gray typography ensure maximum readability, while the gradient color progression draws the audience’s eye inward, emphasizing core elements without clutter.
Built on master slides with fully editable vector shapes, this template lets you customize every aspect in seconds: adjust ring colors or thickness, reposition callouts, swap placeholder icons, or relabel steps to match your framework. Preconfigured entrance animations reveal each ring and its annotation sequentially, guiding viewers through your layered narrative with professional polish. Compatible with both PowerPoint and Google Slides, this slide maintains pixel-perfect clarity across devices and streamlines collaborative editing by locking formatting and alignment.
Whether you’re breaking down complex systems, illustrating multi-tiered strategies, or conducting layered analyses, this onion chart empowers you to present hierarchical information as an intuitive, engaging visual story. Simply duplicate the slide to expand your layers, hide unused rings for simpler models, or apply your corporate color palette to align with brand guidelines—ensuring design consistency and impact in every presentation.
Who is it for
Business analysts, project managers, and consultants will leverage this onion chart to map root-cause investigations, maturity assessments, or prioritized workstreams. Strategy teams, process engineers, and executive leaders can use its layered design to communicate depth, dependencies, and core imperatives clearly.
Other Uses
Repurpose this layout for risk-layer breakdowns, stakeholder-influence diagrams, or phased rollouts by renaming rings, swapping icons, or adjusting gradients. Its modular structure adapts seamlessly to any four-level model—from marketing funnels to compliance frameworks.
Login to download this file

Item ID
SB01207