


Four Square Diagram Powerpoint and Keynote template
Description
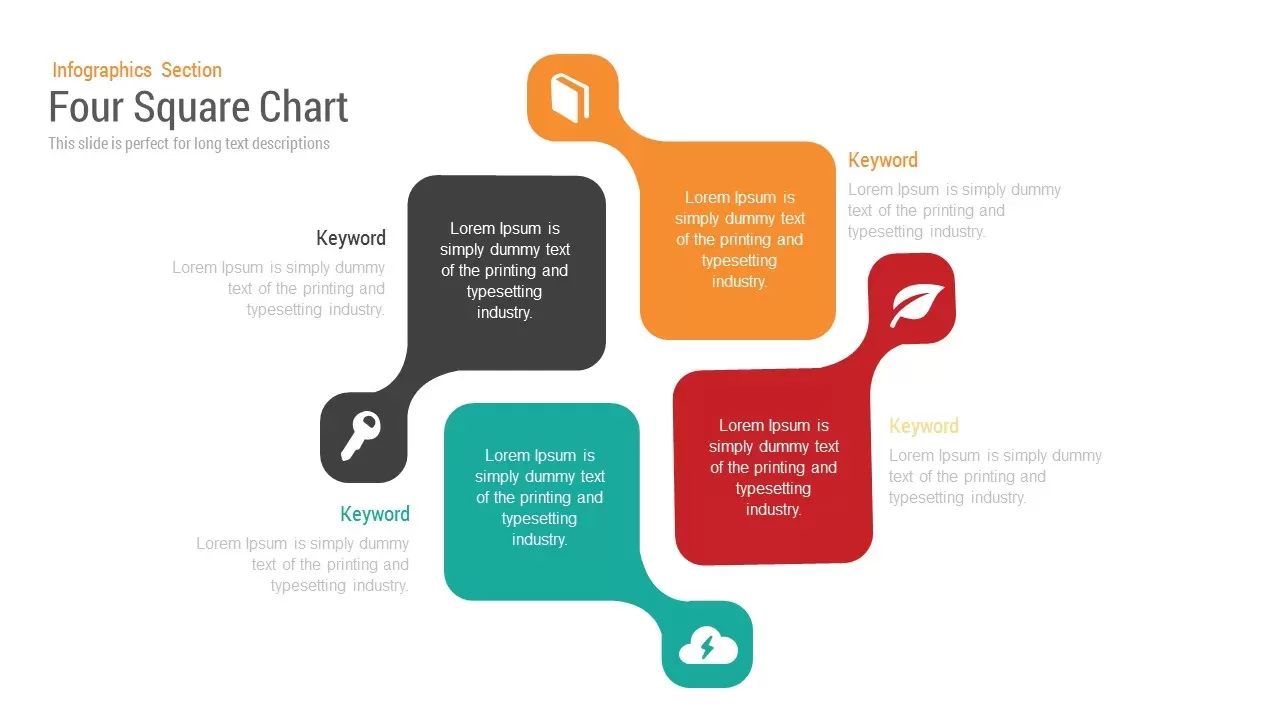
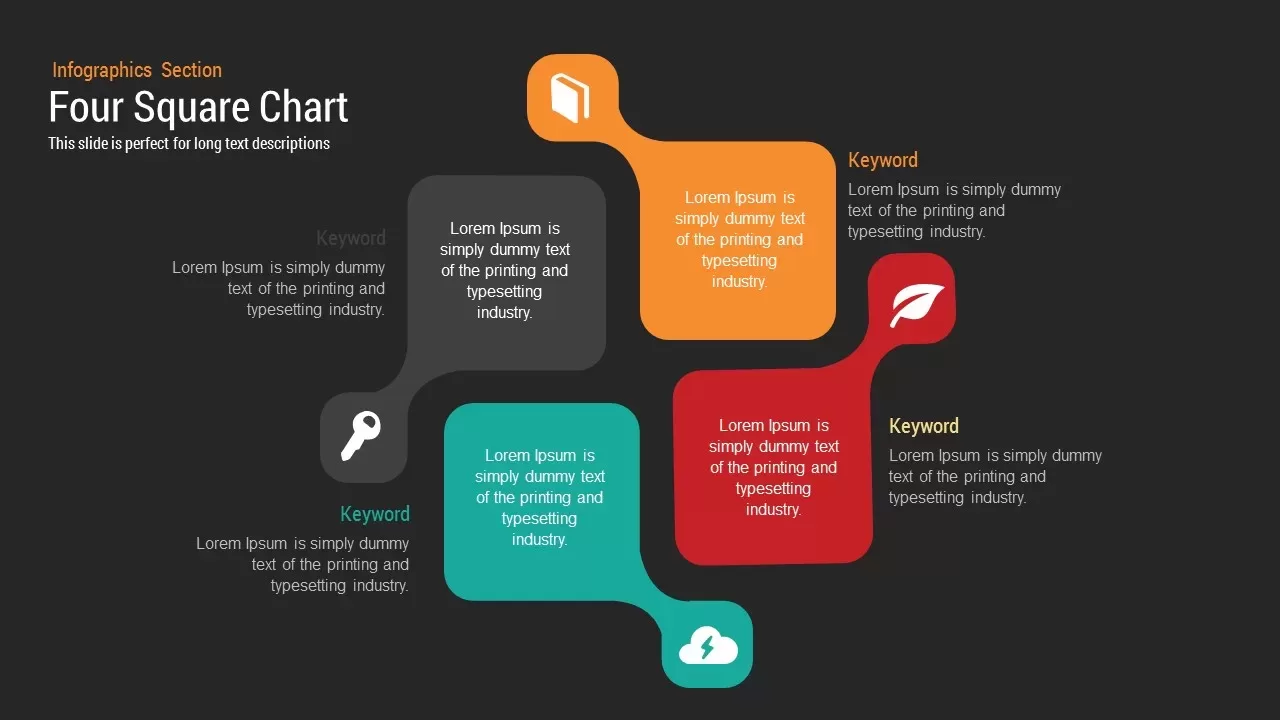
This Four Square Chart template presents a modern, flowing infographic on a high-contrast dark background. Four square modules with rounded corners are connected by smooth, tubular links that guide the viewer’s eye through each quadrant. Each module is rendered in a distinct theme color—neutral gray, vibrant orange, rich teal, and bold red—and contains a customizable vector icon at its hub. Around each square, editable text blocks support up to three lines of descriptive copy, allowing you to articulate features, services, or key concepts without cluttering the design.
Built on master slides for both PowerPoint and Google Slides, every element of this template is fully editable. Change module and connector colors with a single click via the theme palette, swap icons using drag-and-drop simplicity, and update typography globally with free web fonts. The vector-based graphics maintain pixel-perfect clarity on HD projectors, retina displays, and virtual meeting backgrounds, while subtle drop shadows beneath modules add depth and dimension.
The slide layout is optimized for both widescreen 16:9 and classic 4:3 aspect ratios, ensuring consistent alignment and spacing across formats. Hidden variation slides offer alternate color schemes, additional connector styles, and simplified layouts for rapid customization. With precision alignment guides built into the slide master, you can adjust module positions or connector curves without sacrificing balance. Entrance animations and morph transitions are preconfigured to guide audience attention sequentially through each module, reinforcing narrative flow and enhancing engagement. Whether you’re mapping service offerings, process steps, or strategic pillars, this Four Square Chart template streamlines professional slide creation and ensures brand cohesion across your entire deck.
Who is it for
Consultants, marketing managers, and product teams will find this template invaluable for presenting four related offerings or process stages in a visually engaging format. Project leads and executive strategists can leverage it to map core business functions, while educators and trainers can use the design to break down complex topics into digestible sections during workshops or seminars.
Other Uses
Repurpose this layout to compare feature sets, illustrate risk vs. reward quadrants, or showcase departmental capabilities. Swap connector styles for arrows to create directional flowcharts, or replace modules with KPI dashboards to adapt the slide for performance reviews, sales reports, or competitive analyses in minutes.
Login to download this file

Item ID
SB00019