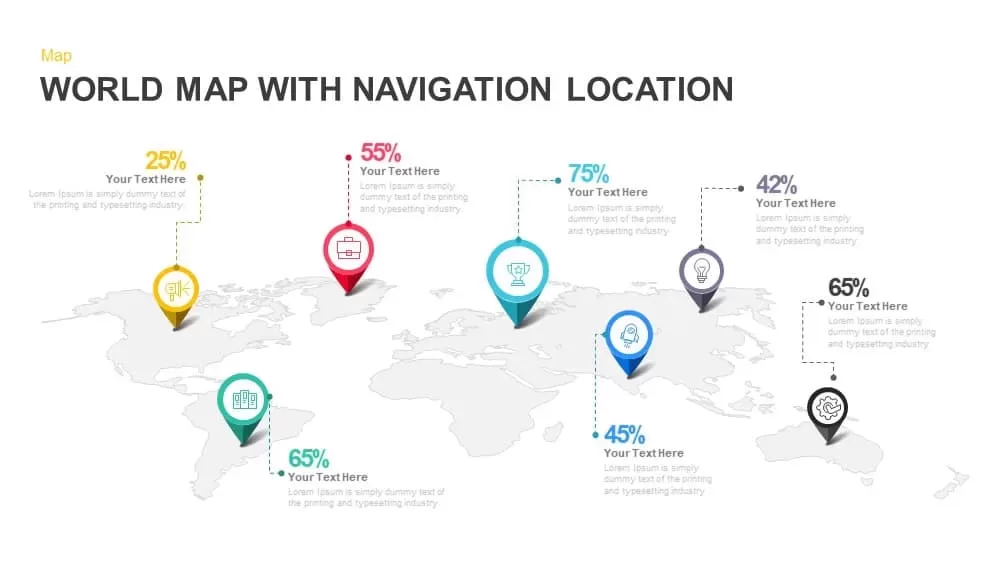
World Map with Navigation Location PowerPoint template


Leverage this interactive world map infographic slide to present regional performance metrics, market share data, or resource allocation with pinpoint accuracy. A subtle grayscale global map serves as the backdrop for seven colored location markers, each hosting a distinct flat icon—yellow megaphone for marketing, red briefcase for operations, teal building for headquarters, cyan trophy for sales achievements, dark purple lightbulb for innovation, light blue rocket for growth, and black gear for technical support. Percentage labels and dashed connector lines guide attention from each marker to fully editable text placeholders, ensuring clarity and coherence in your narrative. The clean flat design, subtle drop shadows, and generous white space deliver a modern, professional aesthetic that complements any corporate or startup branding.
Built entirely in vector format, every marker, icon, and text frame is easily resized, recolored, or repositioned without loss of quality. Master slide integration guarantees uniform styling throughout your deck, while intuitive placeholders allow you to update data and descriptions in seconds. Compatible with both PowerPoint and Google Slides, this slide preserves formatting integrity and high-resolution clarity across platforms and devices. Use entrance animations to introduce markers sequentially, spotlighting each region’s performance with precision.
Ideal for global sales reviews, market entry analyses, supply chain mapping, or demographic studies, this template helps stakeholders grasp geographical trends and regional comparisons at a glance. Whether you are illustrating year-over-year growth by continent, tracking campaign results across markets, or planning expansion strategies, the configurable markers and percentage labels provide visual impact and storytelling power.
Beyond data reports, repurpose this map to highlight office locations, franchise networks, or risk assessment hotspots. Remove or duplicate markers to fit your dataset, swap icons for different themes, or adjust connector styles to match branding. Its flexible customizability makes this slide ideal for any geo-focused presentation.
Who is it for
Sales directors, marketing strategists, business analysts, operations managers, supply chain planners, and consultants who need to present location-based data and regional insights.
Other Uses
Use this slide to showcase franchise location overviews, site selection analyses, market penetration comparisons, risk hotspot mapping, travel itineraries, or global network visualizations.
Login to download this file


