search

Essentials

Must-have decks for quick wins

By Industry

Professionally tailored slides for every sector

By Style

Minimal, modern and creative designs

By Topic

Explore slides curated by purpose and theme

TimelineTimelineRoadmapRoadmapStrategyStrategyGoalsGoalsTableTableComparisonComparisonSWOTSWOTAgendaAgendaArrowArrowWorld MapWorld MapMapsMapsProcessProcessFunnelFunnelTeamTeamOrg ChartOrg ChartPyramidPyramidCircularCircular

Business PlanBusiness PlanBusiness StrategyBusiness StrategyBusiness ProposalBusiness ProposalBusiness ModelsBusiness ModelsDigital MarketingDigital MarketingMarketing FunnelMarketing FunnelCustomer ExperienceCustomer ExperienceProject StatusProject StatusGantt ChartGantt ChartRecruitmentRecruitmentEmployee PerformanceEmployee PerformanceLeadershipLeadershipAIAIMachine LearningMachine Learning

AI Presentation Maker

Install the Windows plugin for quick access to templates and design tools.

AI Infographics Maker

Use our Office 365 add - in to access templates directly from the cloud.

Exe Version

Install the Windows plugin for quick access to templates and design tools.

Office 365

Use our Office 365 add - in to access templates directly from the cloud.

Mac Version

Get the Mac plugin to easily browse, insert, and customize templates and visuals within PowerPoint.

World Map Bubble Infographics powerpoint and keynote slide
World Map Bubble Infographics powerpoint and keynote slide
This template is part of a deck featuring multiple slides. To check out all slides, click on See All. See All round right arrow
world map bubble PowerPoint template

Description

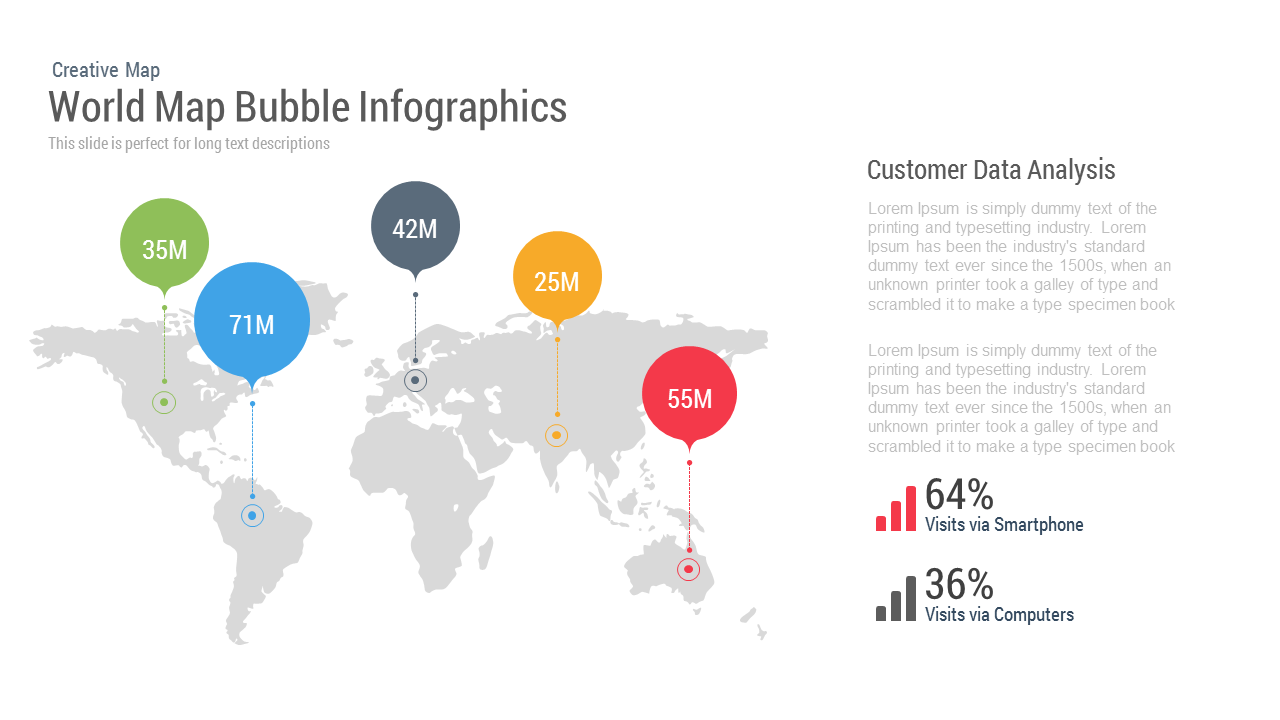
This World Map Bubble infographics template features a dark, full-slide world map as its foundation and five vibrant bubble markers to showcase regional data points. Each marker is keyed by a colored circle—green, blue, gray, yellow, red—and connects via dashed lines to pinpoint locations across the Americas, Europe, Asia, and Oceania. Numeric data labels inside each bubble allow audiences to quickly compare values such as 35M, 71M, 42M, 25M, and 55M between regions.

On the right, a Customer Data Analysis panel provides space for two descriptive paragraphs, followed by a pair of percentage metrics with miniature bar chart icons illustrating device split: 64% visits via smartphone and 36% via computers. Built on master slides, the design supports global theme edits including color palettes, typography through free web fonts, and vector icon swaps. Users can adjust bubble sizes, map opacity, and connector styles with simple drag-and-drop. Text fields accept rich formatting for headings, body copy, and metric callouts. The template is optimized for 16:9 widescreen and 4:3 formats, ensuring crisp rendering on HD projectors and virtual presentation platforms. Subtle drop shadows and precise alignment deliver a polished and modern infographic aesthetic. A hidden variation slide offers alternate color schemes and map styles for quick theme switching. Leverage entrance animations or morph transitions to guide viewer attention from map visualizations to data insights seamlessly. Whether presenting global sales figures, market penetration, or audience segmentation across regions, this template streamlines the creation of professional, data-driven visuals in PowerPoint or Google Slides. It’s ideal for corporate reports, marketing dashboards, and academic research presentations.

Who is it for

Marketing managers, data analysts, and business strategists will find this template indispensable for presenting geospatial insights and regional performance metrics. Consultants and executives can employ it in investor pitches or annual reports. Educators and academic researchers can illustrate demographic studies and case analyses.

Other Uses

Beyond audience metrics, repurpose the slide to visualize sales territories, project rollouts, supply chain networks, or epidemiological data. Swap bubbles for icons to create risk heat maps, resource allocation charts, or global campaign overviews.

Login to download this file