Working Capital Management PowerPoint Template featured image

Description
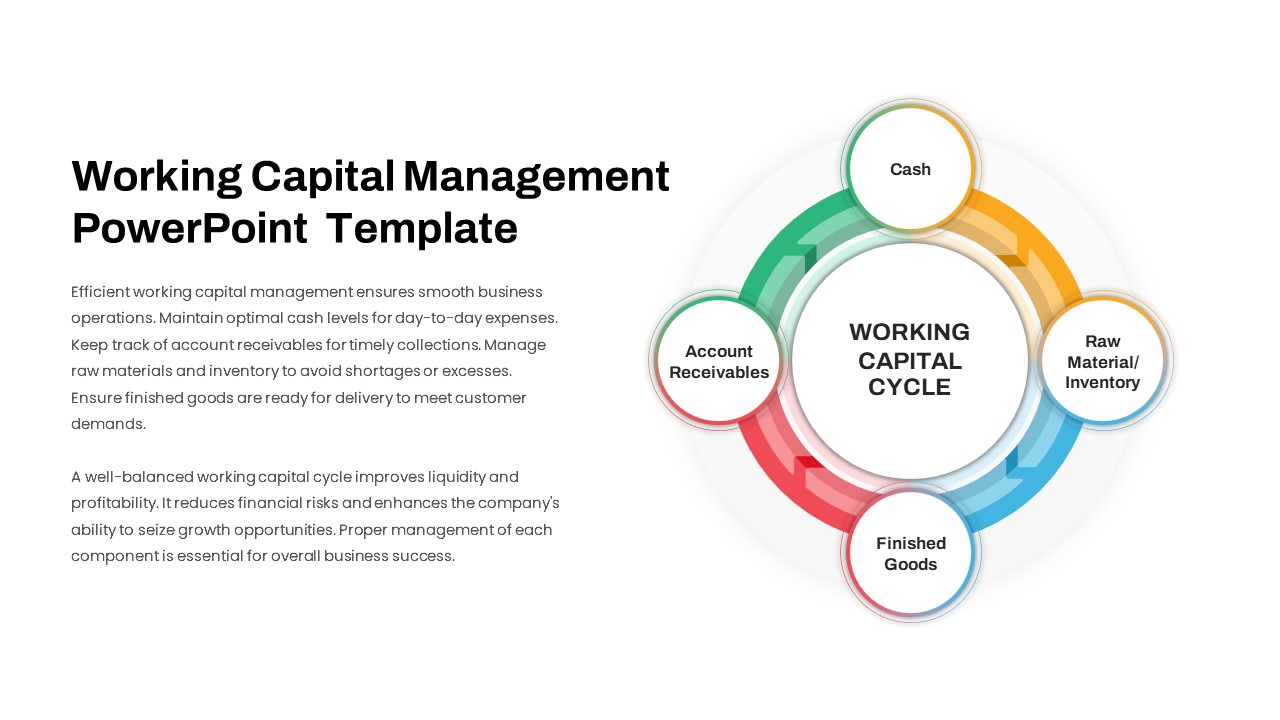
Leverage this Working Capital Cycle Diagram slide to illustrate the essential stages of working capital management within a streamlined circular framework. Four color-coded segments—Cash, Raw Material/Inventory, Finished Goods, and Account Receivables—are arranged around a central hub to depict the continuous flow of resources. Each wedge features an intuitive icon above a bold label and customizable text placeholder for definitions, KPIs, or process notes.
Crafted with a modern flat design and crisp typography, this slide delivers a polished aesthetic that adapts seamlessly to corporate branding. Built on editable master slides, the template lets you adjust segment order, swap icons, refine hues, or update labels in seconds. The layout is optimized for both PowerPoint and Google Slides, maintaining full-resolution clarity across devices and eliminating formatting headaches.
Designed for collaborative workflows, the slide supports real-time coauthoring and version control, ensuring stakeholders can iterate on working capital strategies without losing alignment. The integrated color guide, typography presets, and accessible design elements promote brand consistency and compliance with visual accessibility standards. Use the prebuilt callout boxes to spotlight critical metrics, best practices, or process targets alongside each stage of the cycle.
Whether you’re delivering a financial review, presenting CFO briefings, or training accounting teams, this Working Capital Cycle Diagram slide will engage audiences and clarify complex cash-flow dynamics. Beyond finance, repurpose this versatile infographic to map the order-to-cash process, visualize procurement workflows, illustrate inventory turnover cycles, or craft operational performance dashboards. Simply duplicate, reorder, or recolor segments to match your presentation needs and drive data-driven decision-making across departments.
Who is it for
CFOs, financial analysts, accounting managers, controllers, and supply-chain professionals will find this slide invaluable for visualizing and managing the cash-to-cash cycle, improving liquidity, and optimizing operational efficiency.
Other Uses
Repurpose this diagram to illustrate order-to-cash processes, procurement and inventory cycles, production workflows, or operational dashboards in workshops, training sessions, and executive briefings.
Login to download this file


