Quad Chart PowerPoint Template Dark


Description
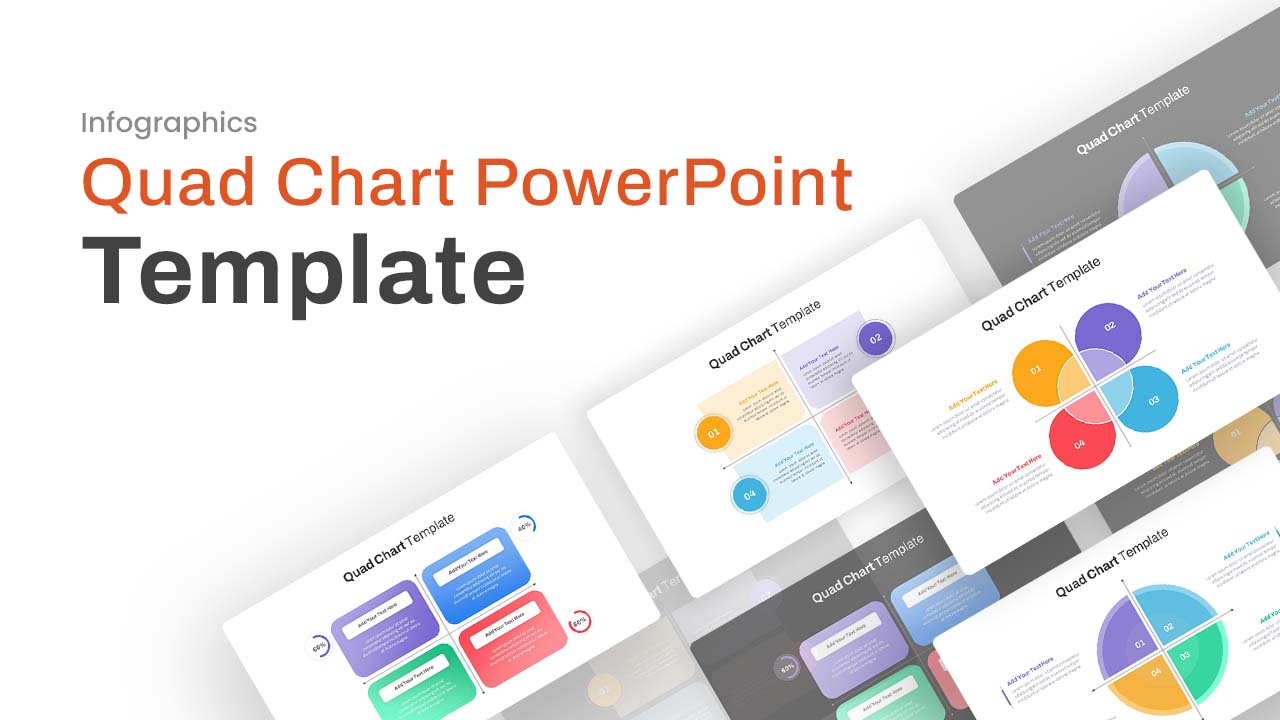
Leverage this versatile quad chart slide to communicate four interconnected data points, strategies, or performance metrics in a cohesive quadrant layout. This comprehensive template includes multiple design variations—from classic quarter-circle diagrams and radial semi-circles with directional arrows to gradient-filled rectangular modules with integrated percentage widgets—enabling you to select the style that best aligns with your content and brand identity. Each quadrant features editable text placeholders, vector shapes, and intuitive layout guides, ensuring effortless customization and alignment. Subtle gradients, curved corners, and minimalist icon accents deliver a modern, professional aesthetic that resonates in both PowerPoint and Google Slides.
Designed with flexible axis markers and directional arrows, the slide automatically adjusts quadrant labels based on value orientation, making it ideal for SWOT analyses, risk matrices, priority grids, or performance landscapes. Built-in smart guides and alignment tools guarantee pixel-perfect placement, while optional statistic circles and progress arcs let you highlight key percentages or milestones, driving data-driven storytelling with impact.
Engineered for maximum efficiency, this template harnesses master slides, layered objects, and color-coded themes, allowing you to swap colors, reposition elements, or adjust text in seconds. Whether illustrating market segments, competitive positioning, project phases, or departmental KPIs, the structured design fosters clear storytelling and data-driven discussions. The slide’s responsive layout ensures full-resolution clarity across screens and devices, eliminating formatting issues and maintaining visual consistency throughout your deck.
Beyond traditional quadrant analyses, this adaptable quad chart can be repurposed for KPI dashboards, competitive assessments, strategic planning sessions, investor updates, or executive summaries. Simply mix and match variations, adjust color palettes, or combine elements to craft customized performance reviews, roadmap overviews, or vision-and-mission grids that captivate stakeholders and drive alignment.
Who is it for
Business analysts, project managers, marketing leaders, and executives will benefit from this quad chart when presenting strategic priorities, risk assessments, or performance metrics. Consultants, data scientists, and educators can leverage the intuitive quadrant design to simplify complex concepts and drive stakeholder engagement.
Other Uses
Use this slide for product portfolio analysis, customer segmentation, risk vs. reward matrices, project status reports, training modules, or vision-and-mission presentations across departments and industries.
Login to download this file


