


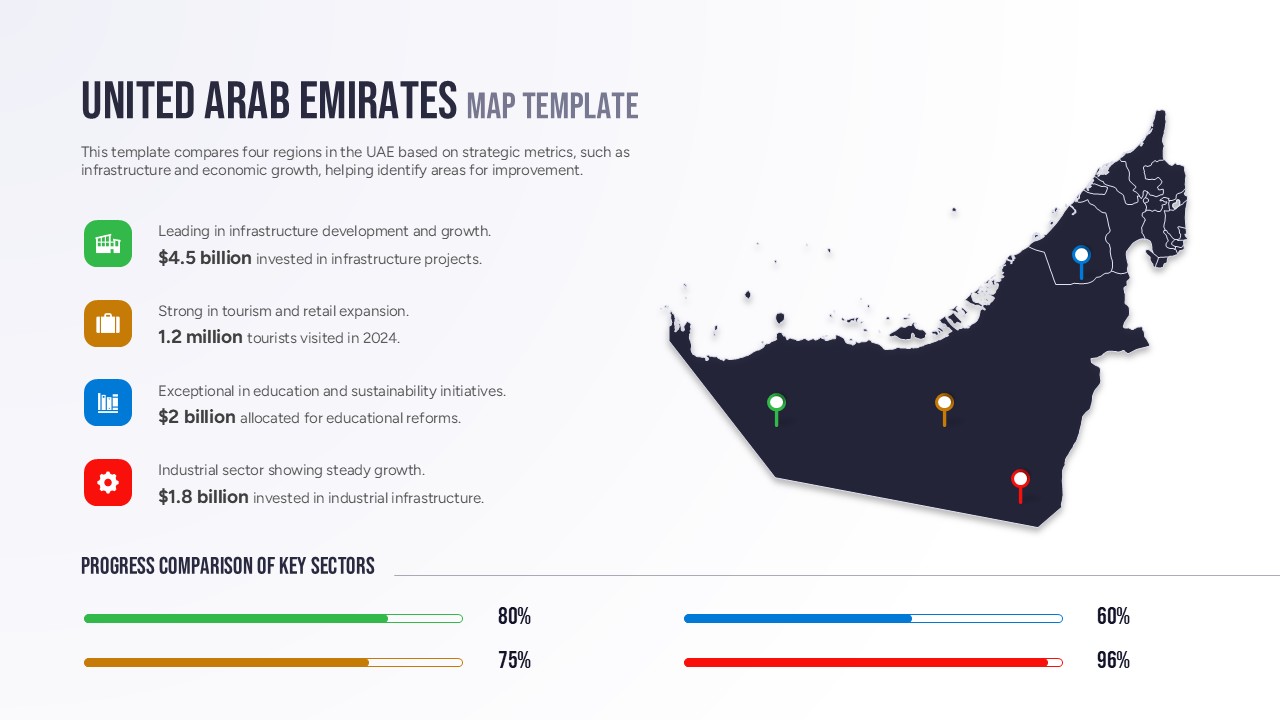
Editable United Arab Emirates Regional Map
This template is part of a deck featuring multiple slides. To check out all slides, click on See All.
See All

Login to download this file
Item ID
SB05623Designed By
Geethu

Login to download this file
Item ID
SB05623Designed By
Geethu