Umbrella-and-Rain-PPT-Template


Description
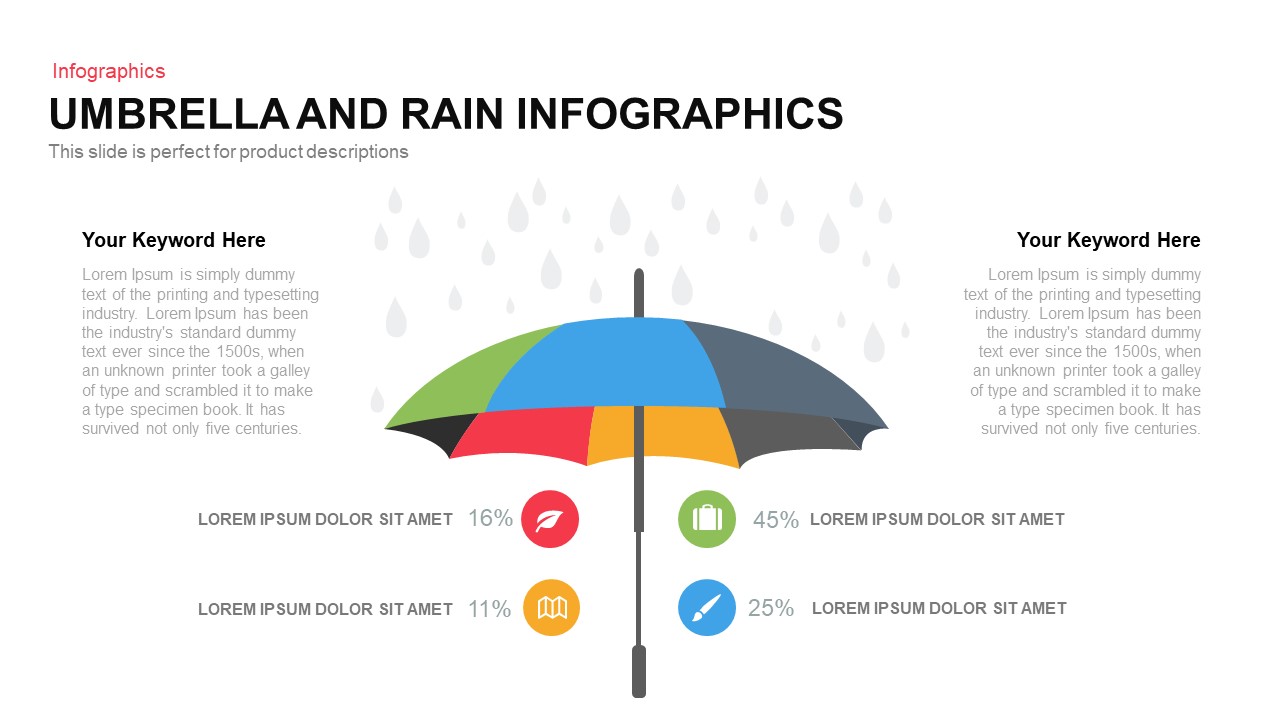
Leverage this striking umbrella infographic slide to visualize comparative metrics and protect insights under a unified visual metaphor. A vector-based umbrella canopy—divided into color-blocked segments (green, blue, and gray)—shelters two editable droplet icons at the base, each displaying a percentage value (15% and 25%) and accompanying label. Flanking the canopy, two text blocks titled “Your Keyword Here” allow for concise contextual explanations or data summaries. Subtle raindrop silhouettes in the background reinforce the theme, while semi-transparent gradient arrows on the slide margins suggest guided, carousel-style navigation.
Built on fully editable master slides, every element is vector-driven for seamless scaling across PowerPoint and Google Slides. Swap canopy hues to match your brand palette, adjust droplet percentages and colors, update text placeholders, or reposition callout lines in seconds. The clean white backdrop and minimalist typography ensure maximum readability, while balanced white space highlights your core content without distraction. Whether you’re comparing performance KPIs, illustrating risk-management thresholds, or showcasing dual processes, this template streamlines your workflow and maintains pixel-perfect fidelity on any device.
Who is it for
Data analysts, project managers, risk officers, and marketing strategists will leverage this umbrella infographic to compare two key metrics, illustrate protection strategies, or highlight dual-scenario analyses in stakeholder briefings, board presentations, and executive summaries.
Other Uses
Repurpose this slide for A/B test results, budget vs. spend comparisons, resource-allocation overviews, or customer satisfaction metrics. Replace droplet icons with custom glyphs to map survey segments, quality thresholds, or risk levels, adapting the layout to any dual-metric narrative.
Login to download this file


