Traditional vs Digital Economy Template for PowerPoint & Google Slides

Description
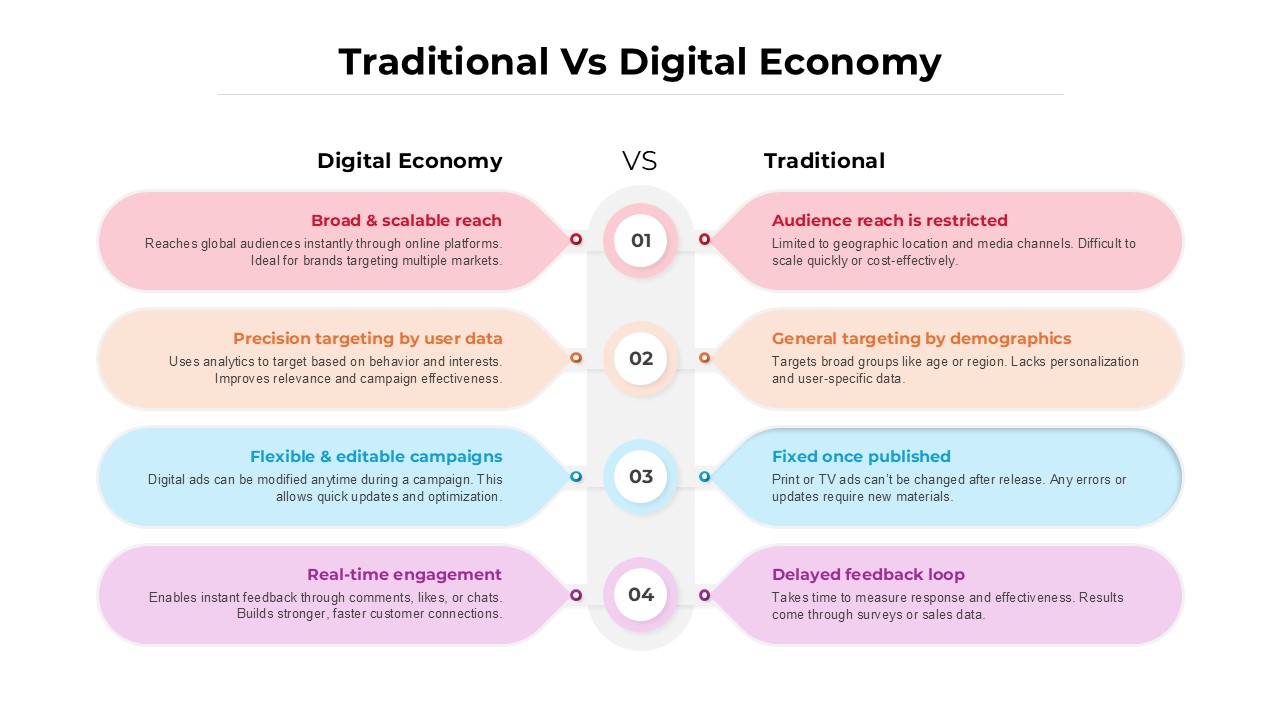
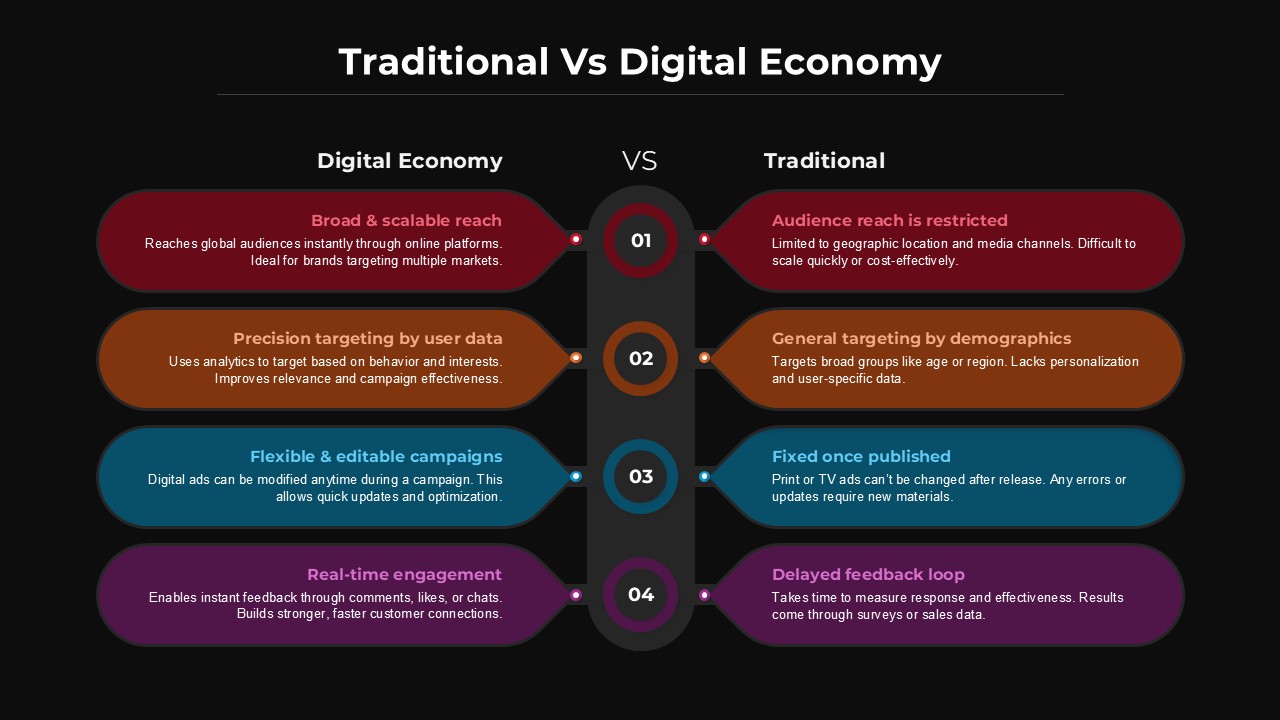
Present a comparative analysis of digital and traditional economies with this side-by-side infographic slide, featuring four horizontal capsule callouts connected by a central timeline. Each callout contrasts key dimensions—broad & scalable reach vs restricted audience reach; precision targeting by user data vs general demographic targeting; flexible & editable campaigns vs fixed once published; and real-time engagement vs delayed feedback loops—to highlight advantages and limitations at a glance. The pastel-colored capsules and bold headlines ensure readability, while vector icons add visual cues for rapid comprehension. A clean white background and subtle divider line reinforce a modern, uncluttered aesthetic that aligns with diverse branding styles and corporate identities.
Engineered for maximum adaptability, this template utilizes master slides, editable placeholders, and fully scalable vector graphics, allowing you to swap text, update icons, or adjust color gradients in seconds. Whether you’re delivering a marketing strategy briefing, boardroom presentation, or workshop on digital transformation, the intuitive layout simplifies slide creation and maintains consistent formatting across PowerPoint and Google Slides. High-resolution output ensures crisp visuals on any device, and built-in alignment guides minimize manual adjustments.
Beyond comparing economies, this versatile slide can be repurposed for campaign performance reviews, marketing channel evaluations, change management comparisons, or competitor analysis frameworks. Simply rename callout headings and replace icons to fit any dual-sided comparison or dichotomy—such as online vs offline sales, cloud vs on-premises solutions, or agile vs waterfall methodologies. This infographic empowers teams to present complex contrasts clearly, drive data-driven decisions, and engage stakeholders with a structured, impactful narrative.
Who is it for
Marketing leaders, digital strategists, CIOs, and business consultants will find this slide invaluable for illustrating the shift from traditional to digital paradigms. It also benefits project managers, innovation teams, and educators seeking to explain comparative frameworks.
Other Uses
Repurpose this layout for channel performance comparisons, feature vs feature evaluations, product roadmaps, or methodology breakdowns. Adjust labels and icons to visualize any dual-axis analysis—such as on-prem vs cloud, B2B vs B2C, or manual vs automated processes.
Login to download this file

Item ID
SB04996
Related Templates

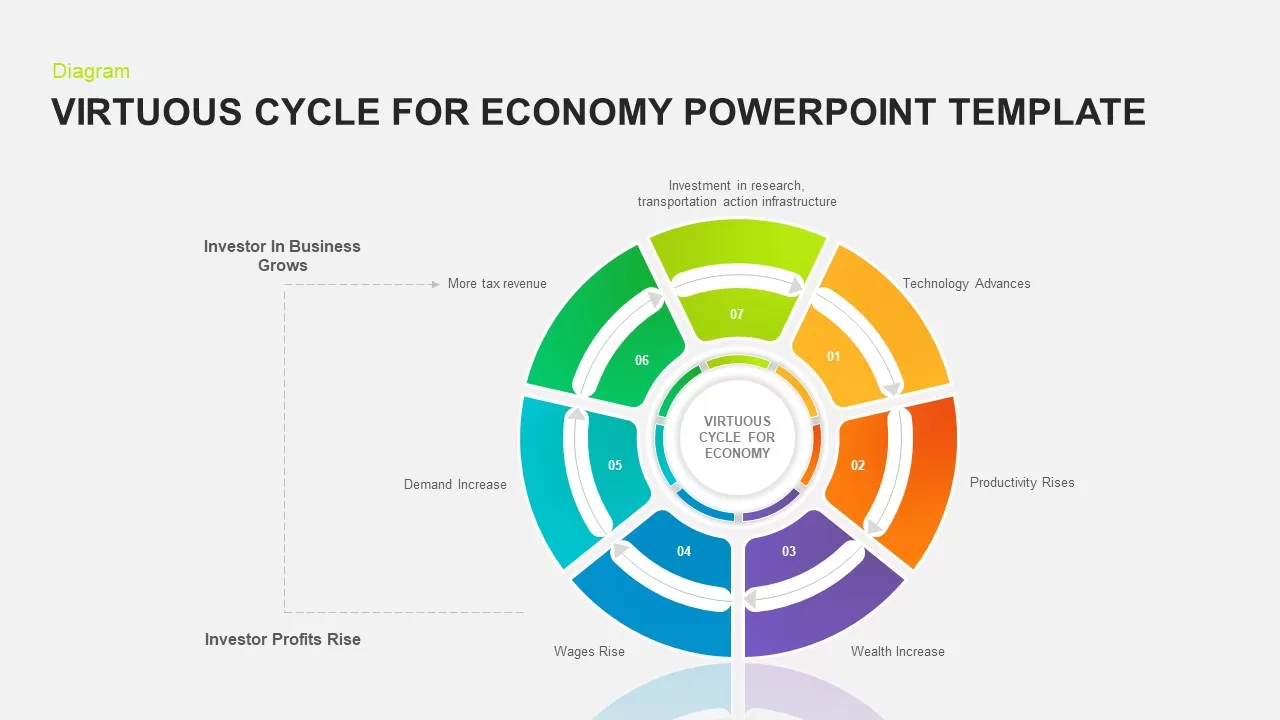
7-Step Virtuous Economy Cycle Diagram Template for PowerPoint & Google Slides
Process
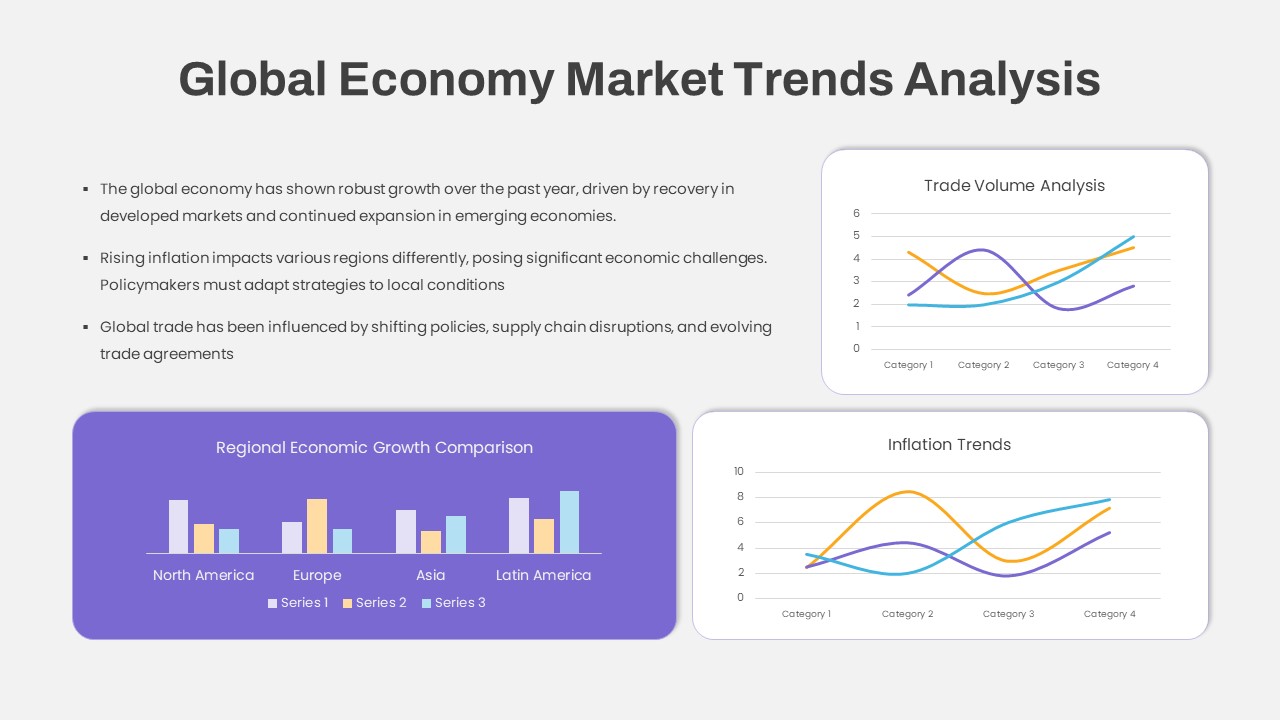
Global Economy Market Trends Analysis Template for PowerPoint & Google Slides
Comparison Chart
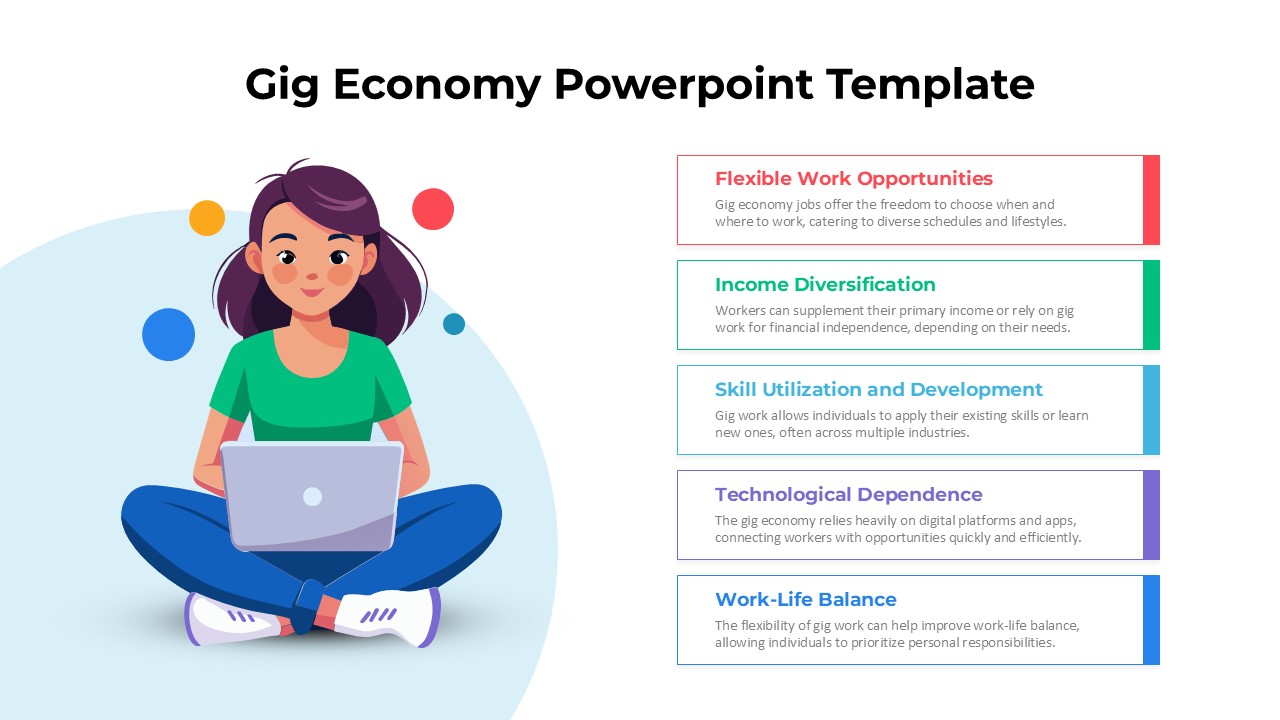
Gig Economy Infographic One-Pager Template for PowerPoint & Google Slides
Comparison
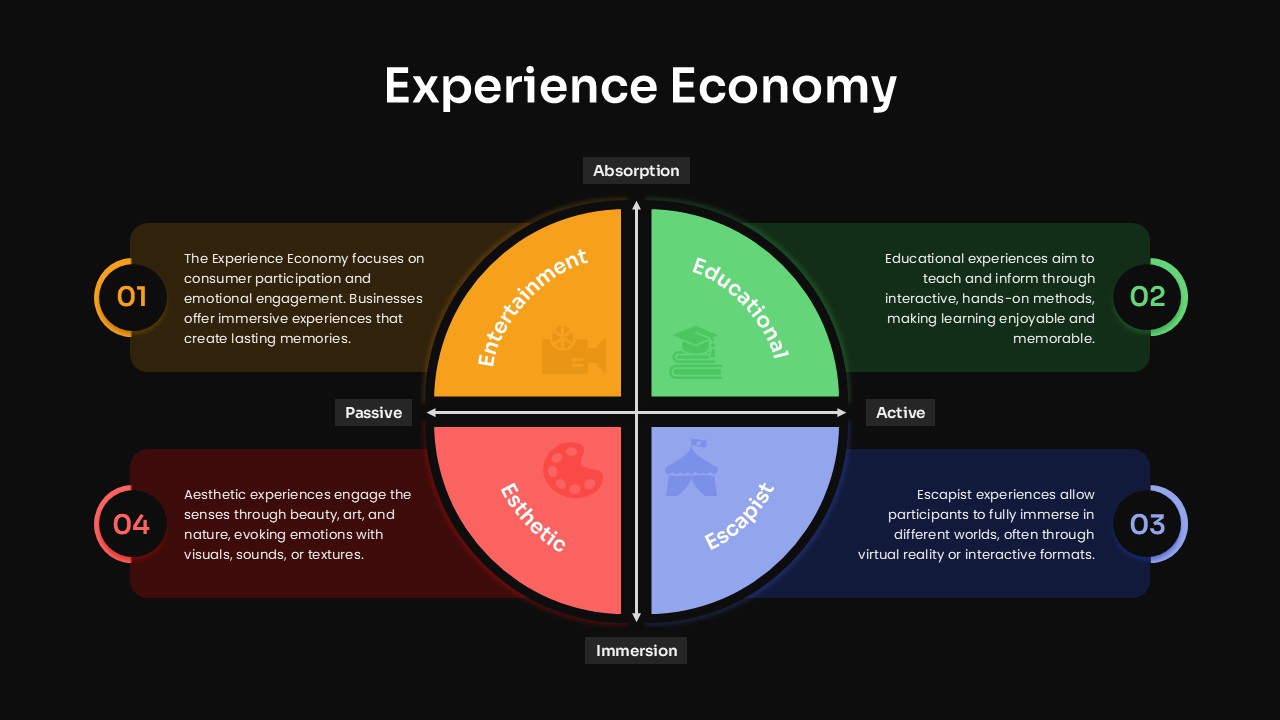
Experience Economy Quadrant Diagram Template for PowerPoint & Google Slides
Circular
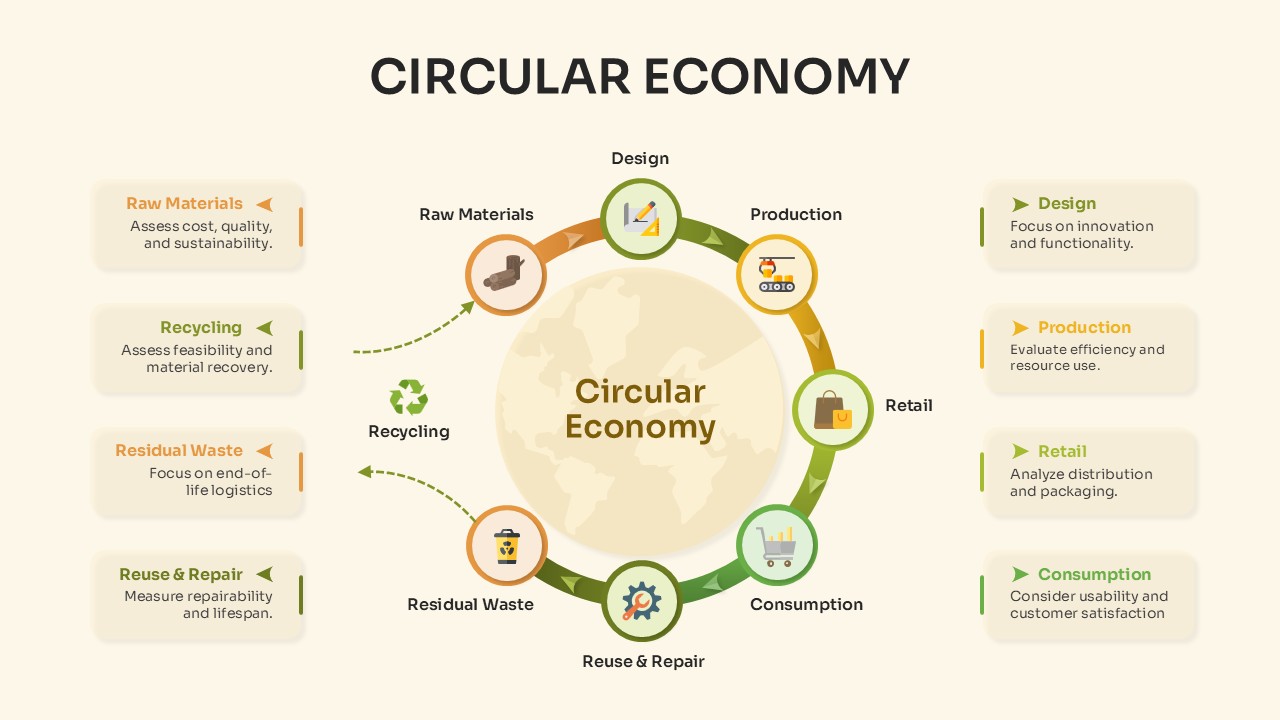
Circular Economy Process Overview Template for PowerPoint & Google Slides
Circular

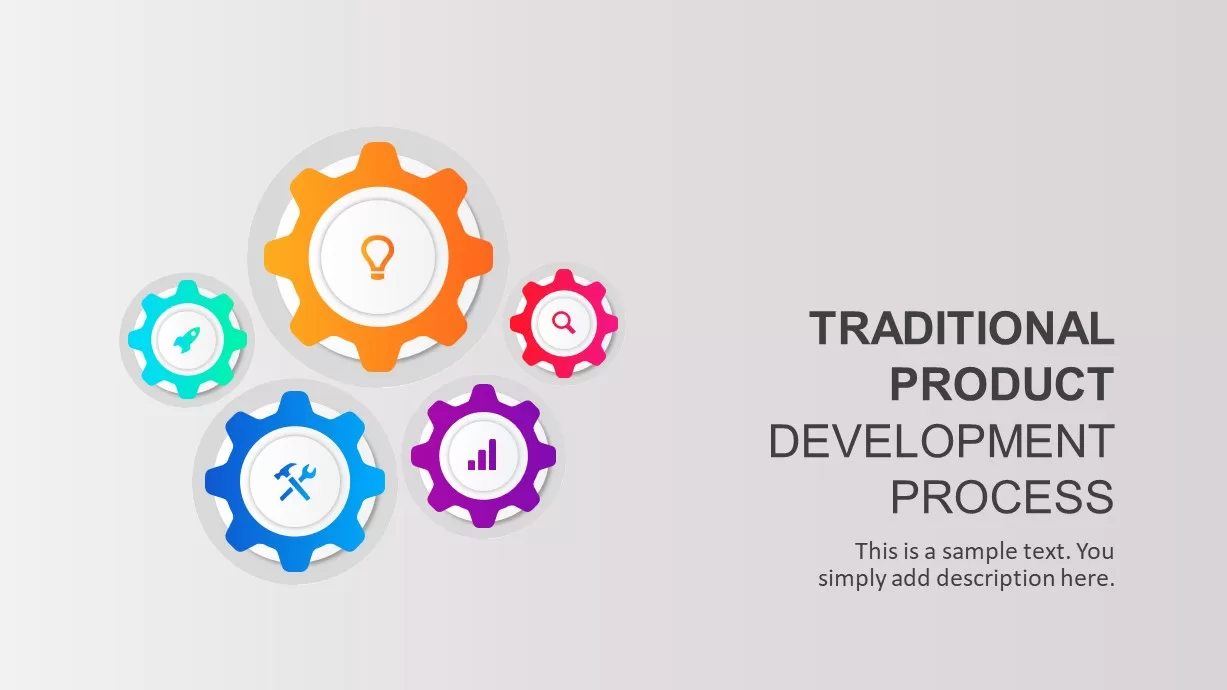
Traditional Product Development Process Template for PowerPoint & Google Slides
Process
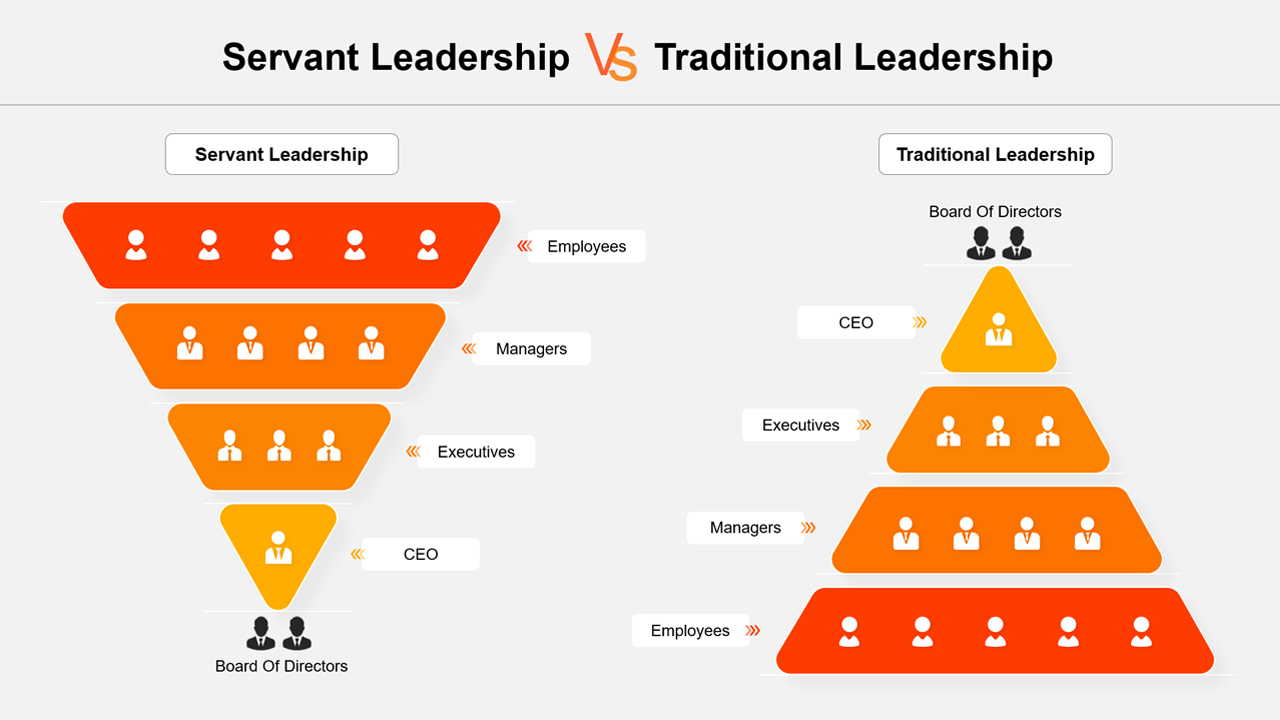
Servant Leadership vs Traditional Leadership Template for PowerPoint & Google Slides
Leadership
Digital Marketing Roadmap PowerPoint Template for PowerPoint & Google Slides
Digital Marketing

Maximum Digital Presentation Template for PowerPoint & Google Slides
Company Profile
Free

Digital Marketing Report Deck Template for PowerPoint & Google Slides
Pitch Deck
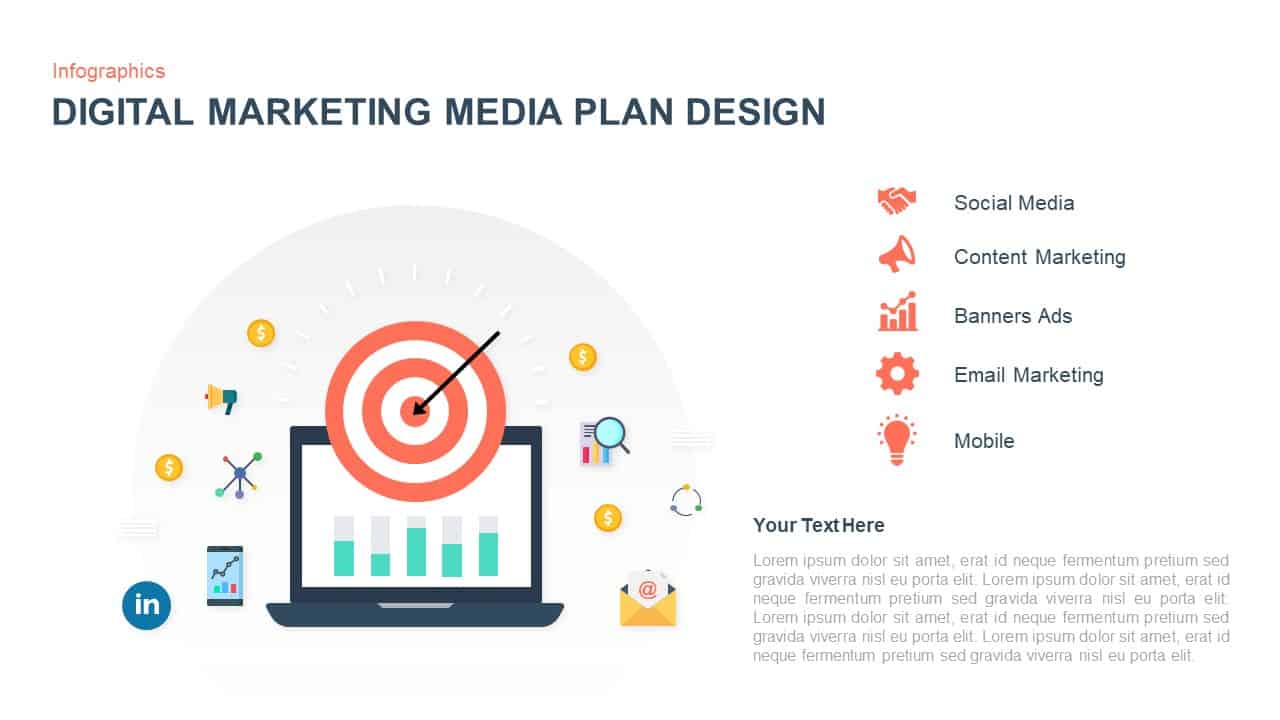
Digital Marketing Media Plan Infographic Template for PowerPoint & Google Slides
Digital Marketing
Vibrant Digital Marketing Metaphor Template for PowerPoint & Google Slides
Advertising
Modern Digital Marketing Strategy Template for PowerPoint & Google Slides
Pitch Deck
Digital Marketing Analytics Presentation Template for PowerPoint & Google Slides
Digital Marketing
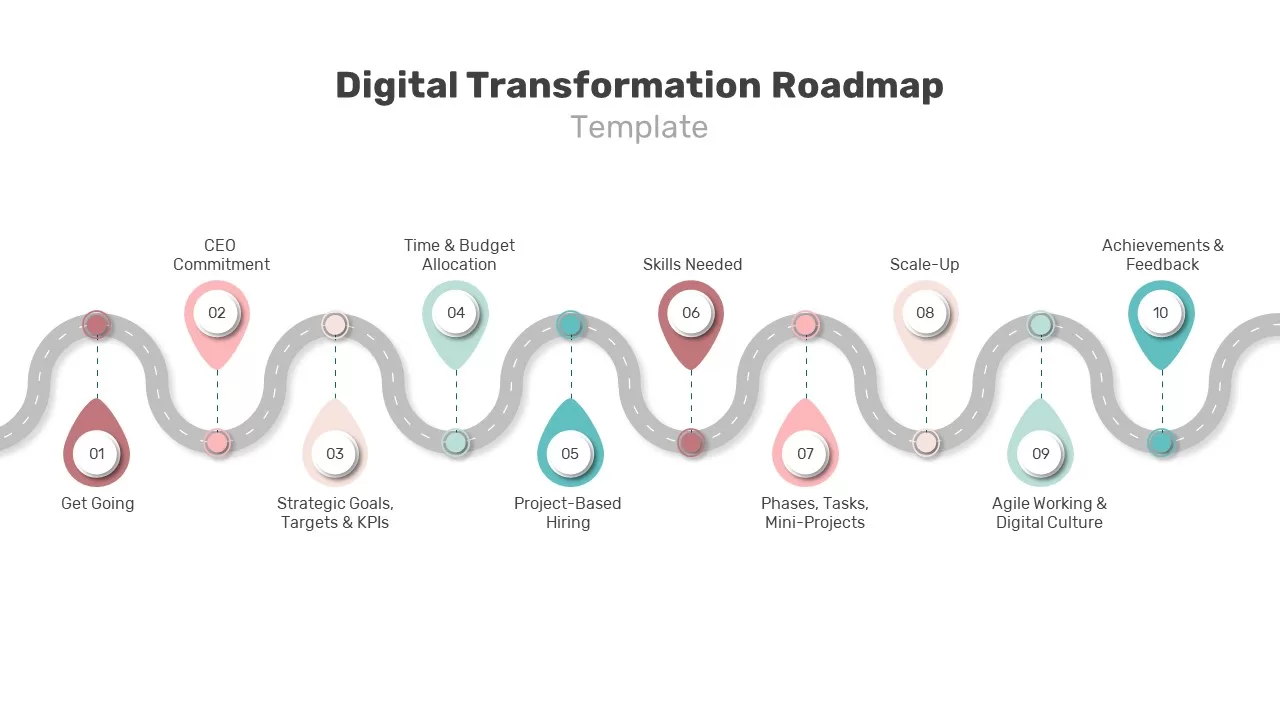
Digital Transformation Roadmap Slide Template for PowerPoint & Google Slides
Roadmap
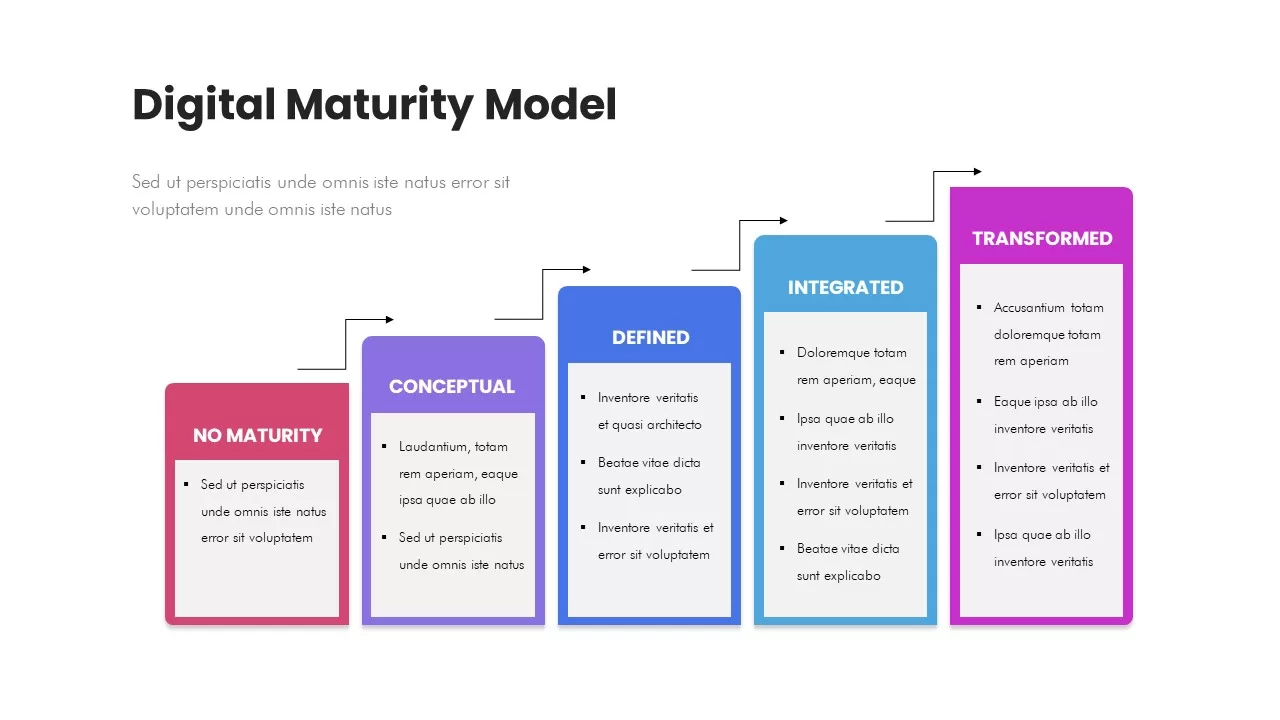
Digital Maturity Model Stages Diagram Template for PowerPoint & Google Slides
Process
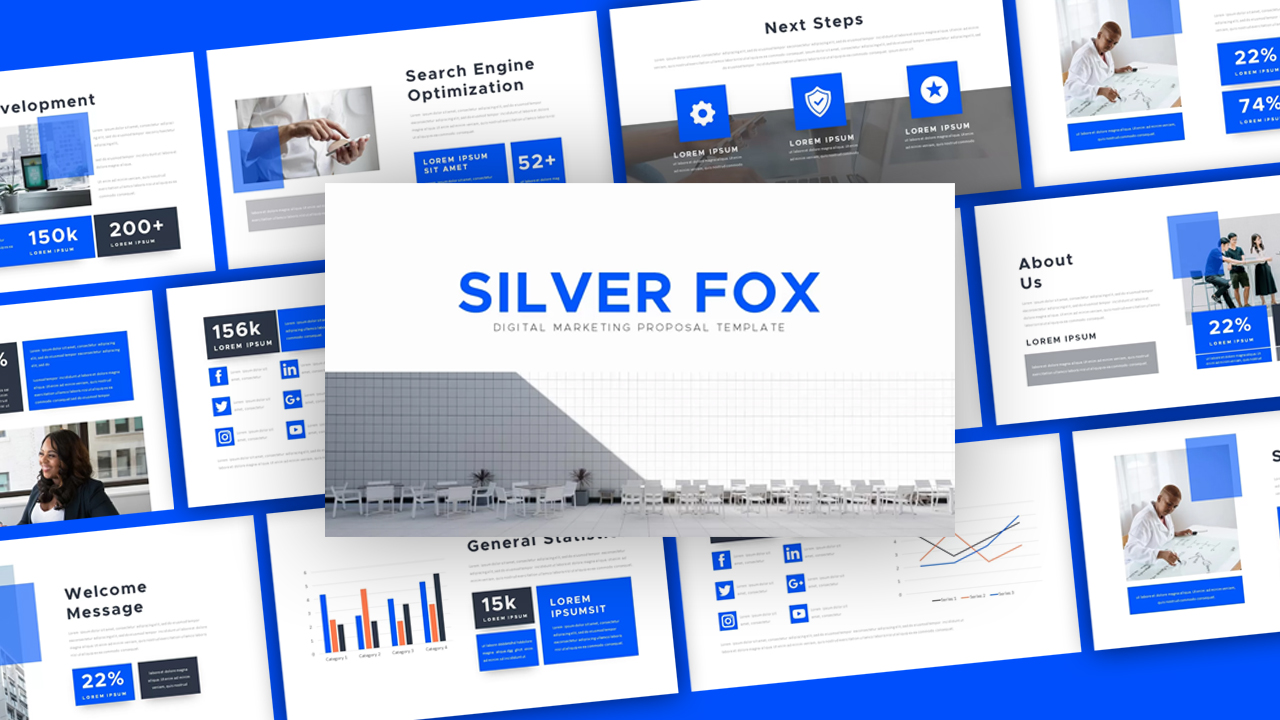
Silver Fox Digital Marketing Proposal template for PowerPoint & Google Slides
Company Profile
Five-Stage Digital Maturity Model Diagram Template for PowerPoint & Google Slides
Process
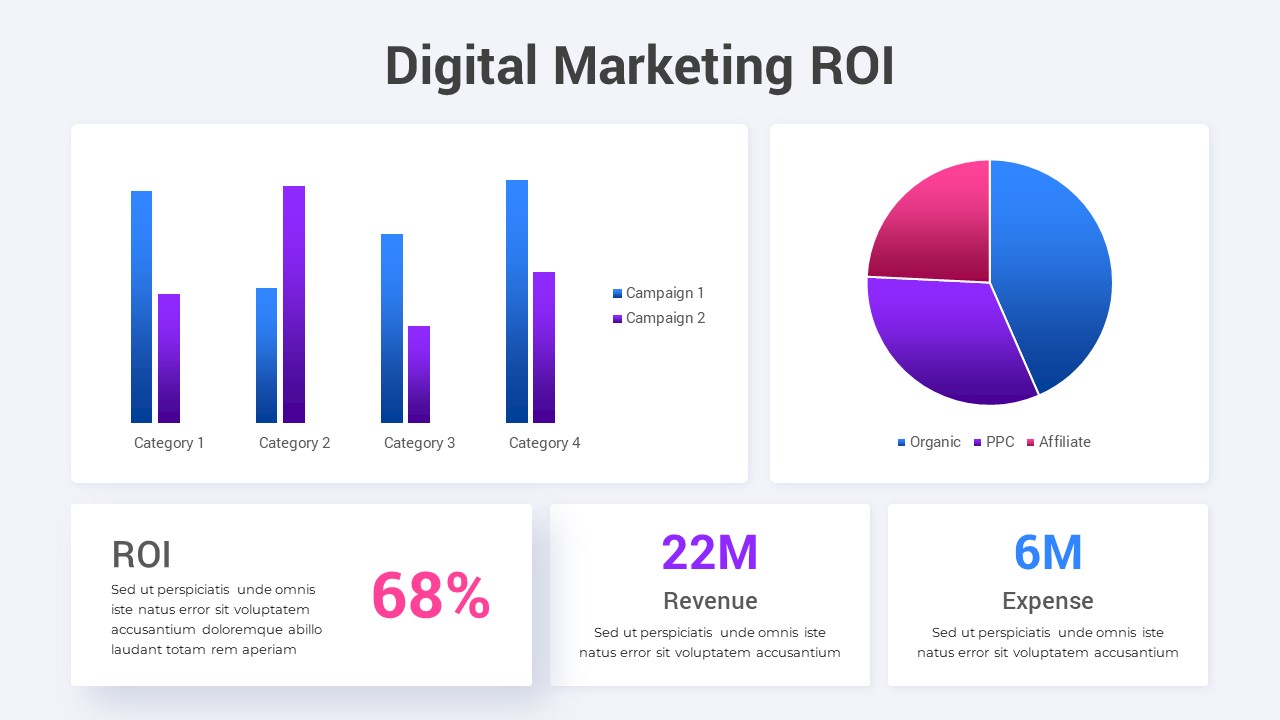
Digital Marketing ROI Analysis template for PowerPoint & Google Slides
Digital Marketing
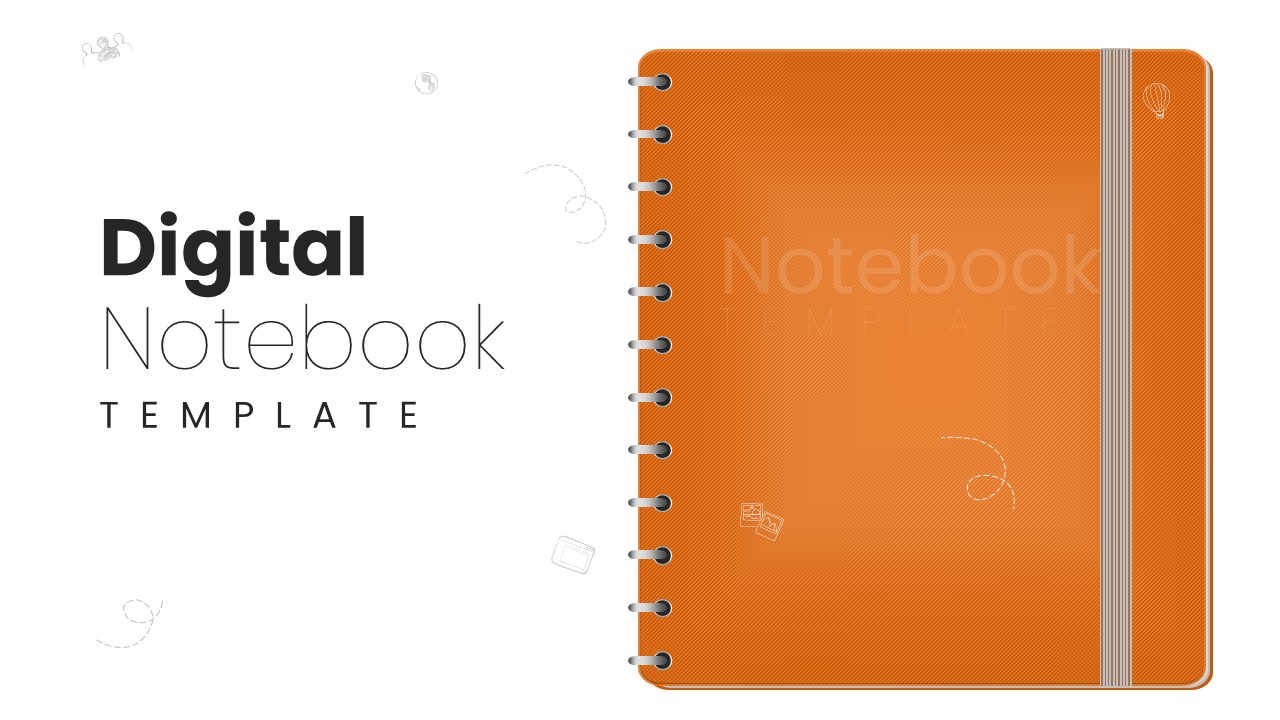
Digital Notebook Presentation Deck Template for PowerPoint & Google Slides
Decks

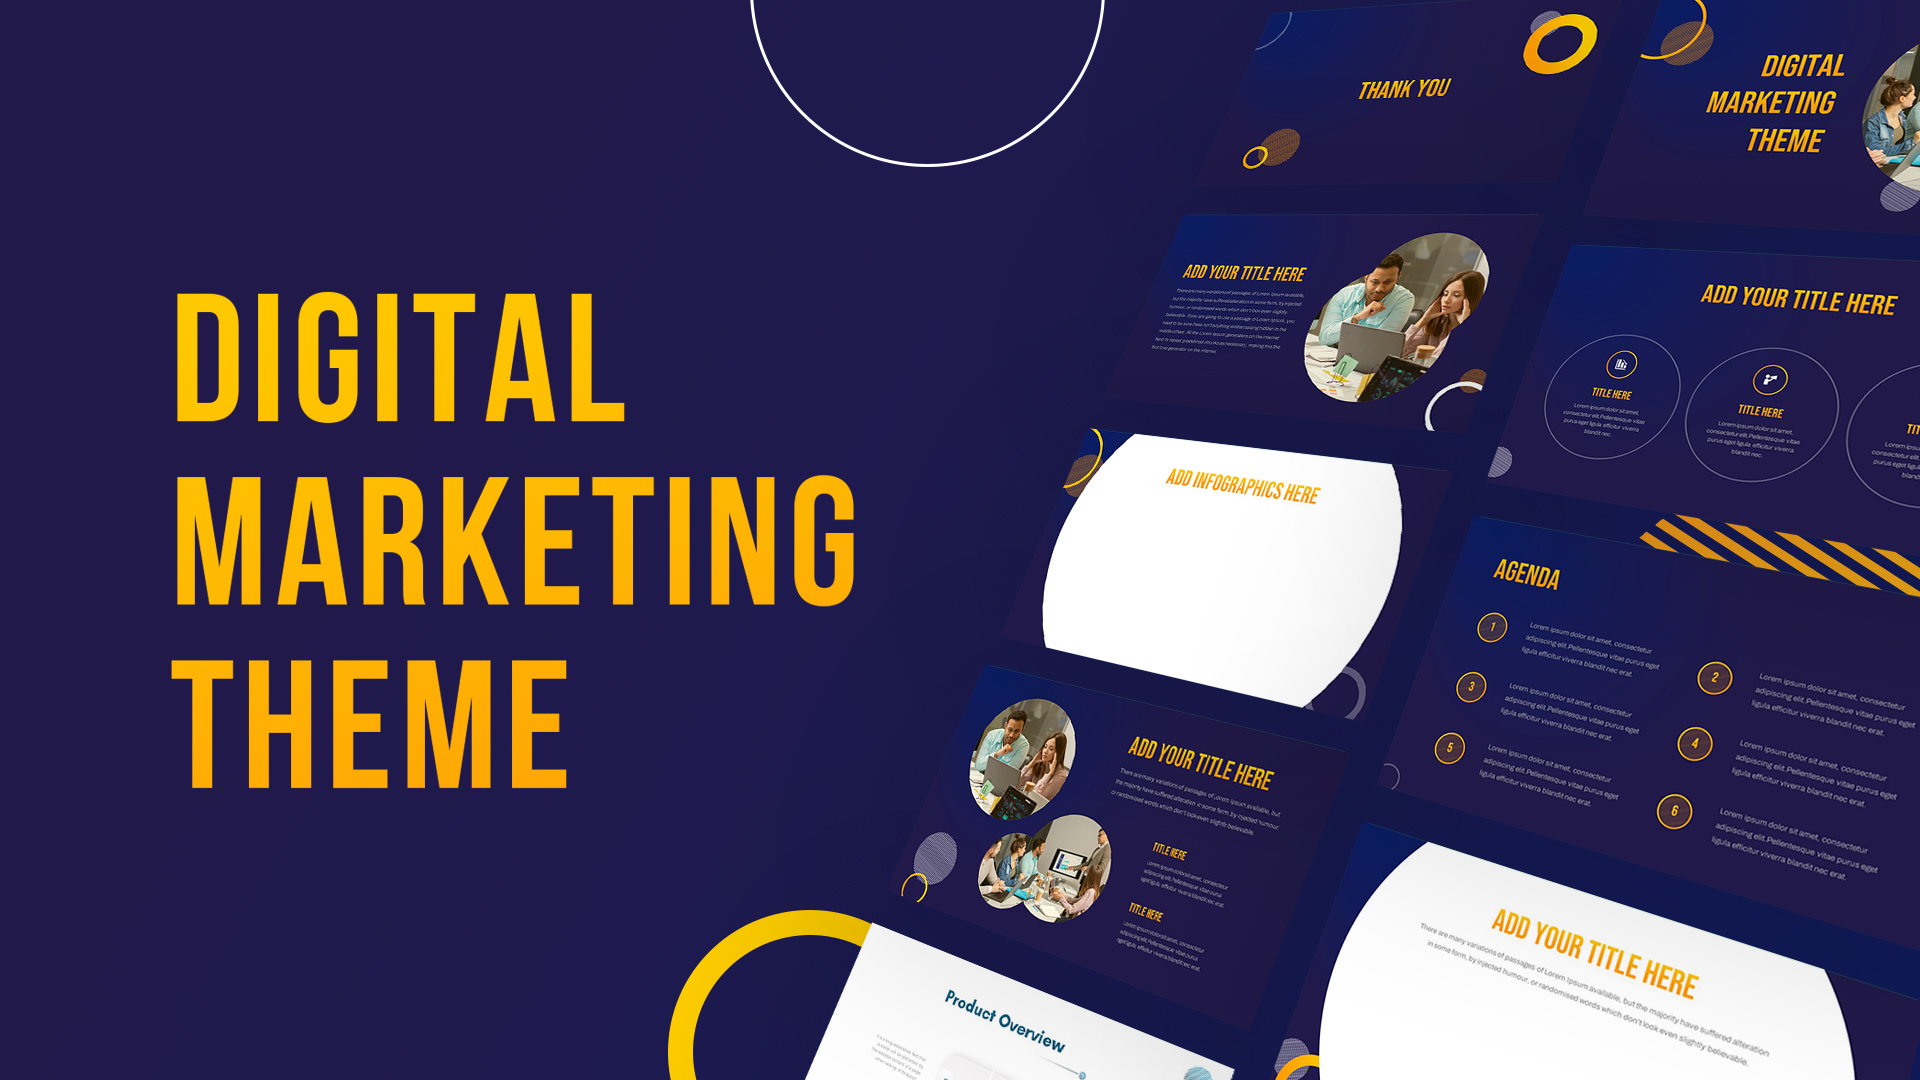
Modern Dark Digital Marketing Theme Template for PowerPoint & Google Slides
Digital Marketing
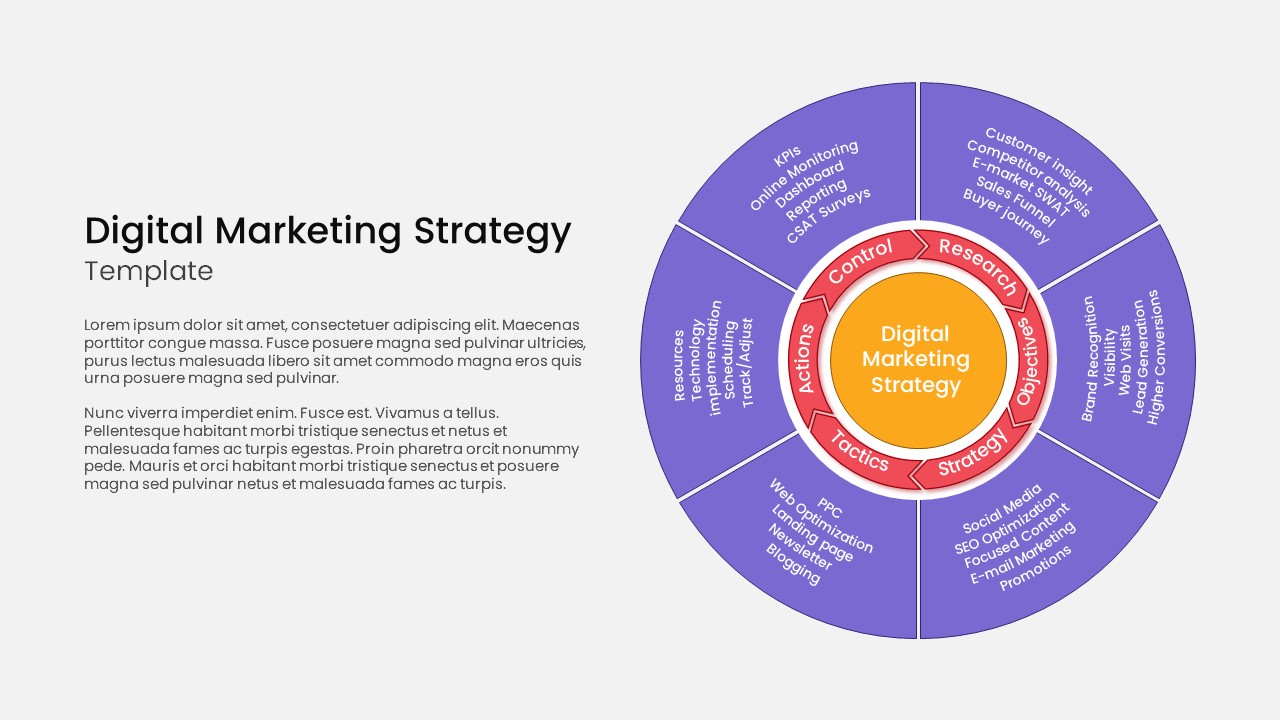
Circular Hub Digital Marketing Strategy Template for PowerPoint & Google Slides
Digital Marketing
Modern Digital Agency Presentation Template for PowerPoint & Google Slides
Digital Marketing
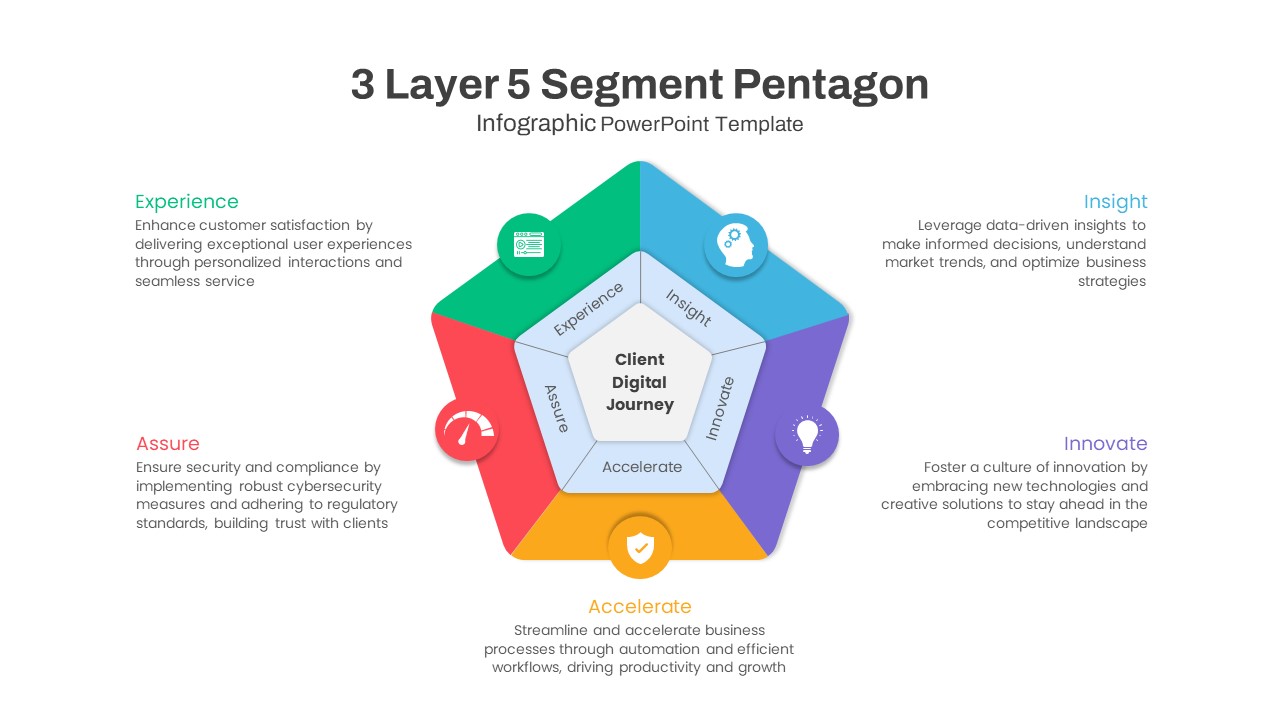
Five-Segment Pentagon Digital Journey Template for PowerPoint & Google Slides
Process
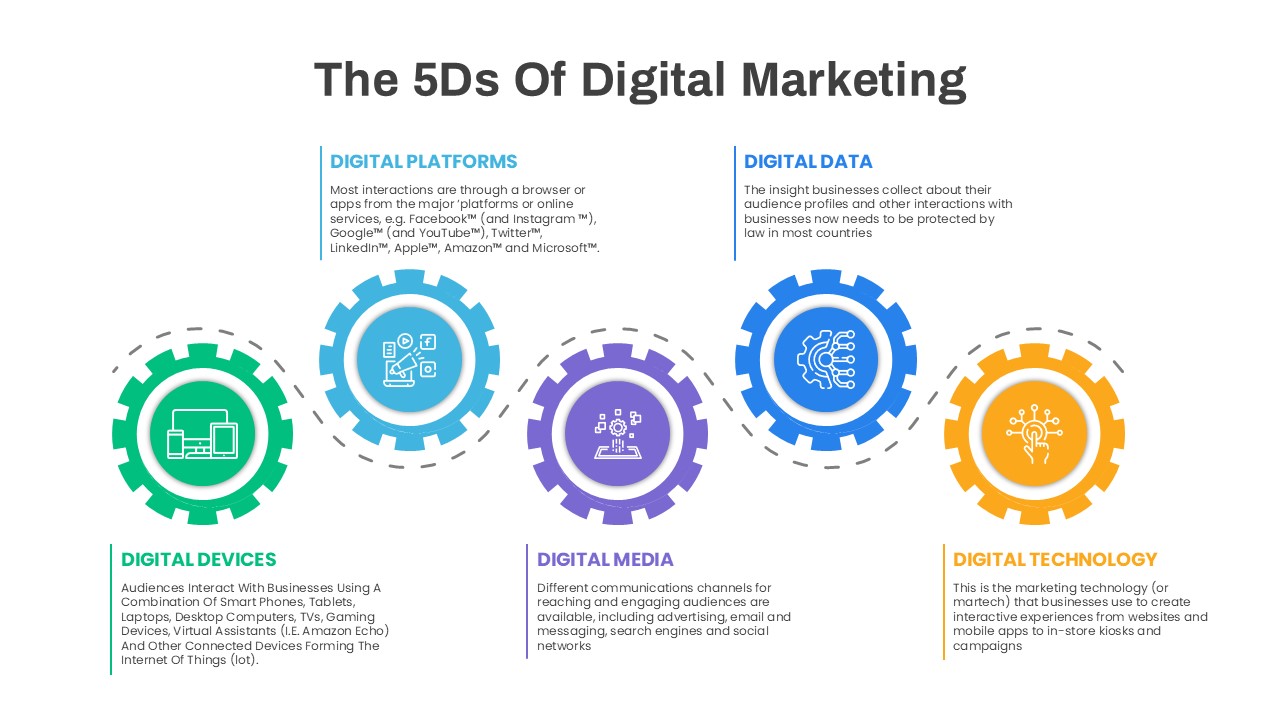
5D Digital Marketing Flow Diagram Template for PowerPoint & Google Slides
Digital Marketing
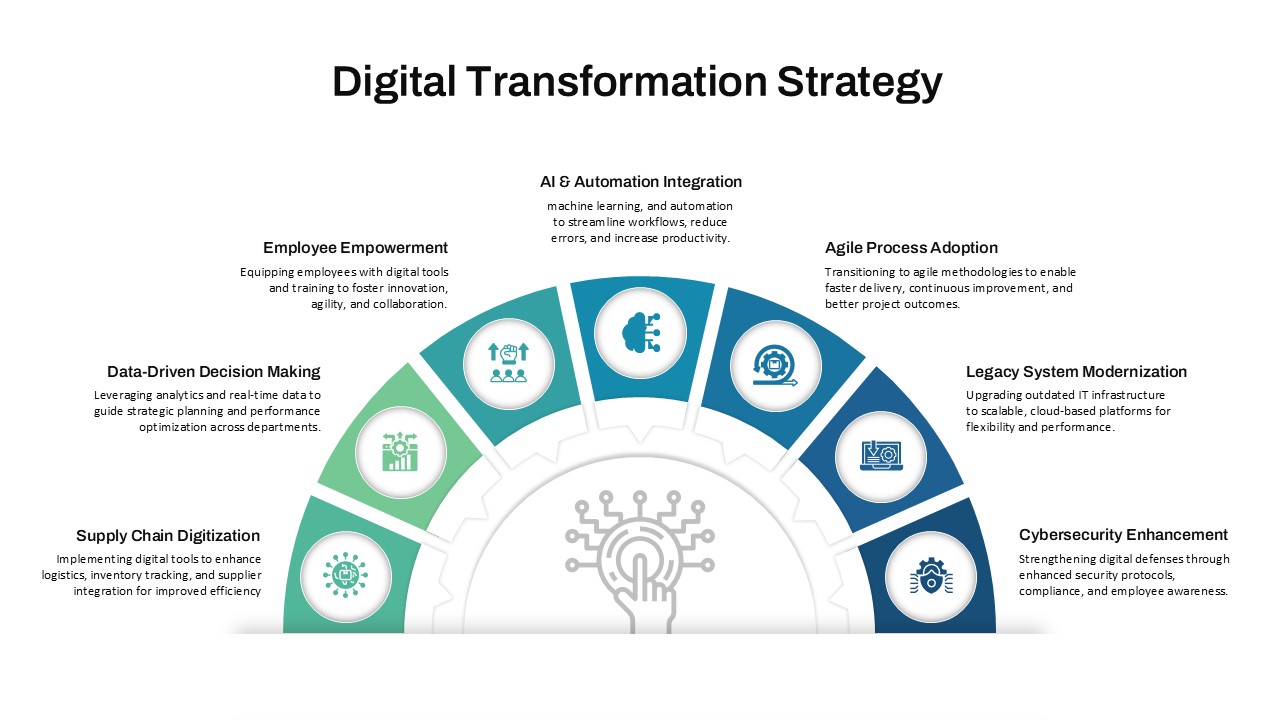
Digital Transformation Strategy Template for PowerPoint & Google Slides
Circular
Digital Marketing KPIs Dashboard Dark Template for PowerPoint & Google Slides
Business Report
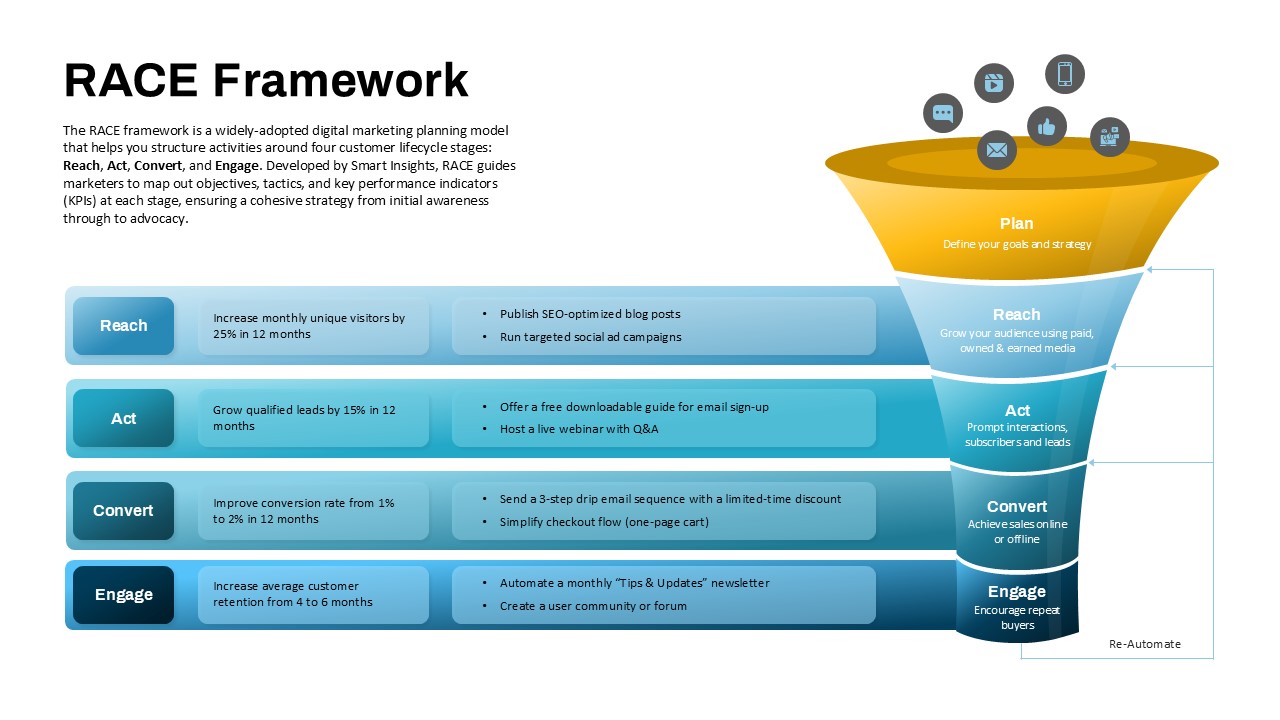
RACE Framework for Digital Marketing Strategy template for PowerPoint & Google Slides
Funnel
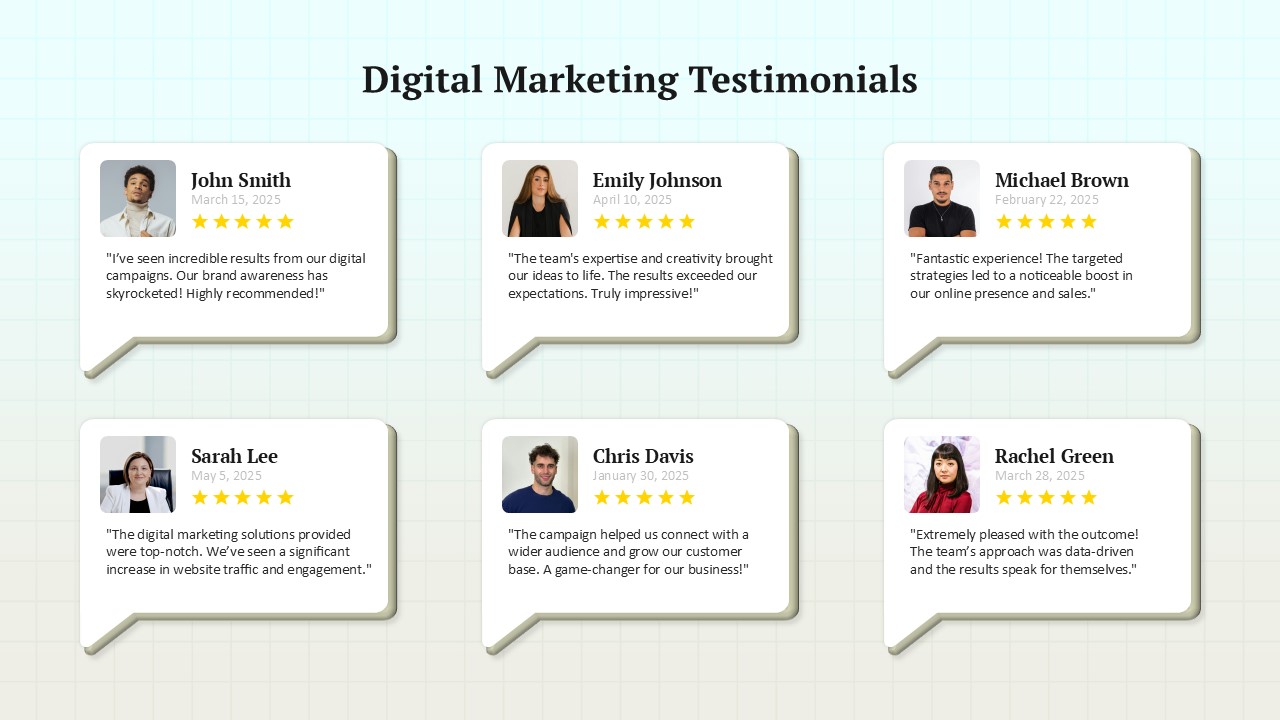
Digital Marketing Client Testimonials Template for PowerPoint & Google Slides
Accomplishment
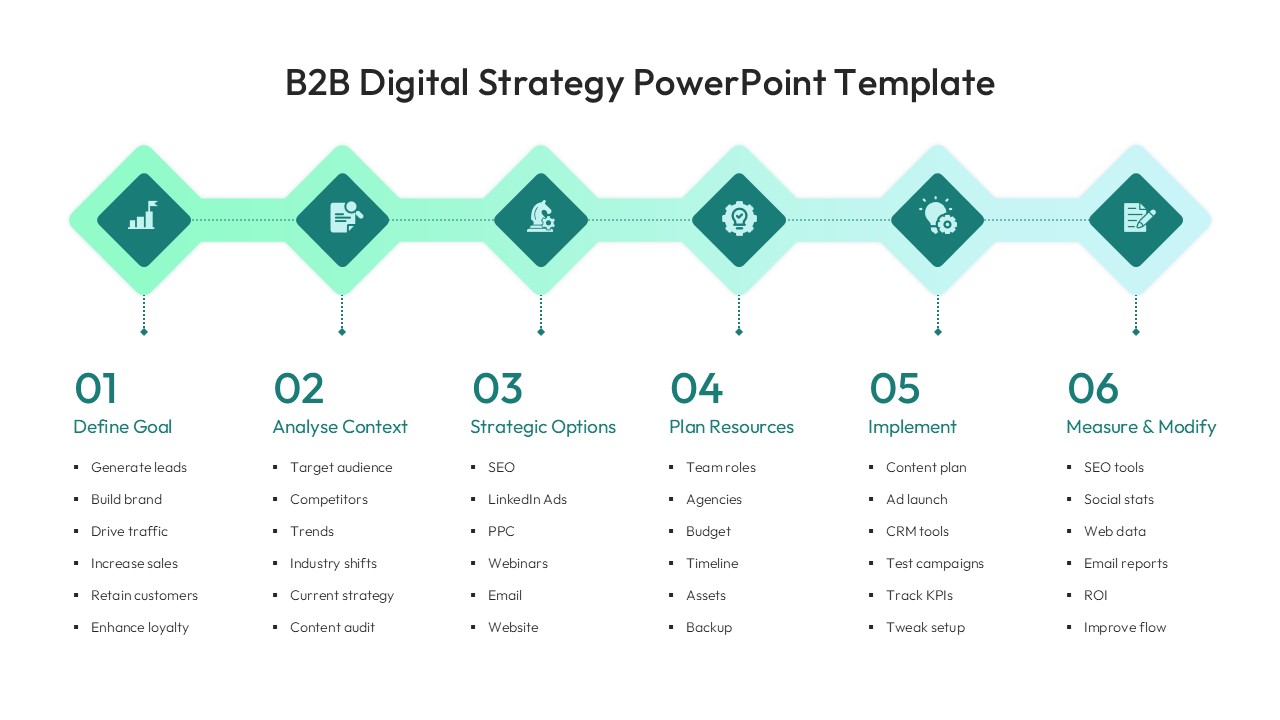
Elegant B2B Digital Strategy Timeline Template for PowerPoint & Google Slides
Digital Marketing
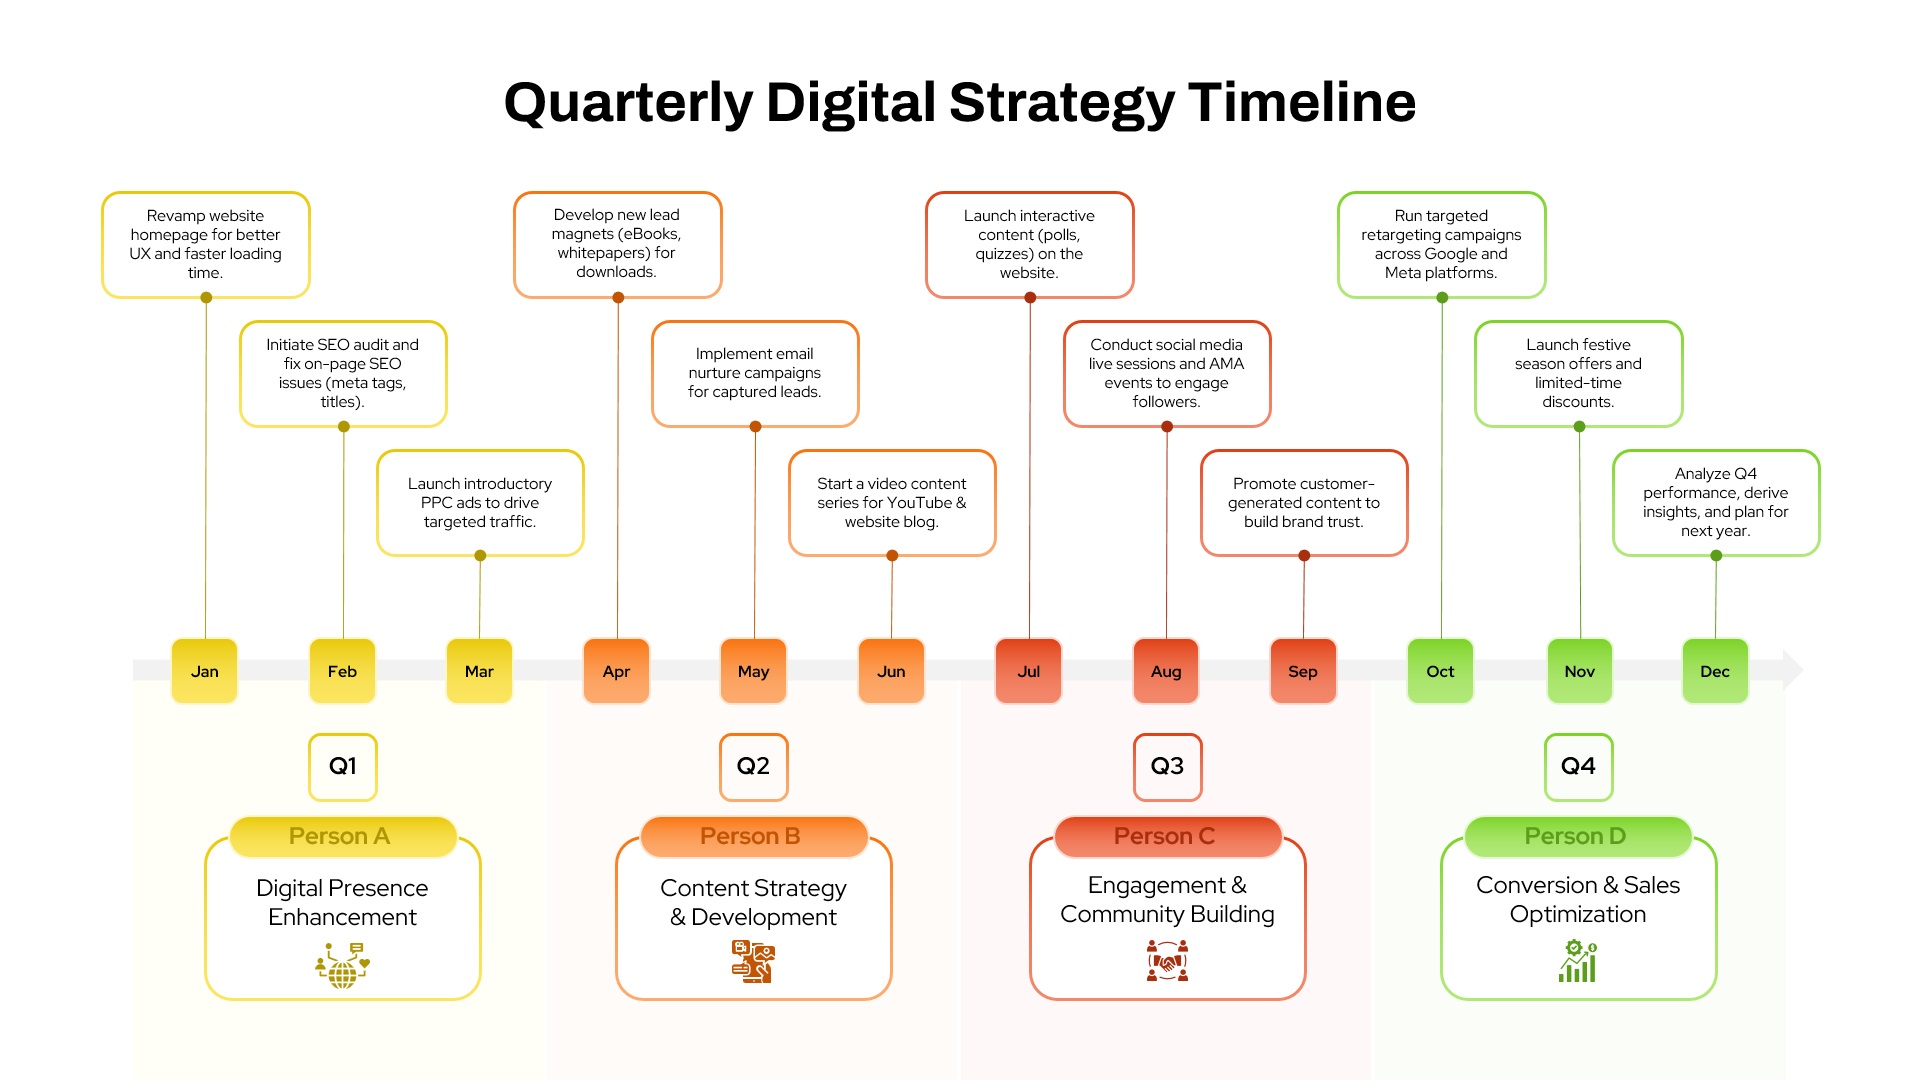
Quarterly Digital Strategy Timeline template for PowerPoint & Google Slides
Digital Marketing
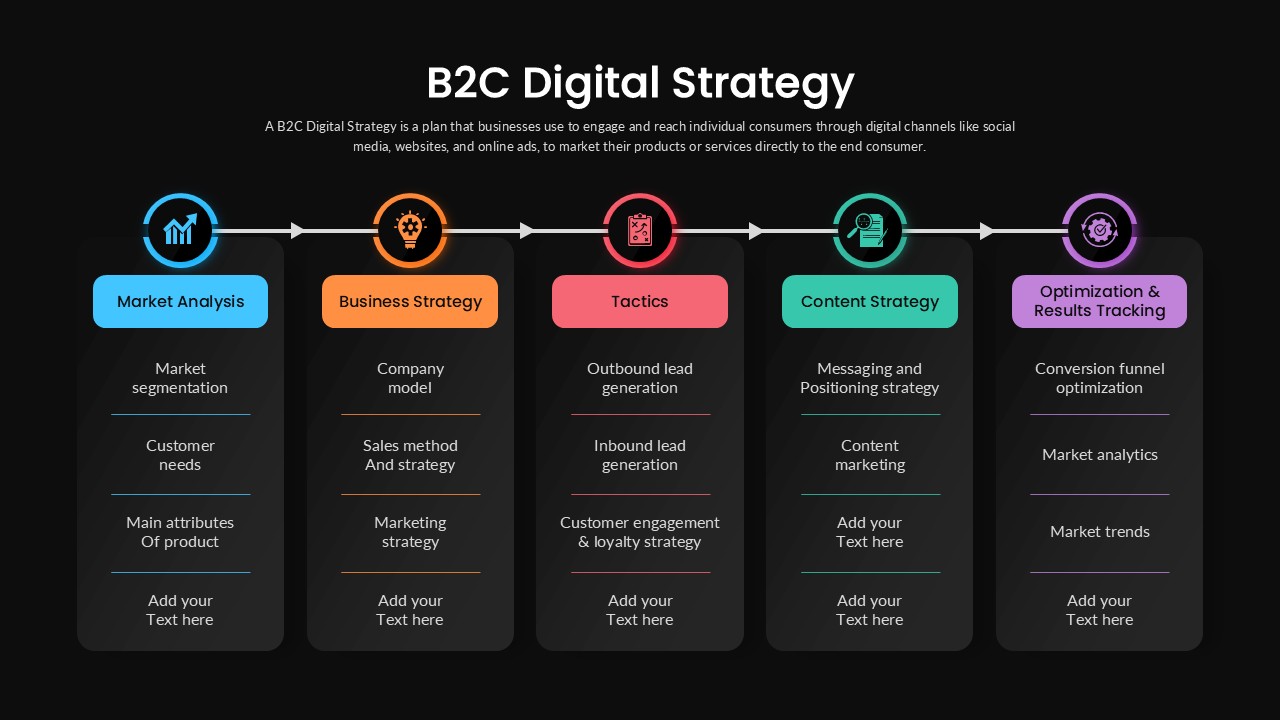
B2C Digital Strategy Five-Step Template for PowerPoint & Google Slides
Digital Marketing
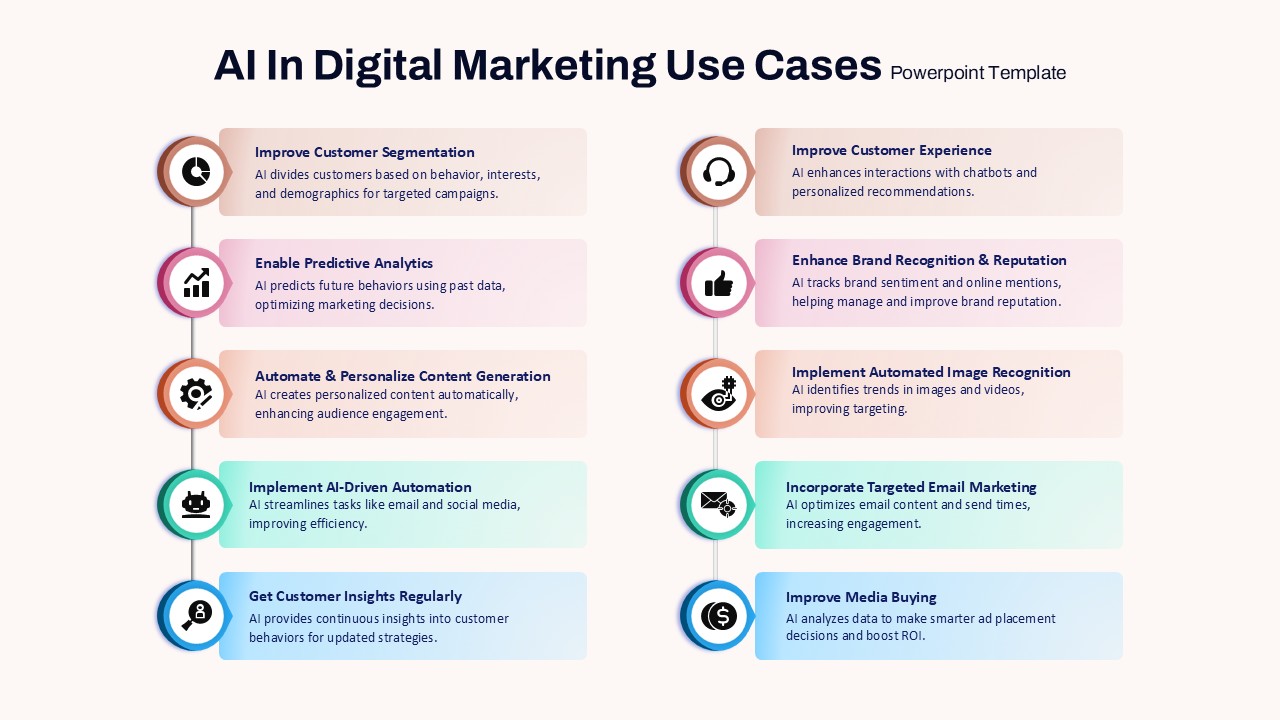
AI in Digital Marketing Use Cases Template for PowerPoint & Google Slides
AI
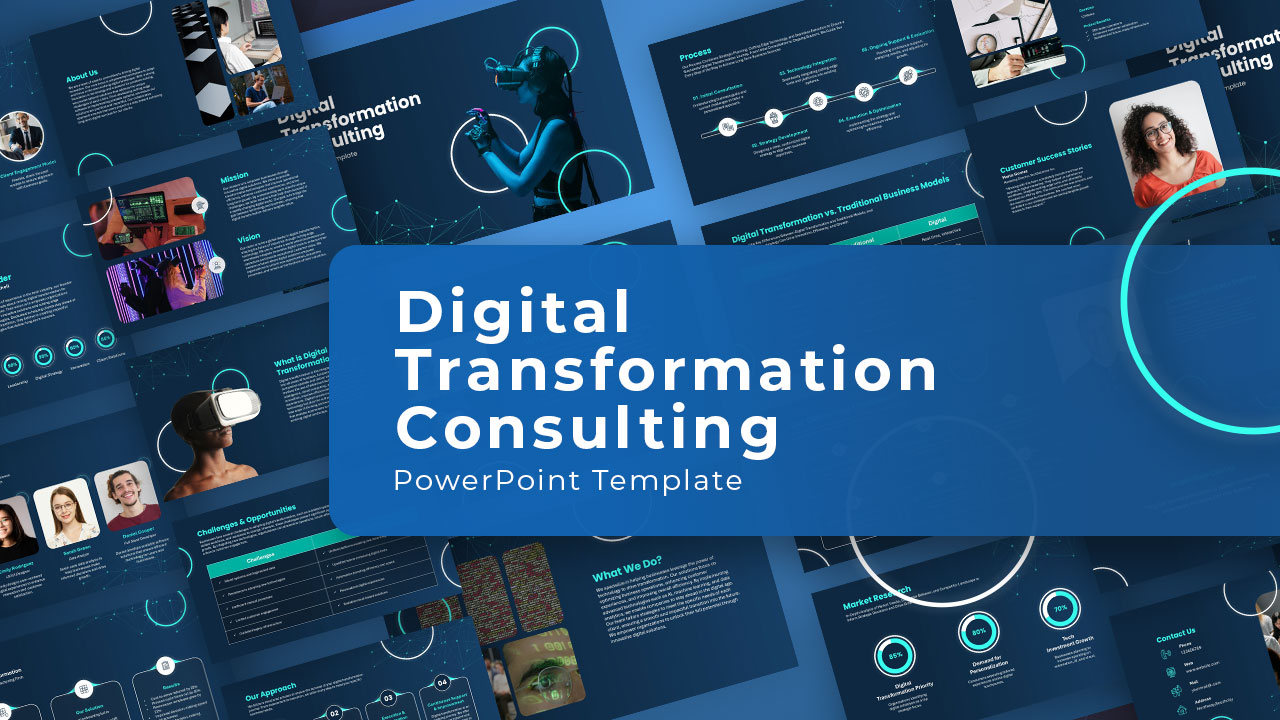
Digital Transformation Consulting Overview Template for PowerPoint & Google Slides
Information Technology
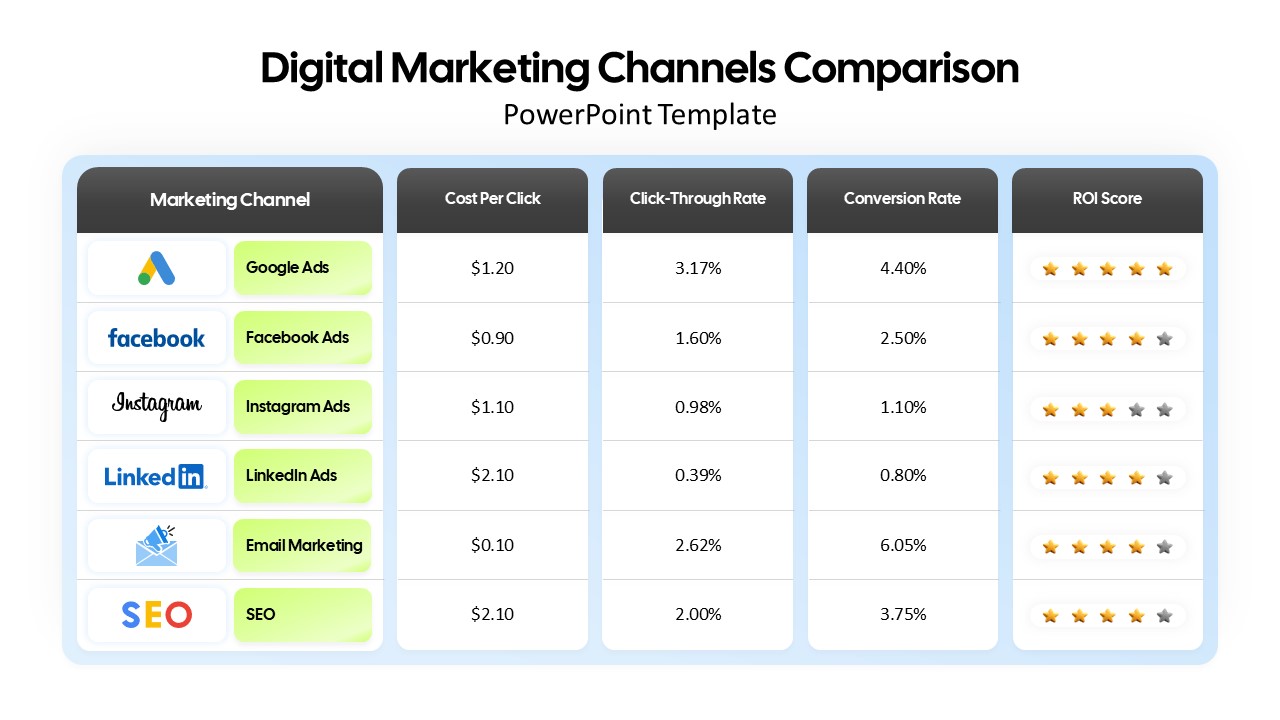
Digital Marketing Channels Comparison template for PowerPoint & Google Slides
Business
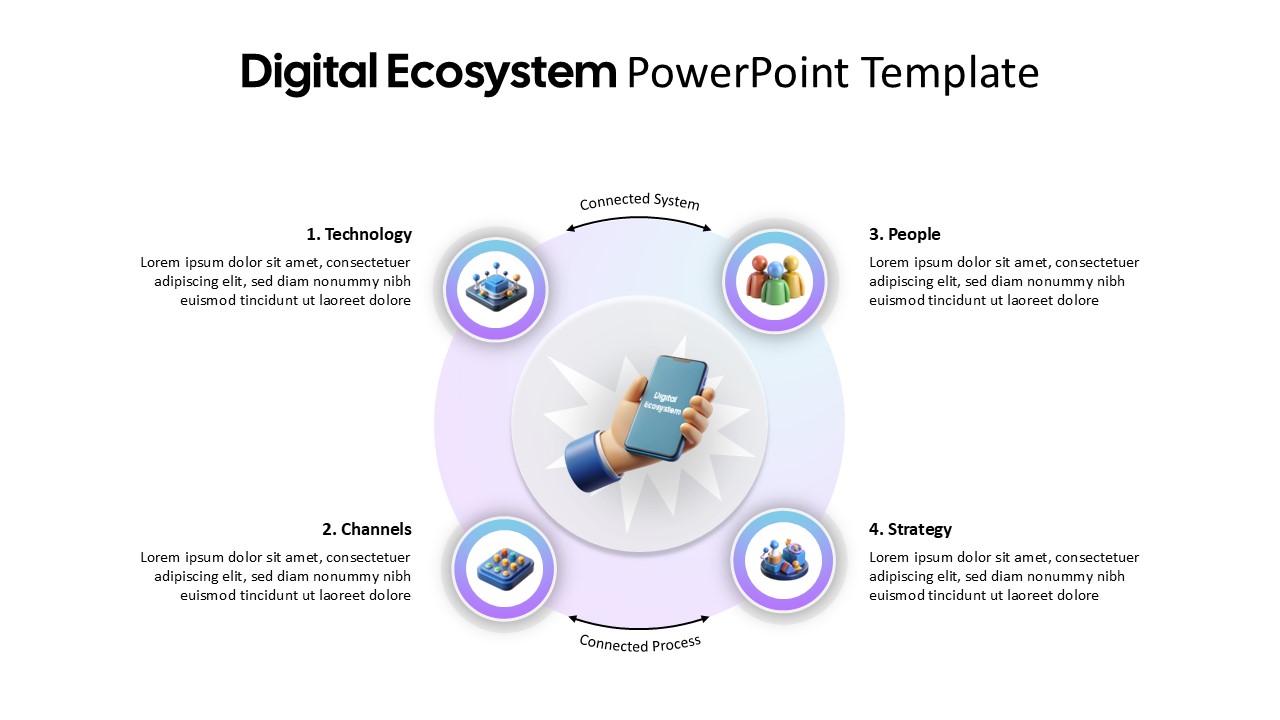
Digital Ecosystem Circular Model Template for PowerPoint & Google Slides
Information Technology
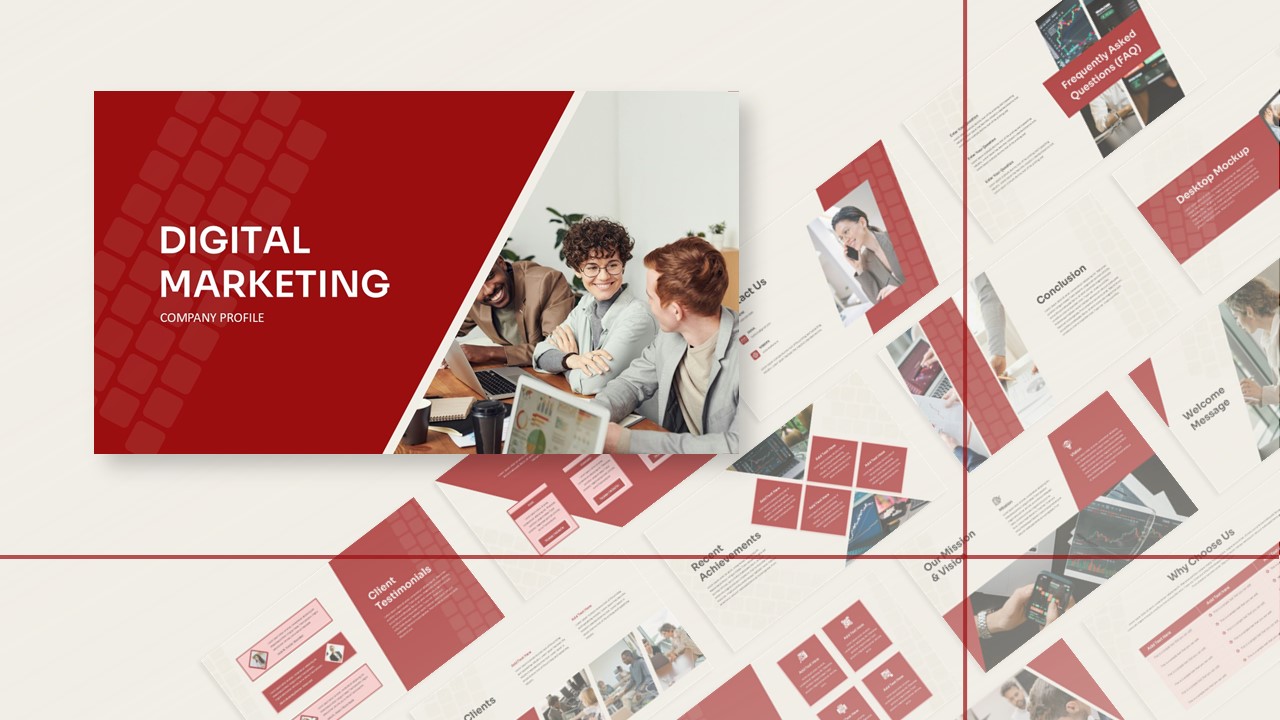
Digital Marketing Company Profile Template for PowerPoint & Google Slides
Digital Marketing
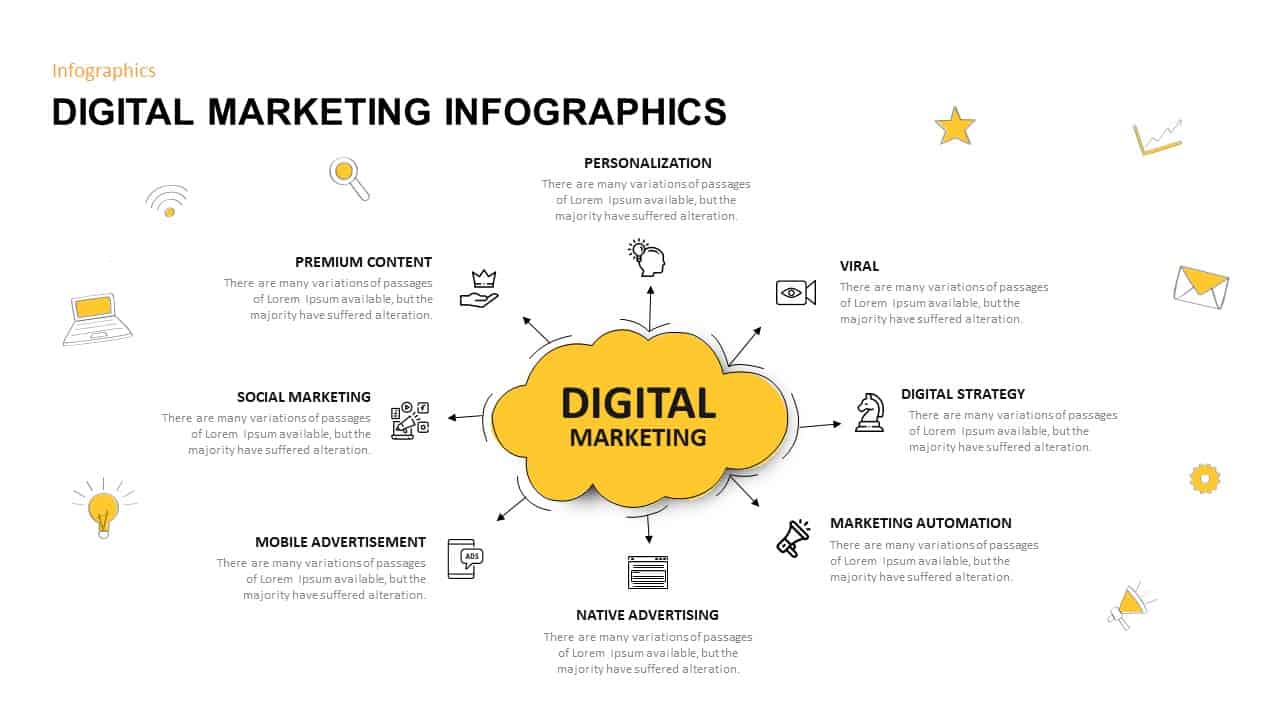
Digital Marketing Infographics Overview for PowerPoint & Google Slides
Digital Marketing
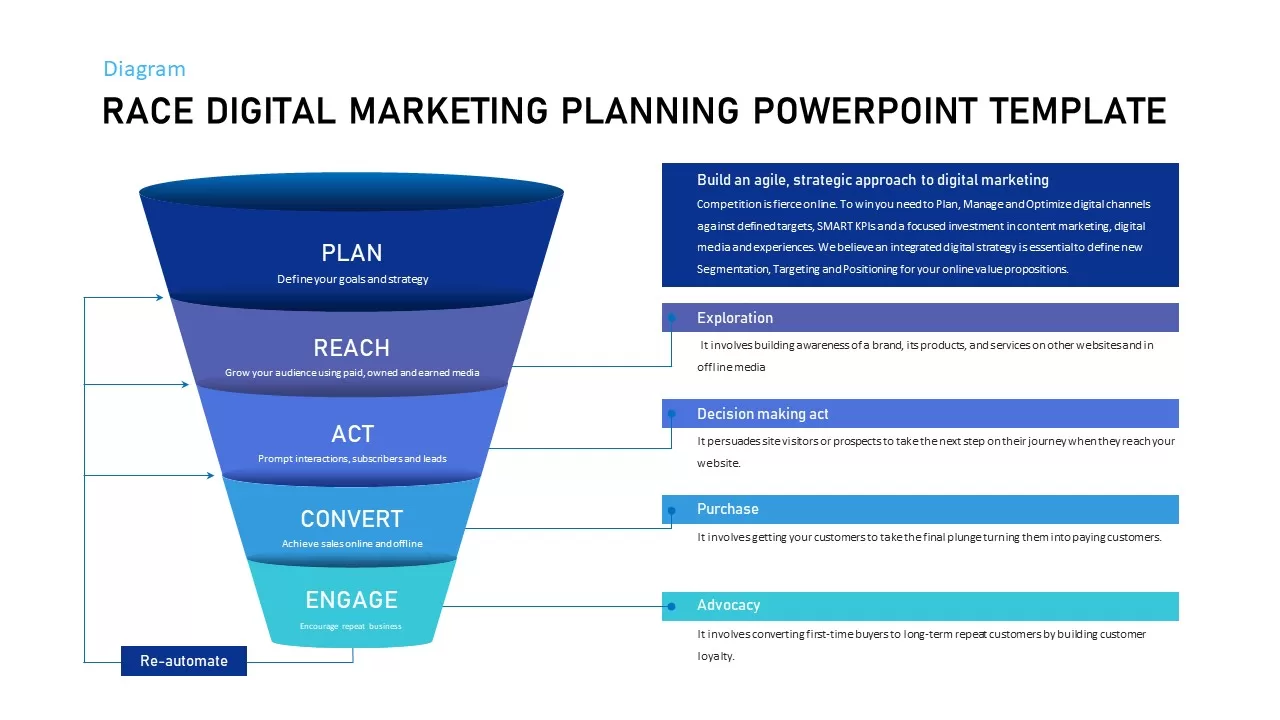
Race Digital Marketing Planning Templates for PowerPoint & Google Slides
Digital Marketing
Digital Marketing Presentation for PowerPoint & Google Slides
Digital Marketing
4 Step Process PowerPoint & Google Slides Template for PowerPoint & Google Slides
Process