Three Segment Donut Chart KPI Infographic

Description
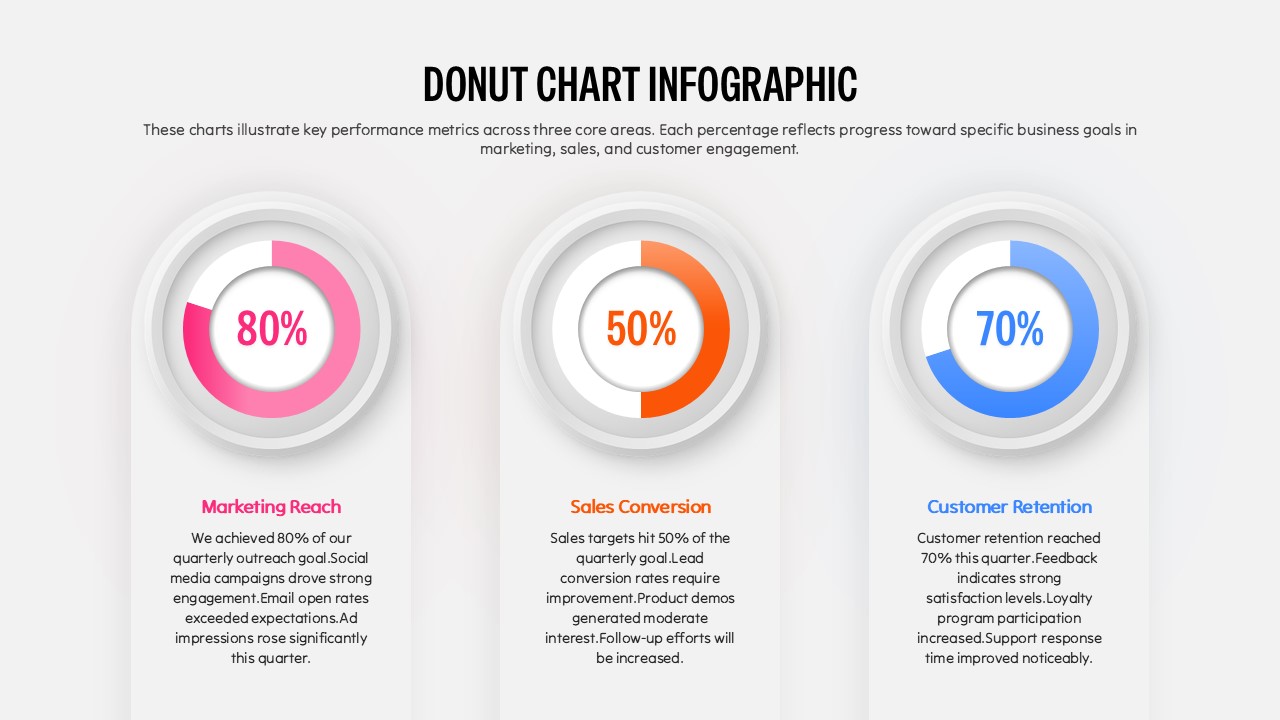
The Three Segment Donut Chart KPI Infographic Template for PowerPoint and Google Slides provides a visually engaging way to present performance metrics across key business areas. Featuring three circular donut charts with vibrant color coding—pink for Marketing Reach, orange for Sales Conversion, and blue for Customer Retention—this slide clearly communicates progress percentages and performance summaries in a clean, data-focused layout.
Each chart includes a central percentage label for instant readability and a supporting text section that elaborates on achievements, challenges, or strategic improvements. The minimalist white background enhances contrast, ensuring that the bright circular visuals stand out. This design makes the slide ideal for tracking quarterly goals, visualizing marketing performance, or showcasing business analytics in executive presentations.
Fully editable and designed for versatility, this template allows users to adjust colors, metrics, and text to match corporate branding or new KPI targets. Whether used for dashboards, reports, or client updates, this slide helps teams summarize insights effectively and maintain data transparency with impact.
Who is it for
Perfect for marketing analysts, sales managers, business consultants, and project leaders who need to present performance indicators, progress reports, or goal achievements in a clear and modern format.
Other Uses
Beyond KPI presentations, this donut chart layout can be adapted for financial summaries, operational metrics, academic performance tracking, or employee engagement reports. It’s also ideal for startup pitch decks and annual business reviews.
Login to download this file


