McGregor’s Theory X vs Theory Y Template for PowerPoint & Google Slides

Description
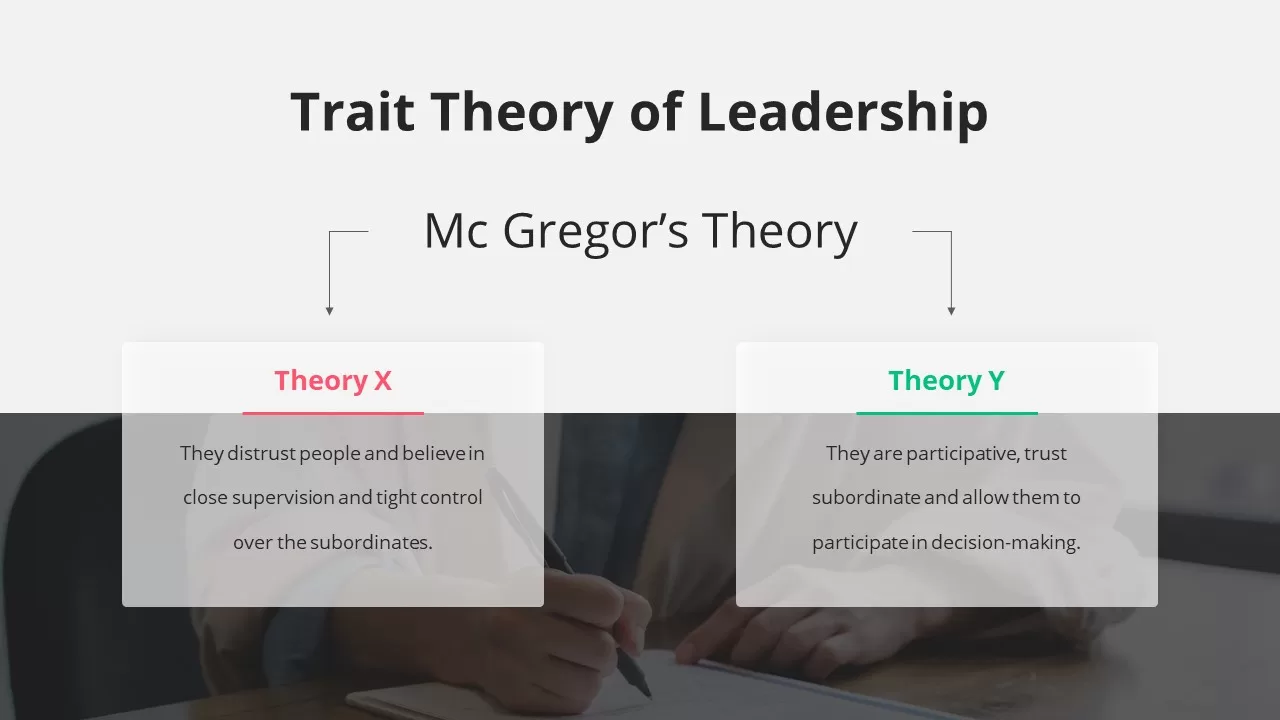
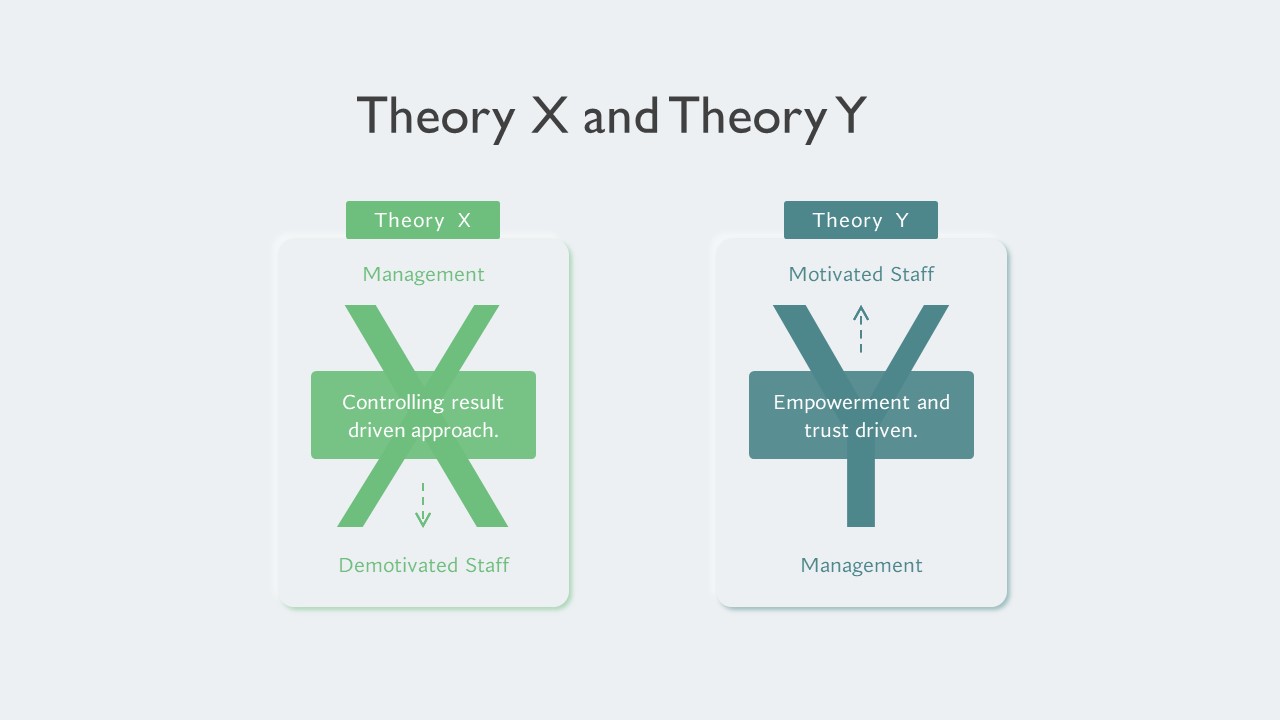
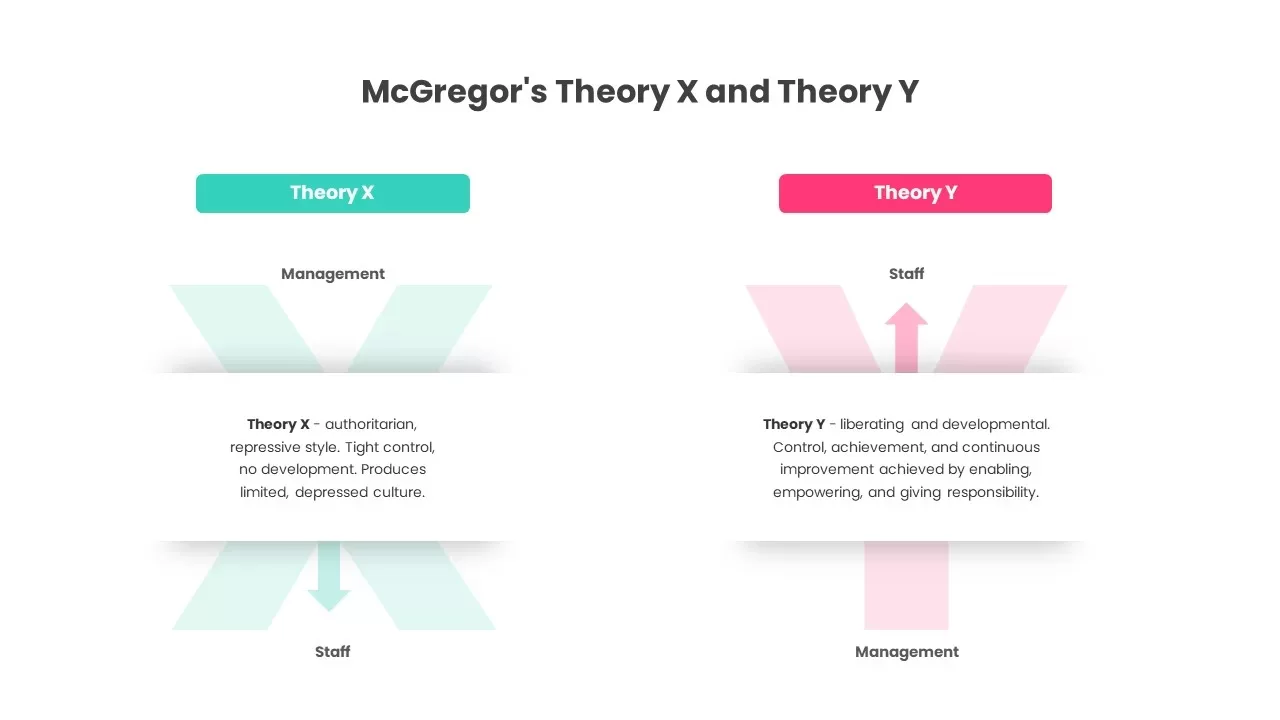
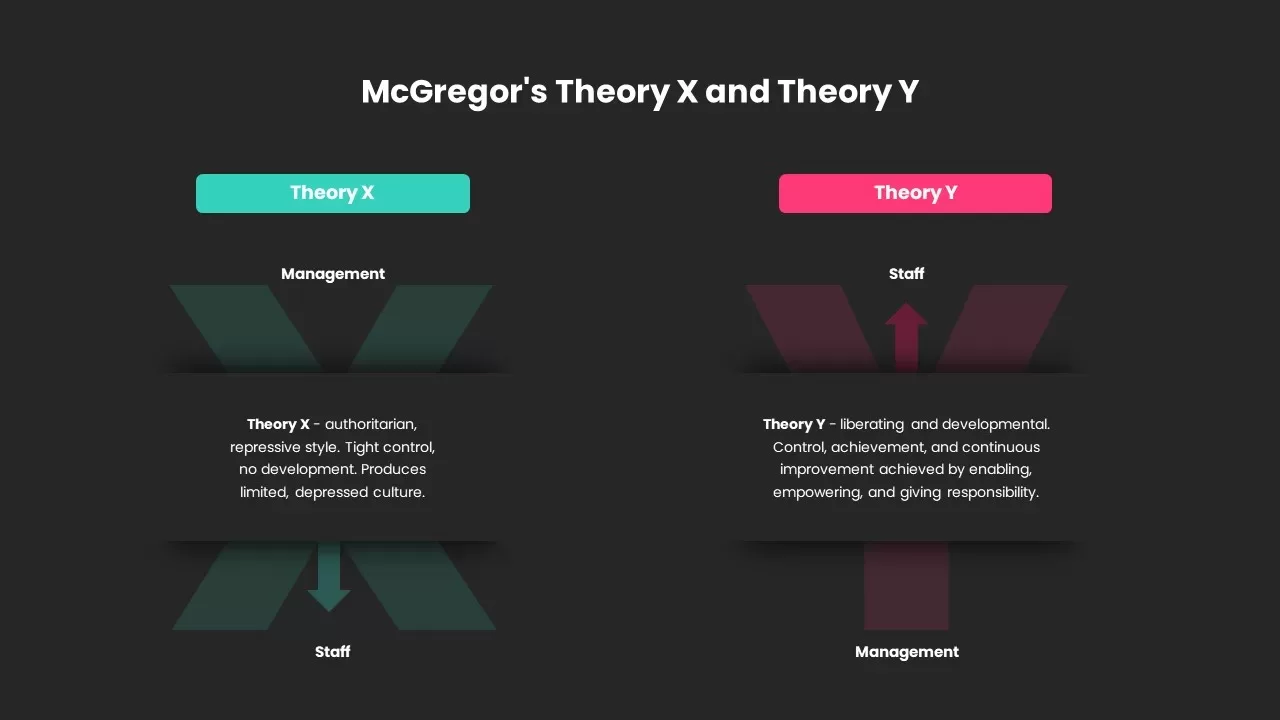
This McGregor’s Theory X vs Theory Y Comparison Diagram slide delivers a clear, side-by-side visual of the two contrasting management philosophies. A cyan header bar labels Theory X on the left, while a magenta bar denotes Theory Y on the right. Beneath each header, a large gradient “X” or “Y” shape anchors the concept, with a downward arrow under Theory X illustrating top-down, authoritarian control and an upward arrow under Theory Y depicting empowering, developmental influence from staff to management. Central white text panels with subtle drop shadows house concise definitions—Theory X’s repressive style versus Theory Y’s liberating approach—ensuring audiences grasp the core distinctions instantly.
Built on master slides, this template uses fully editable vector shapes, smart alignment guides, and grouped elements so you can swap colors, adjust gradients, and update text without disrupting the layout. Drag-and-drop placeholders let you replace headers or extend descriptions, while optional fade-in animations reveal each theory sequentially to maintain engagement. Designed for both widescreen and standard formats, the slide preserves crisp detail on large displays and printouts, and its minimalist typography guarantees readability across all environments.
Whether you’re teaching organizational behavior, conducting leadership workshops, or advising senior executives, this diagram streamlines storytelling by visually mapping management assumptions. Its balanced composition and editable framework accelerate slide creation, safeguard design consistency, and elevate the professionalism of any presentation.
Who is it for
HR professionals, business school instructors, and organizational development consultants will benefit from this diagram when illustrating McGregor’s motivational theories. Corporate trainers and leadership coaches can leverage the contrasting arrows and color cues to facilitate interactive discussions on workplace culture and management style.
Other Uses
Beyond Theory X and Y, repurpose the layout for any two-factor comparison—such as risk vs. reward or input vs. output analyses—by relabeling headers and adjusting arrows. The editable gradients and text boxes also suit SWOT quadrants, customer satisfaction vs. loyalty mapping, or decision-making flowcharts.
Login to download this file

Item ID
SB02975
Related Templates

Theory X and Theory Y Comparison Template for PowerPoint & Google Slides
Comparison
McGregor’s Theory X and Theory Y infographic Template for PowerPoint & Google Slides
Business Strategy
Motivational Theory Presentation Template for PowerPoint & Google Slides
Decks

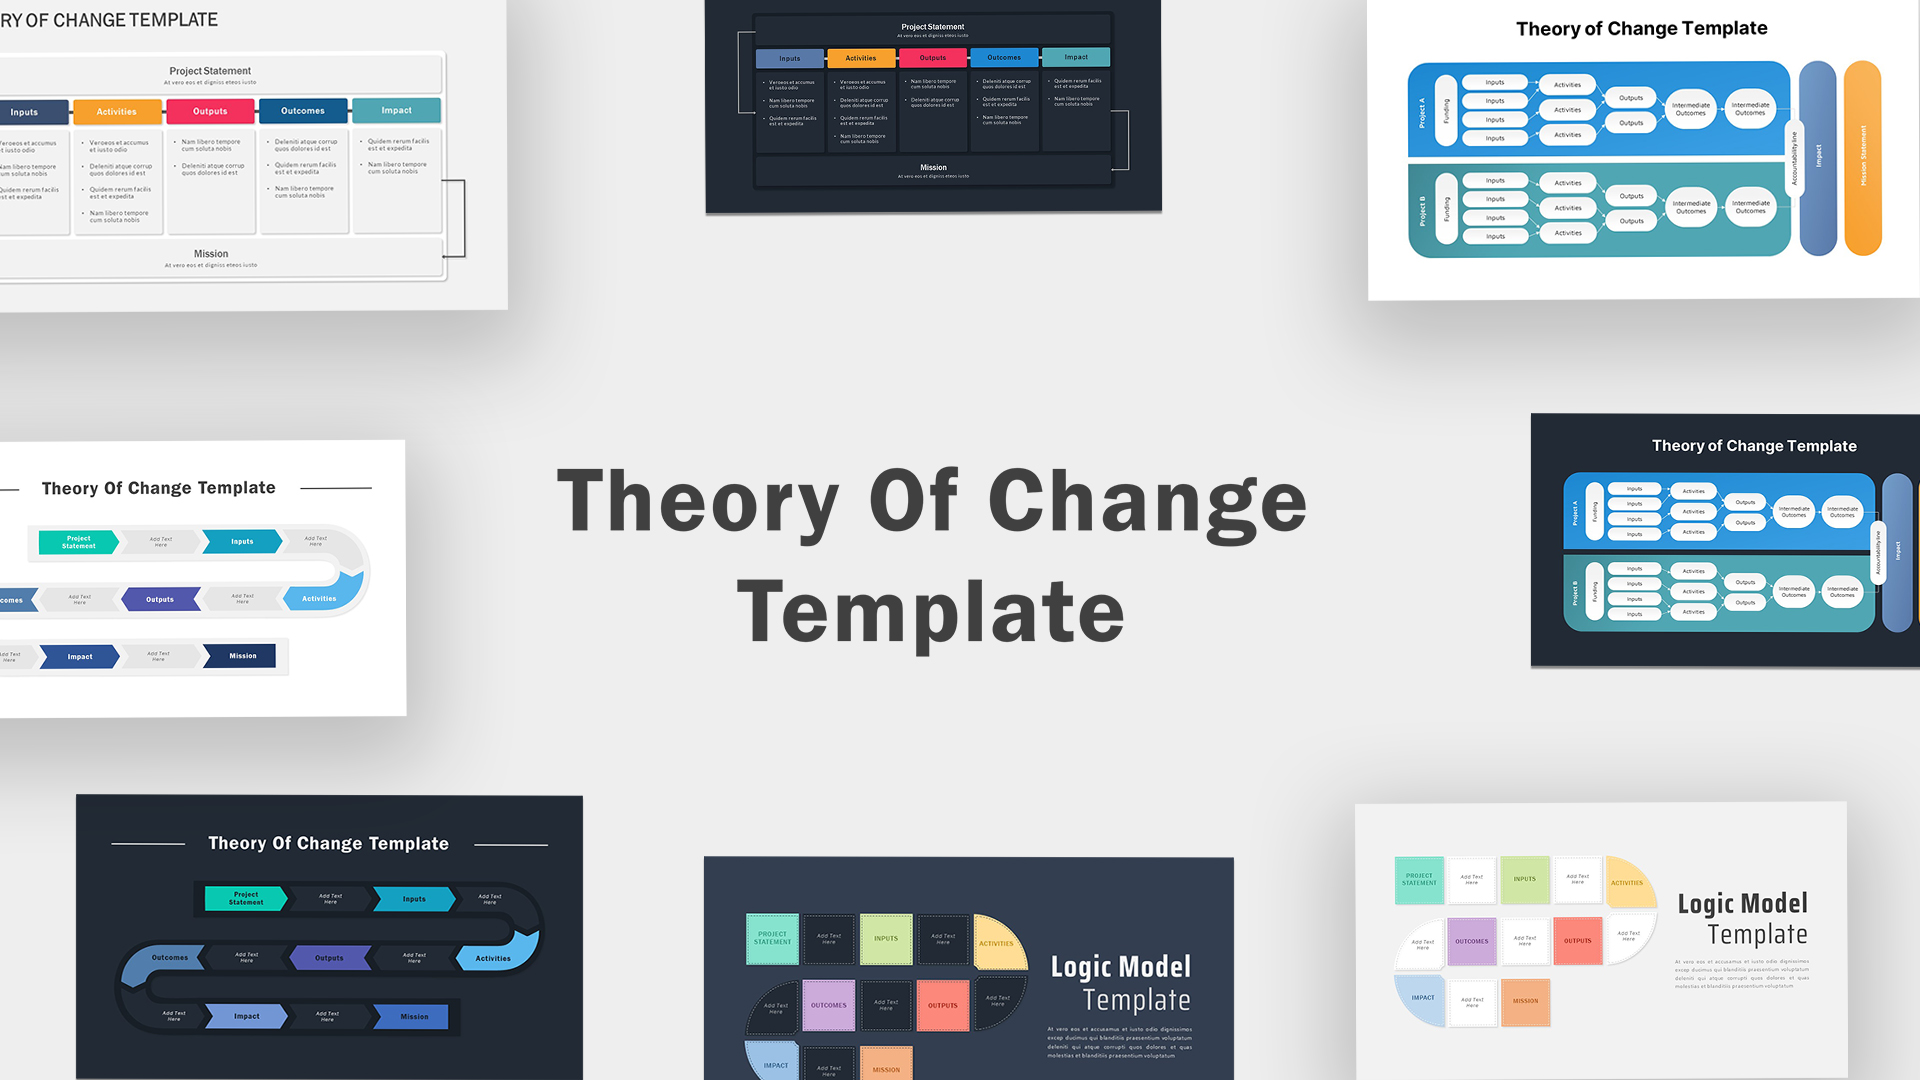
Theory of Change Infographics Pack Template for PowerPoint & Google Slides
Process
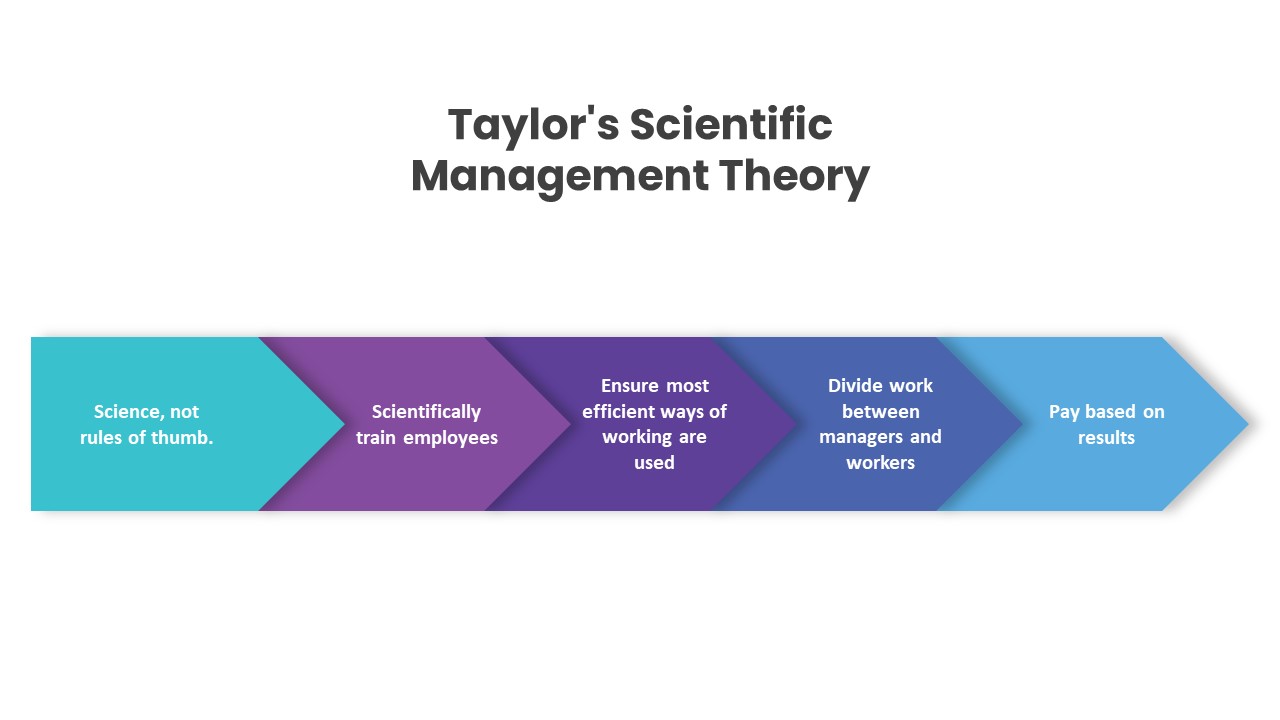
Taylor’s Scientific Management Theory Template for PowerPoint & Google Slides
Process
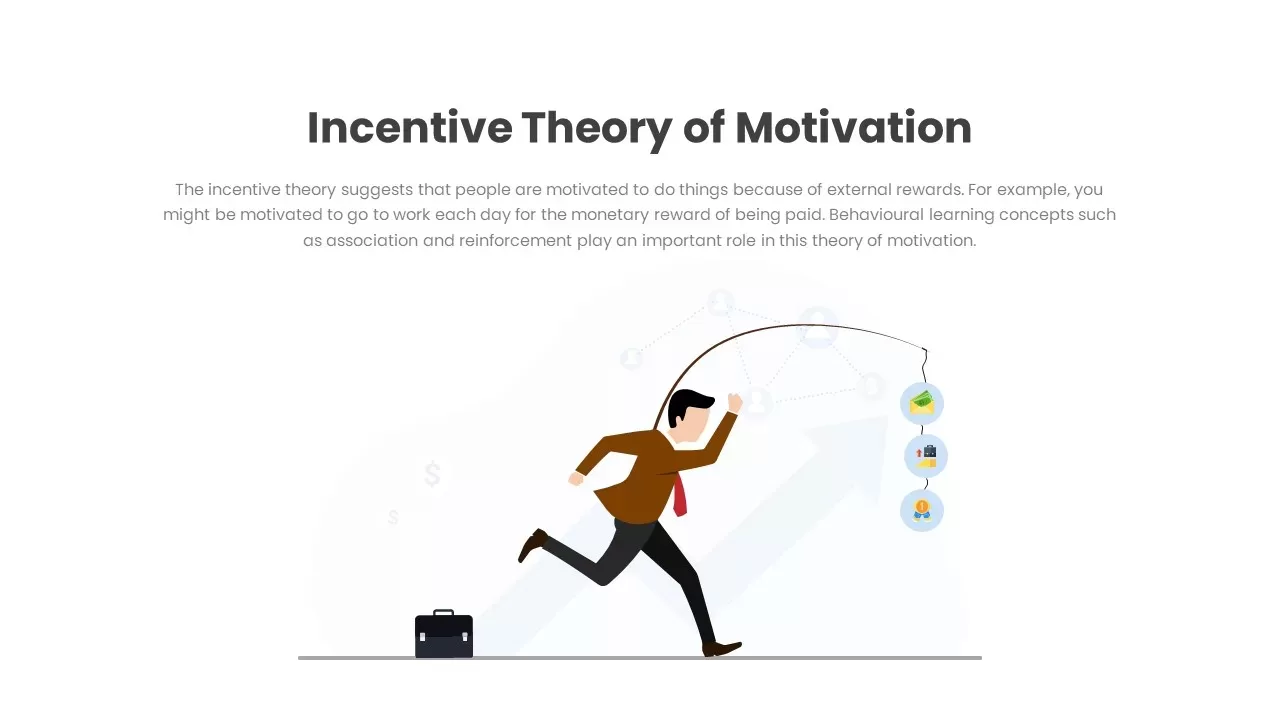
Incentive Theory of Motivation Diagram Template for PowerPoint & Google Slides
Employee Performance
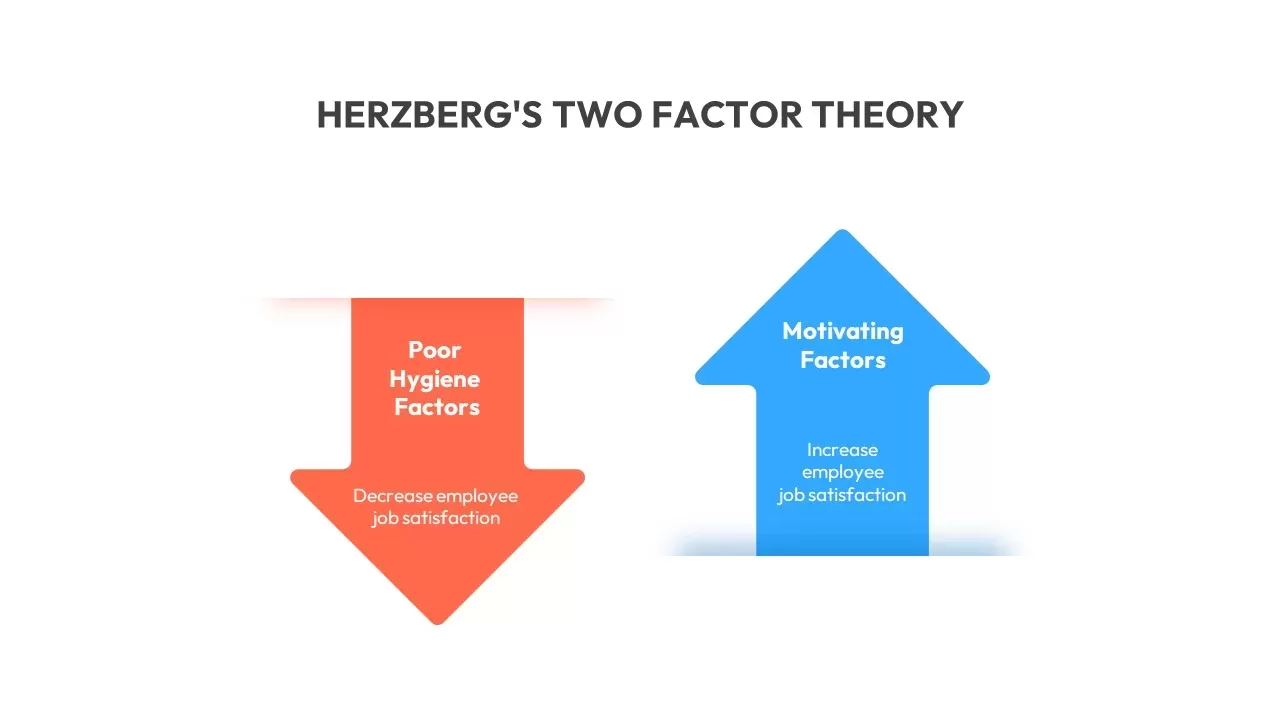
Herzberg’s Two Factor Theory Diagram Template for PowerPoint & Google Slides
Comparison
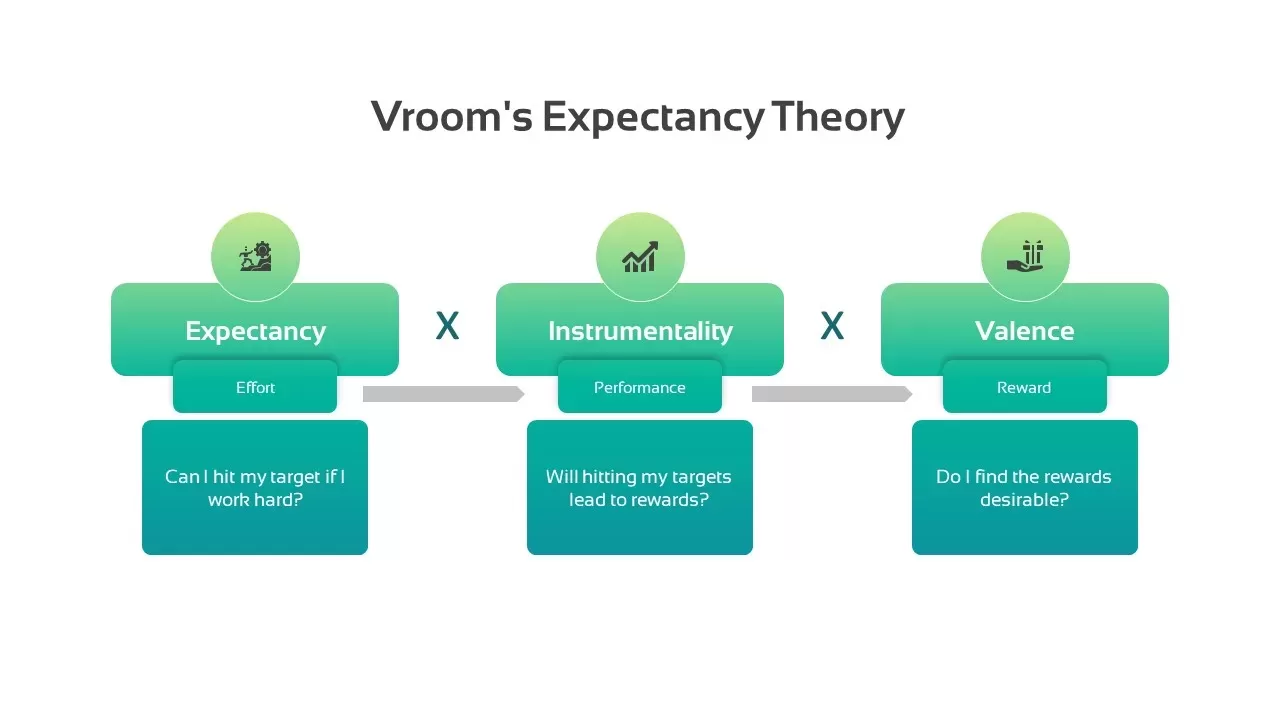
Vroom’s Expectancy Theory Infographic Template for PowerPoint & Google Slides
Process
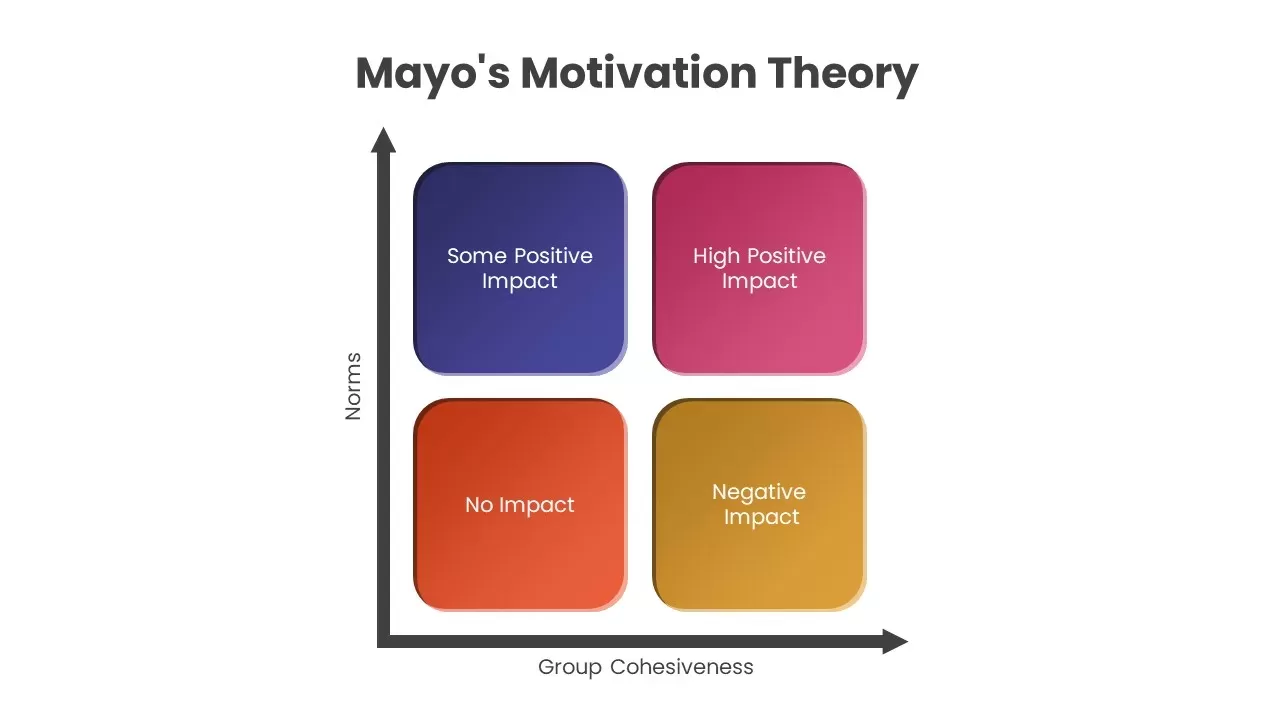
Mayo’s Motivation Theory Diagram Template for PowerPoint & Google Slides
Comparison
Adam’s Equity Theory Scale Comparison Template for PowerPoint & Google Slides
Comparison
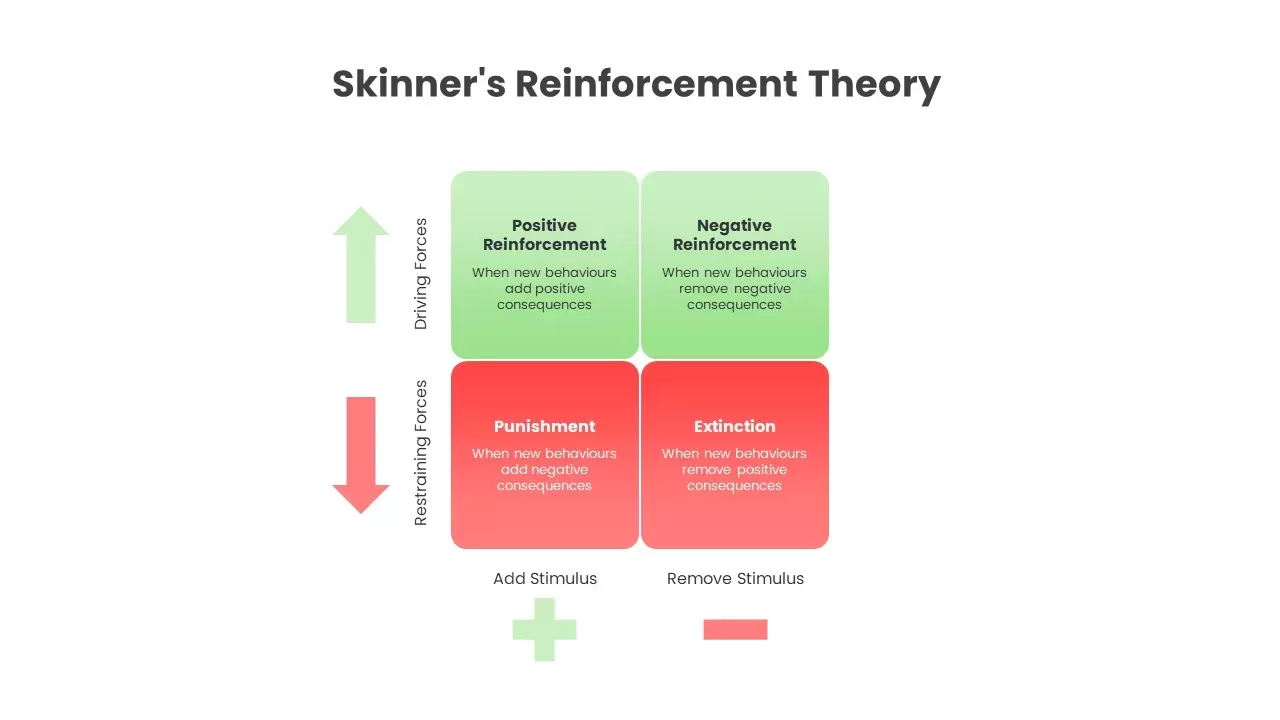
Skinner’s Reinforcement Theory Matrix Template for PowerPoint & Google Slides
Comparison
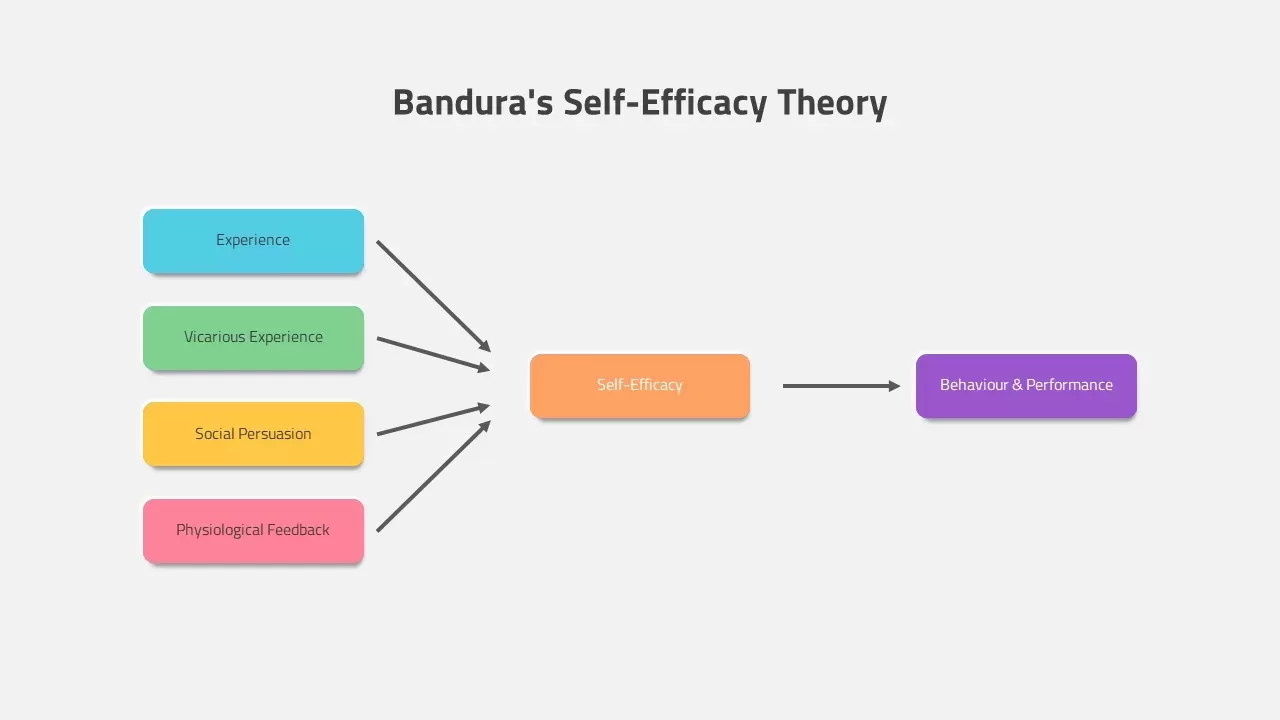
Bandura’s Self-Efficacy Theory Template for PowerPoint & Google Slides
Process
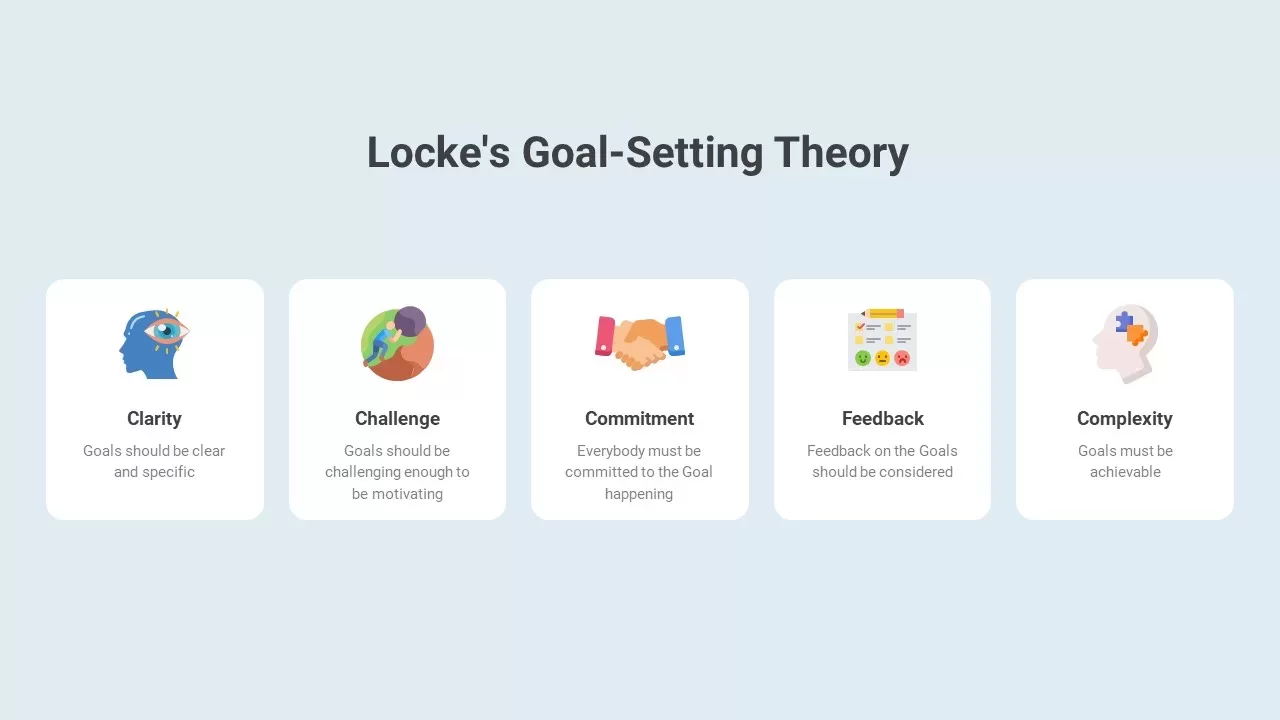
Locke’s Goal-Setting Theory Infographic Template for PowerPoint & Google Slides
Goals
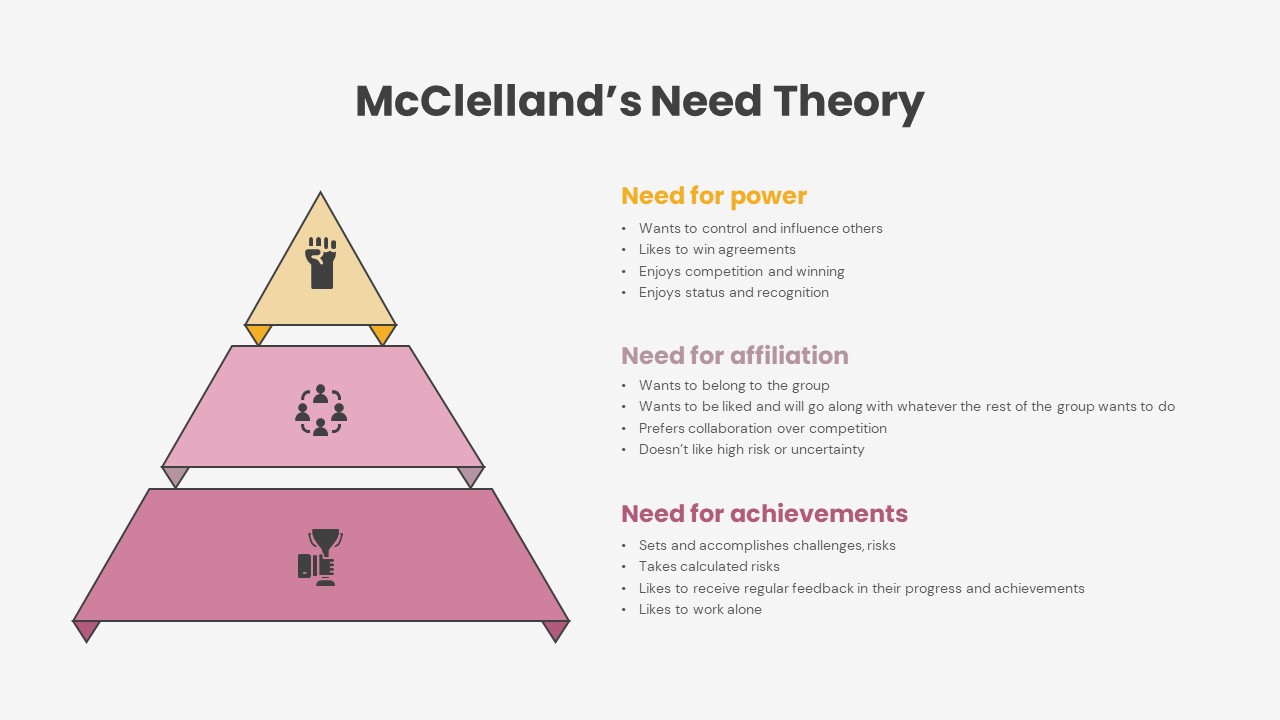
McClelland’s Need Theory Pyramid Template for PowerPoint & Google Slides
Pyramid
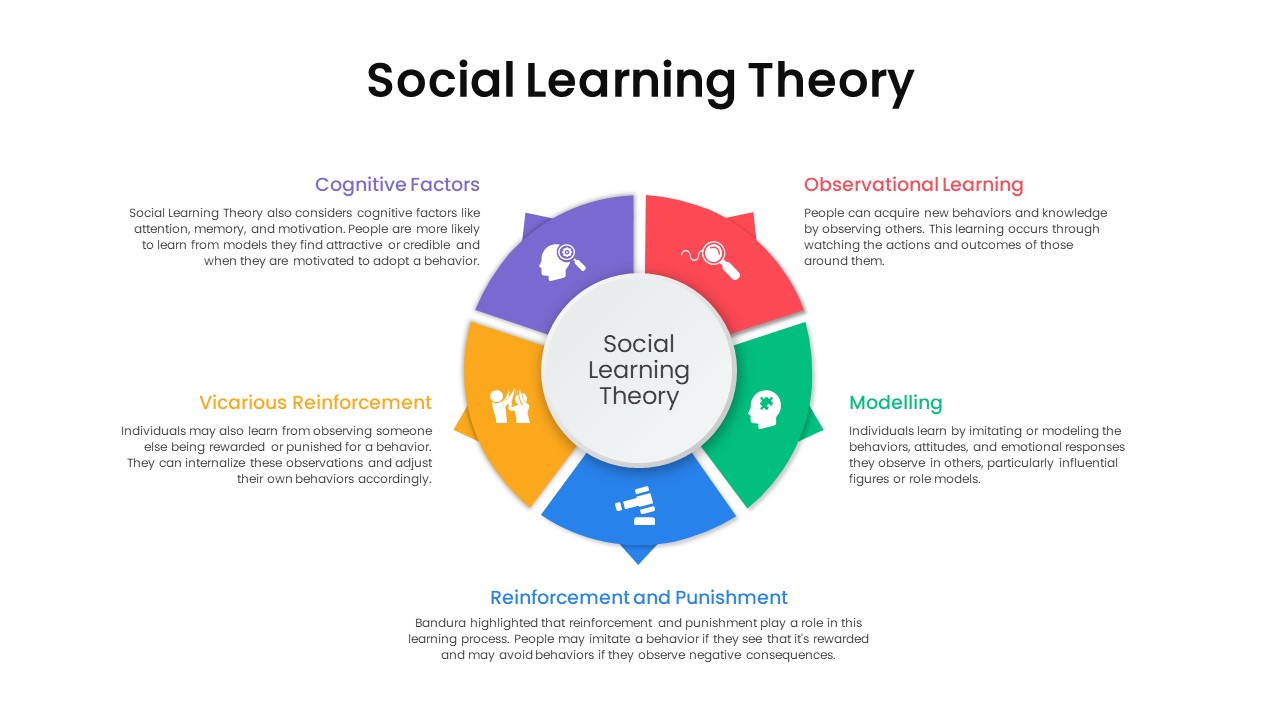
Social Learning Theory Infographic Template for PowerPoint & Google Slides
Circular
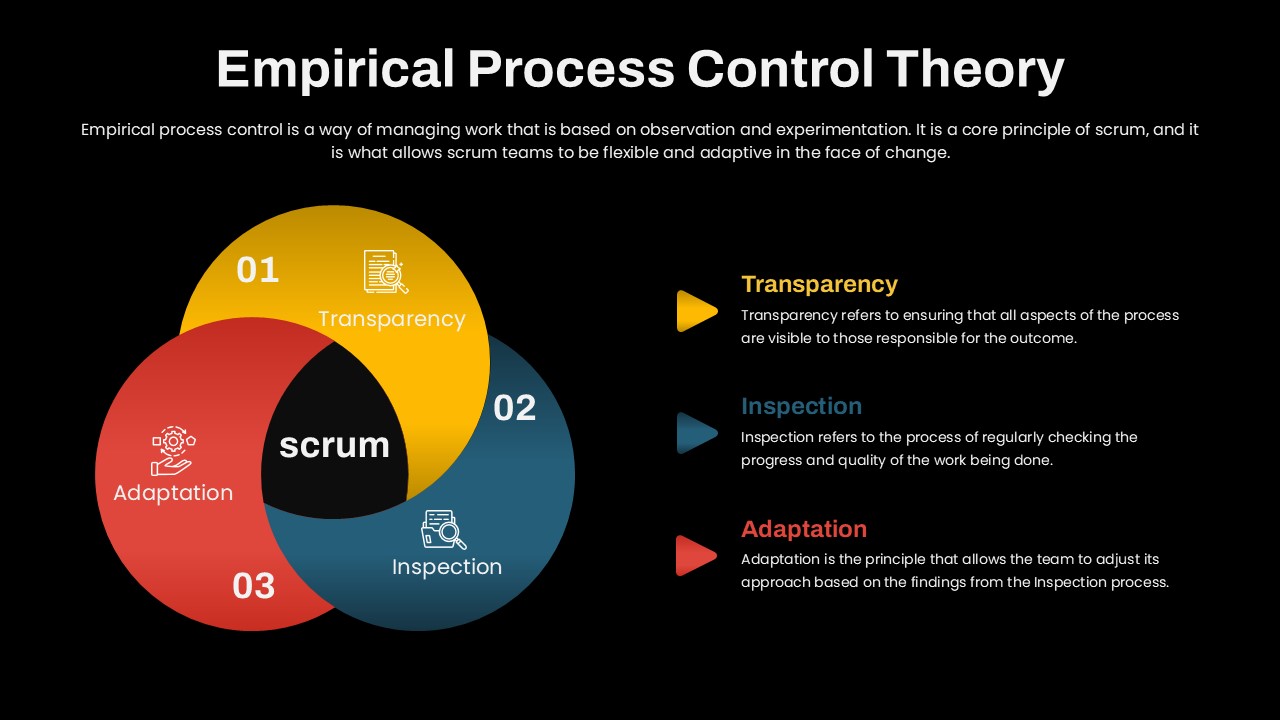
Empirical Process Control Theory Diagram Template for PowerPoint & Google Slides
Circular
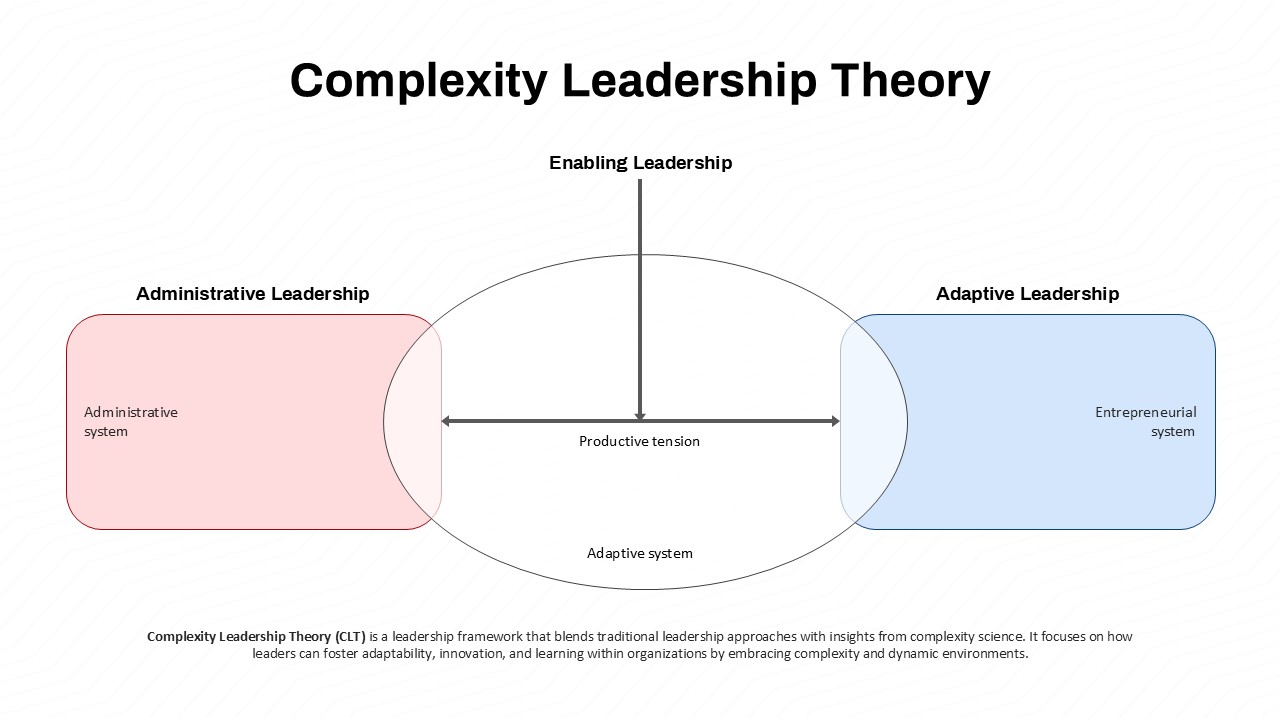
Complexity Leadership Theory Overview Template for PowerPoint & Google Slides
Leadership
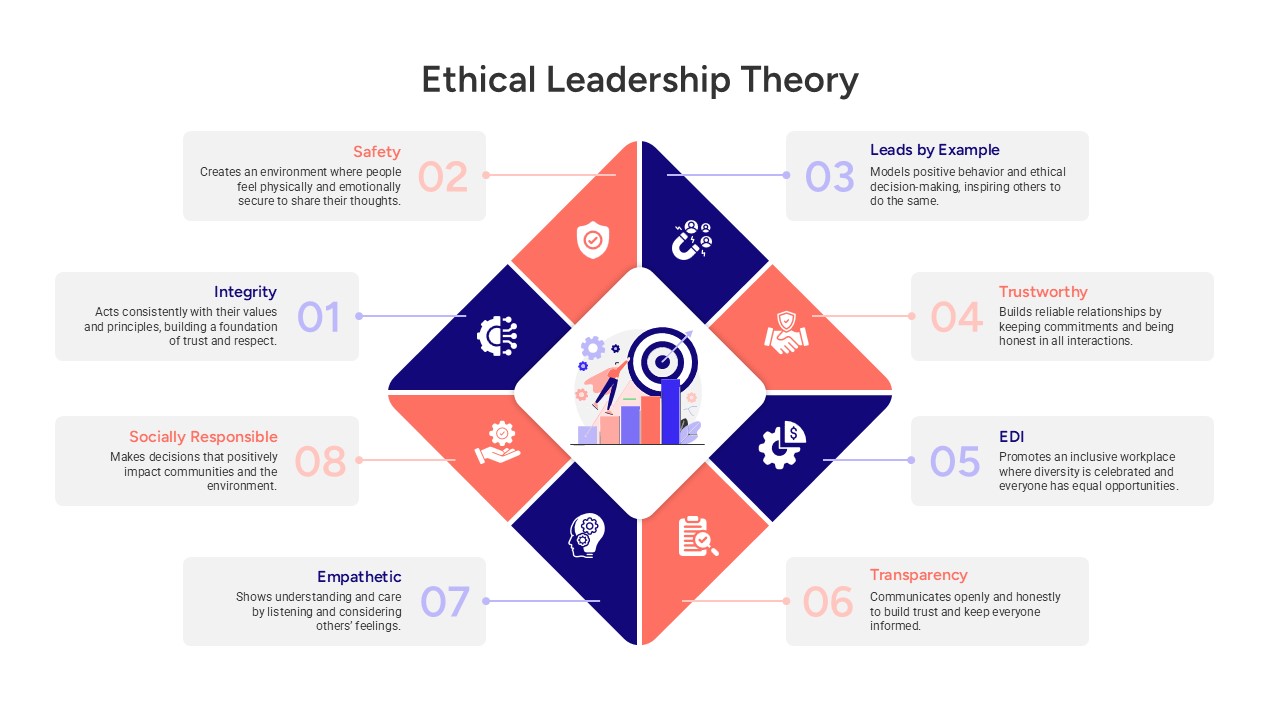
Ethical Leadership Theory Framework Template for PowerPoint & Google Slides
Leadership
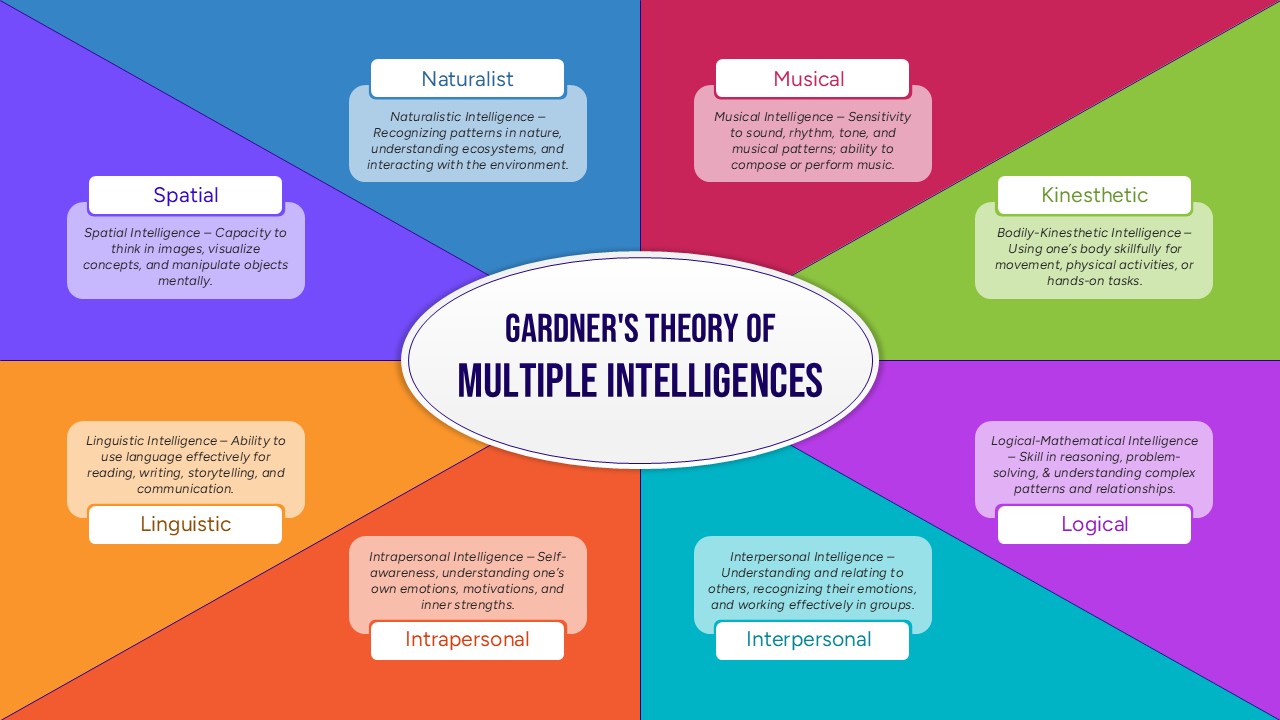
Gardner’s Theory of Multiple Intelligences Diagram Template for PowerPoint & Google Slides
Leadership
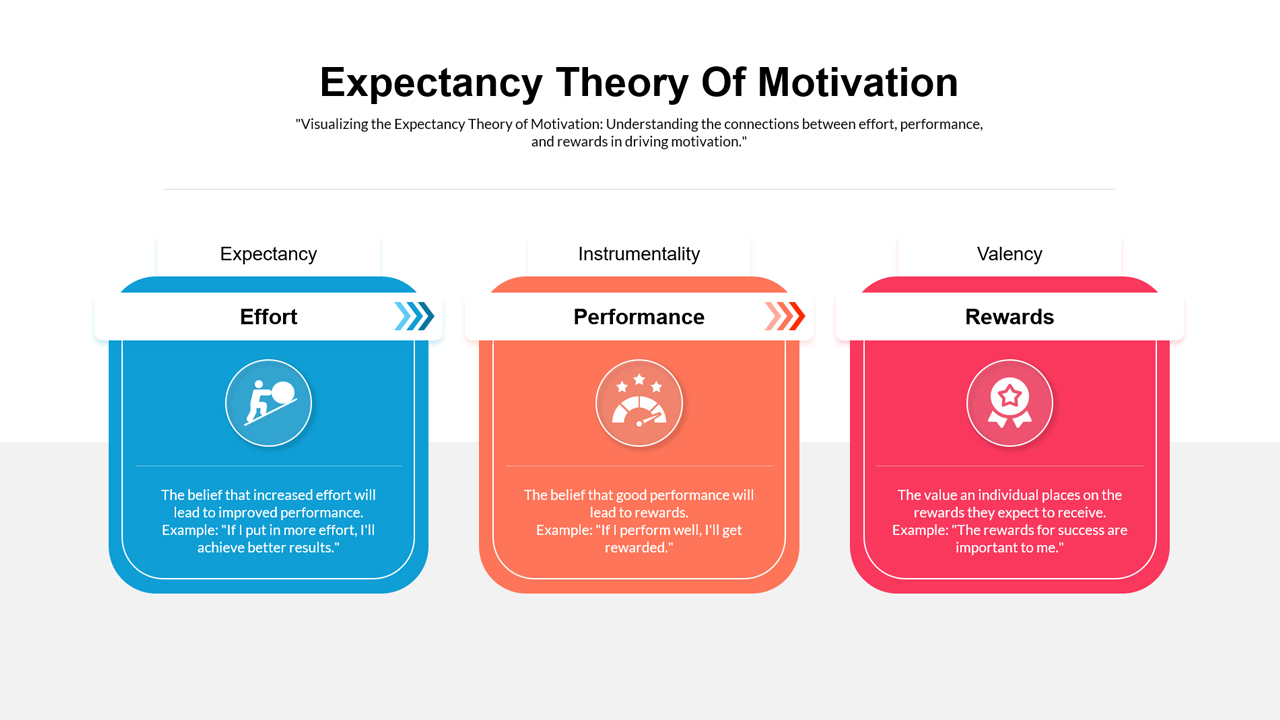
Expectancy Theory Of Motivation Template for PowerPoint & Google Slides
Process
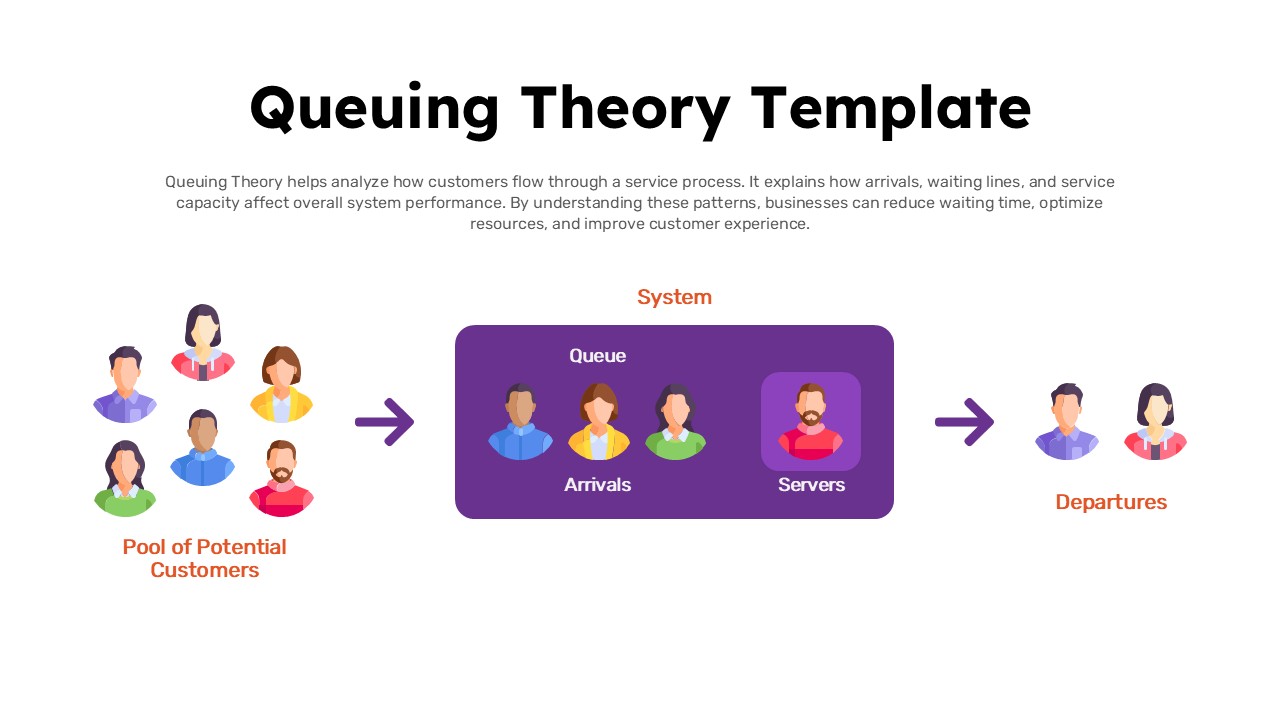
Queuing Theory System Flow Diagram Template for PowerPoint & Google Slides
Process
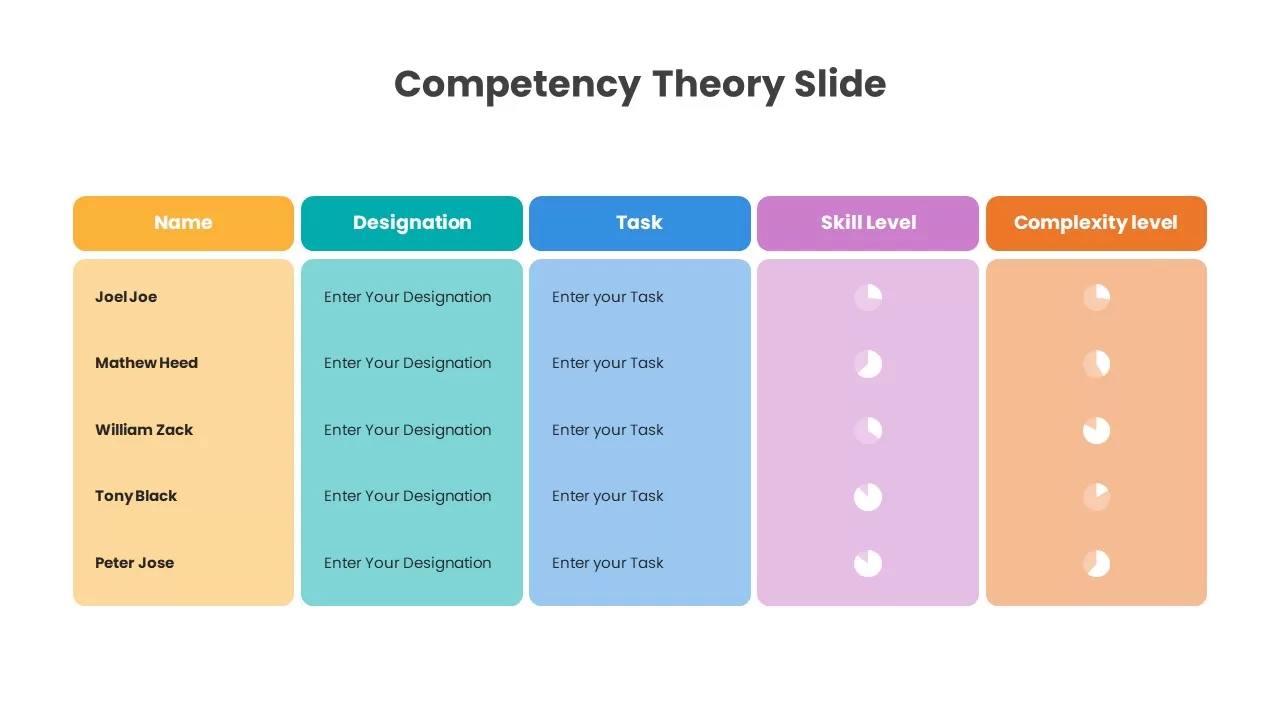
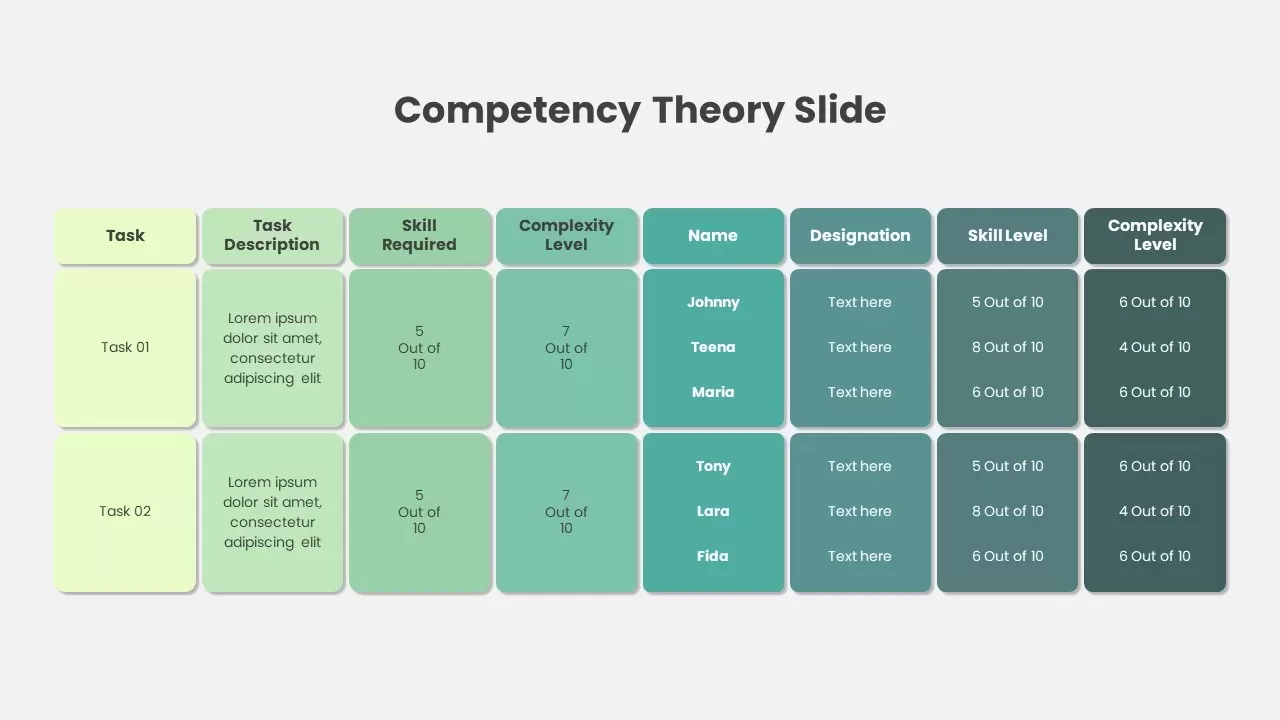
Competency Theory Slide for PowerPoint & Google Slides
Employee Performance
Competency Theory Slide for PowerPoint & Google Slides
Employee Performance
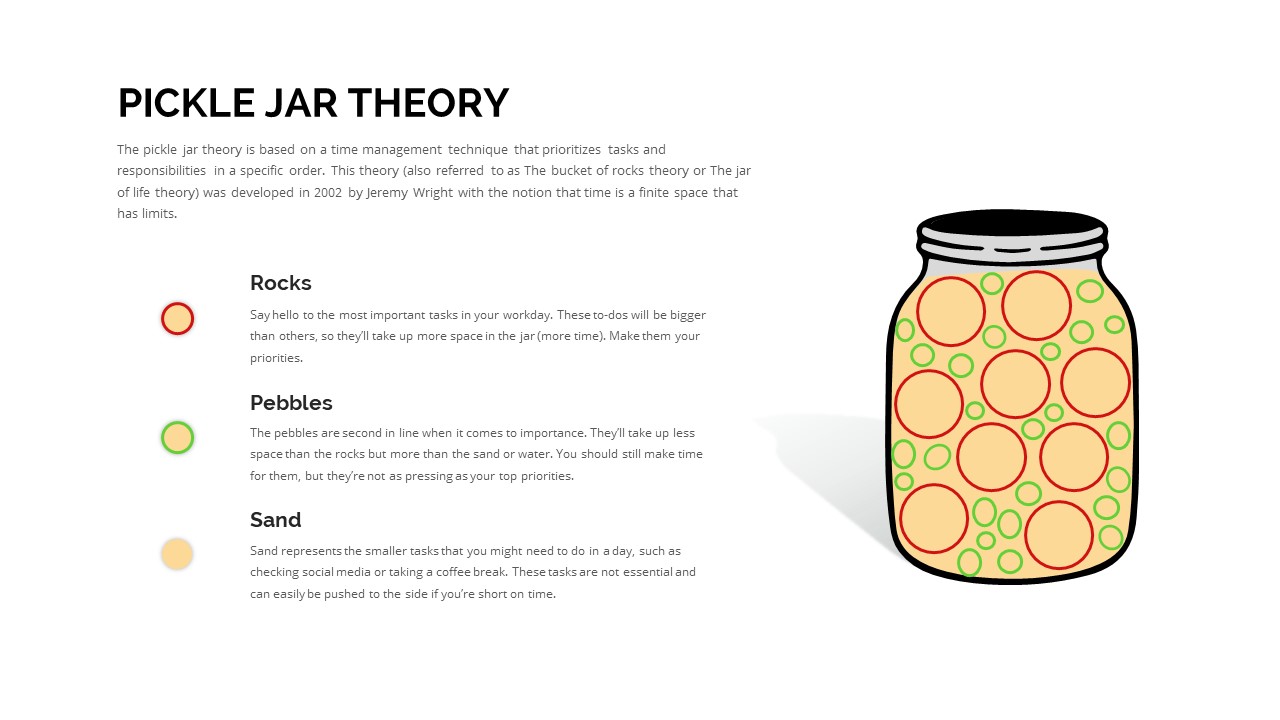
Pickle Jar Theory for PowerPoint & Google Slides
Business Strategy
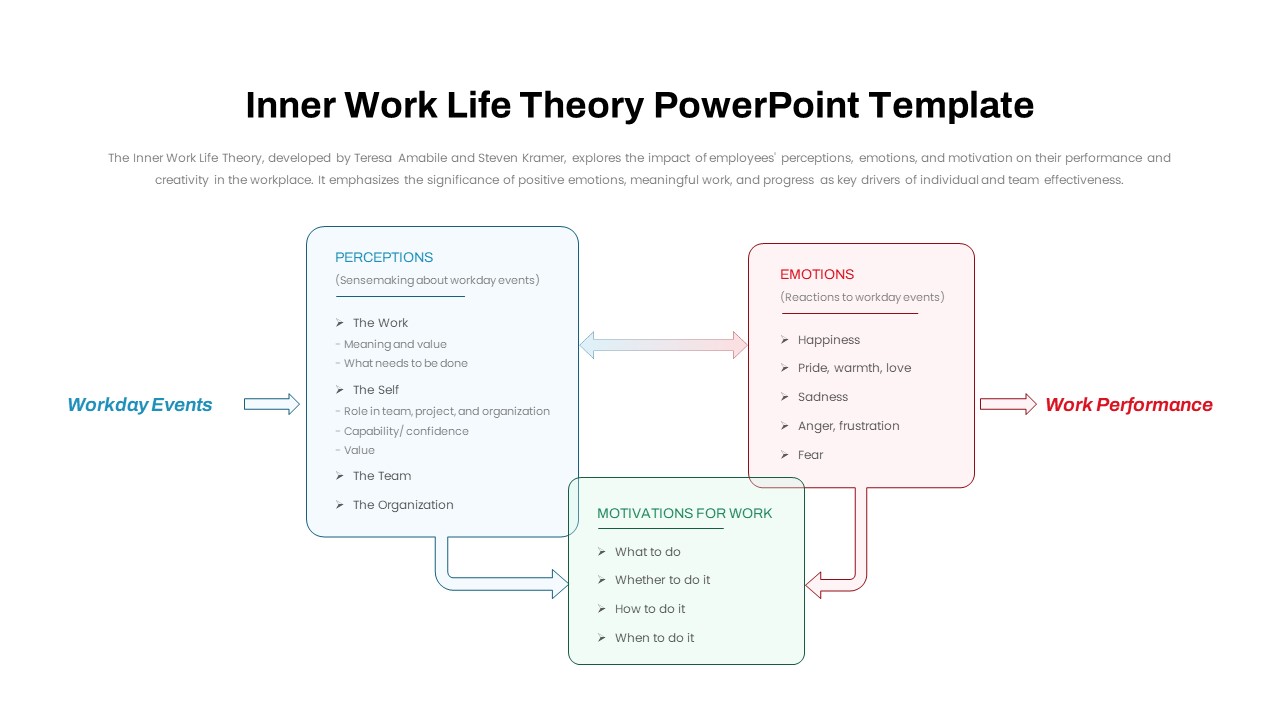
Inner Work Life Theory Diagram Slide for PowerPoint & Google Slides
Employee Performance
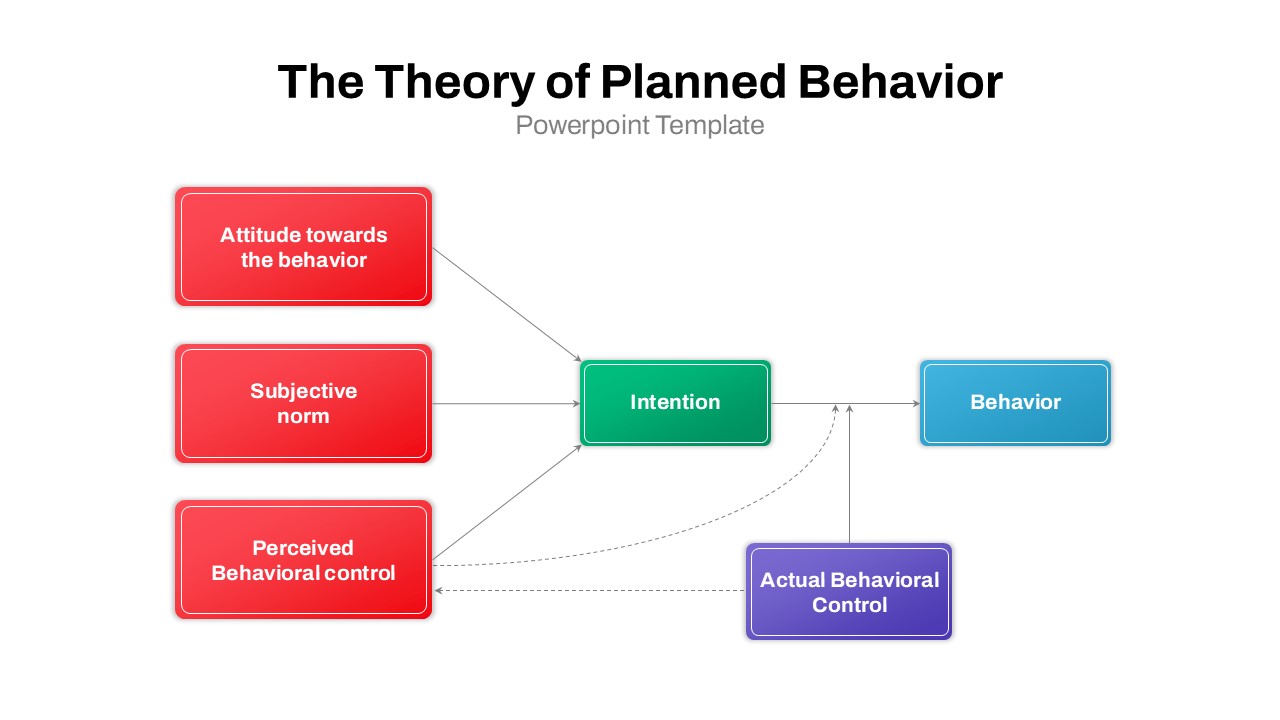
The Theory of Planned Behavior for PowerPoint & Google Slides
Flow Charts
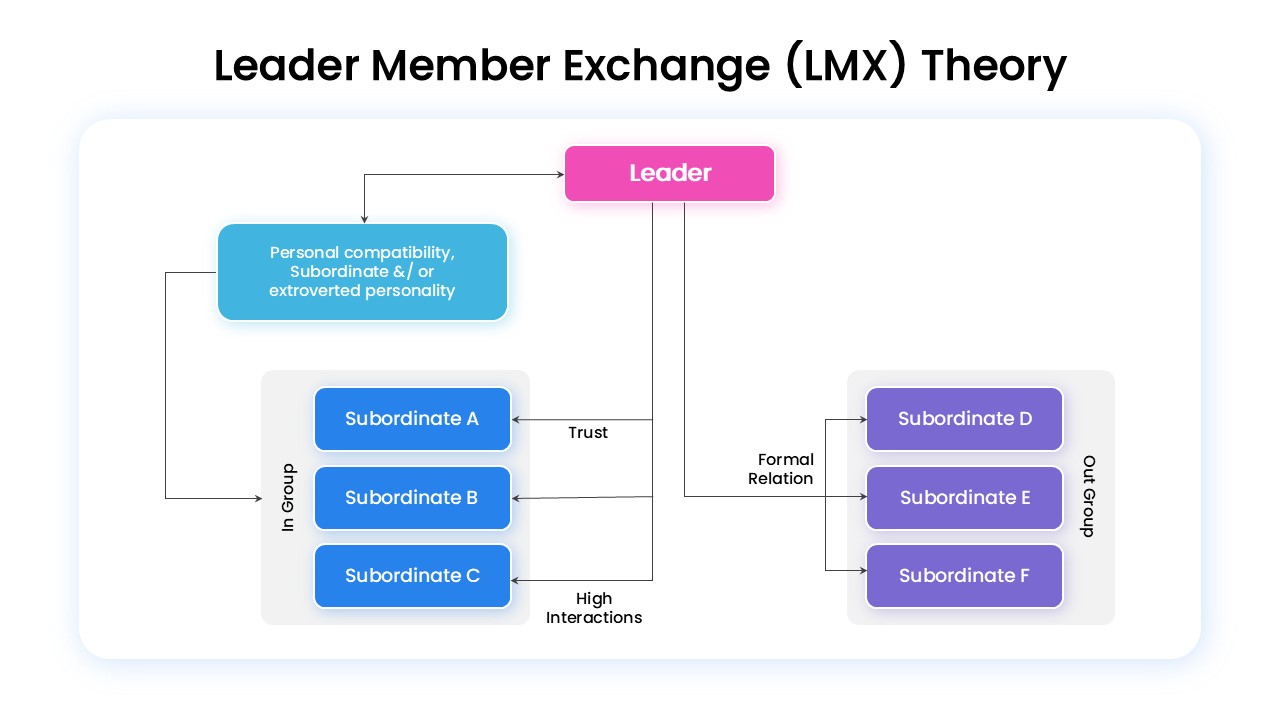
Leader-Member Exchange (LMX) Theory for PowerPoint & Google Slides
Business Strategy