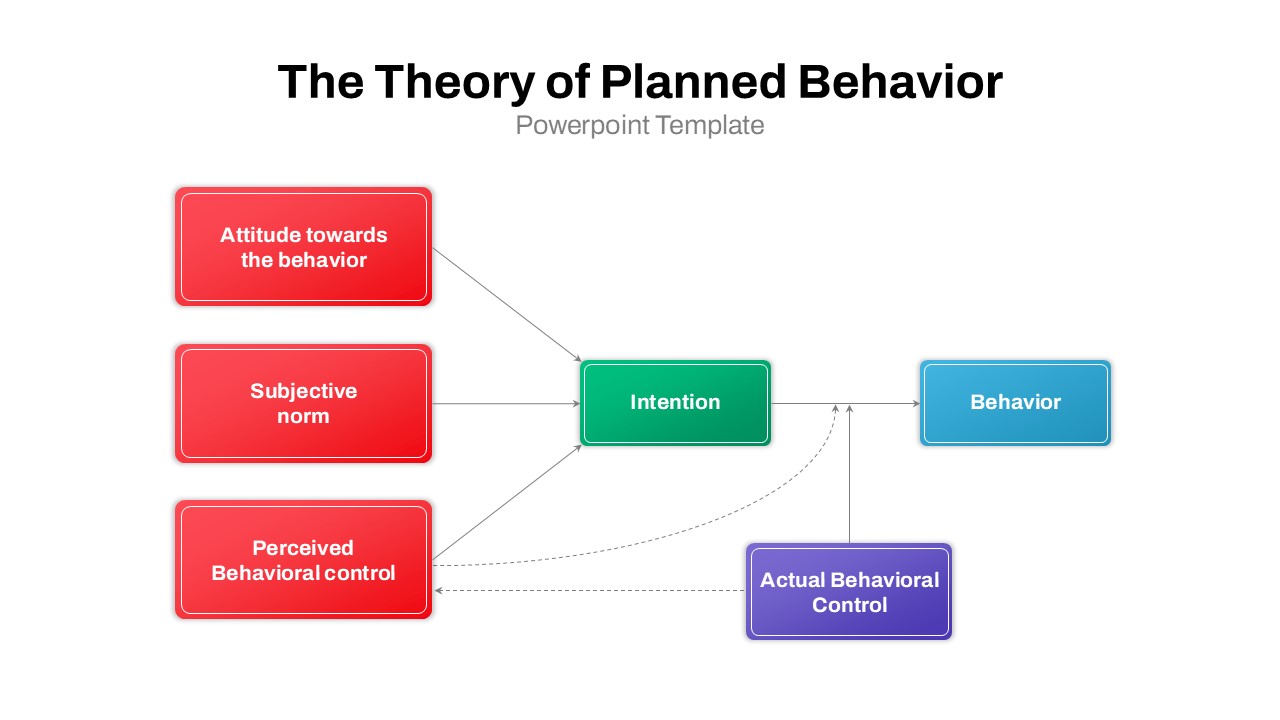
Theory of Planned Behavior Flowchart PowerPoint Template

Description
This slide visualizes the Theory of Planned Behavior, providing a structured representation of how attitudes, norms, and perceived control influence behavior. The diagram showcases the relationships between key components: Attitude towards the behavior, Subjective norm, Perceived behavioral control, Intention, and Actual behavioral control, leading to Behavior. The layout is clear and easy to follow, making it ideal for presentations on psychology, sociology, marketing, or organizational behavior.
The color-coded elements—red for the influencing factors, green for intention, blue for behavior, and purple for actual behavioral control—help distinguish each concept, enhancing comprehension. With this template, you can efficiently present the dynamic interaction between these components and how they drive individual or collective behavior.
Perfect for educational settings, workshops, and research presentations, this slide is fully customizable to fit any specific content or context. The visual clarity and professional design ensure it is suitable for both formal and informal settings, such as seminars, training sessions, or academic lectures.
Who is it for
This slide is ideal for psychologists, behavior scientists, sociologists, marketers, and educators involved in teaching or presenting theories of behavior, decision-making, or human action. It’s also great for anyone studying or researching human behavior and the factors that influence it.
Other Uses
In addition to explaining the Theory of Planned Behavior, this slide can be used to illustrate other behavior change models, decision-making processes, or the impact of psychological factors on outcomes. It’s also suitable for discussing consumer behavior, organizational behavior, and intervention strategies.
Login to download this file