Tech Stack PowerPoint Template featured image

Description
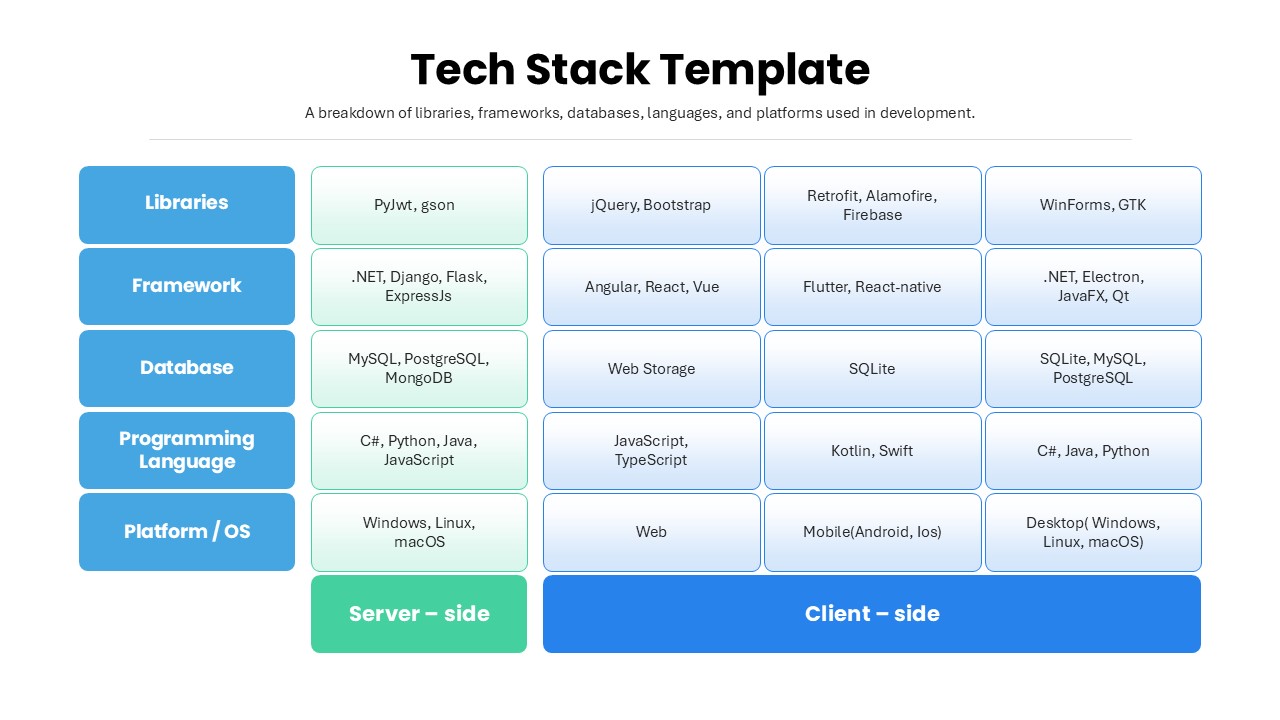
Visualize your application architecture with this comprehensive tech stack breakdown slide. Organized as a two-column table, the left column highlights server-side components—libraries, frameworks, databases, languages, and platforms—while the right column details client-side equivalents. Each row features bold header blocks in vibrant blue and green, paired with clean, editable cells that list examples like Django, React, PostgreSQL, Flutter, and more. Subtle gridlines and consistent typography ensure readability, while vector-based tables maintain sharpness at any scale.
Built on master slides and fully editable vector shapes, you can swap out technologies, adjust column labels, or recolor header blocks to align with your brand palette in seconds. Theme compatibility propagates custom fonts, color schemes, and logo assets seamlessly across both PowerPoint and Google Slides, eliminating manual formatting. Responsive snap-to-grid guides keep your layout perfectly aligned when you add or remove rows for additional layers like middleware or DevOps tools.
High-resolution exports guarantee crisp output for printouts, online reports, or large-screen presentations, while built-in animation presets let you reveal each layer sequentially to guide audience focus. Whether you’re mapping your application stack for developer onboarding, stakeholder briefings, or architecture reviews, this slide streamlines your narrative by turning complex stacks into an intuitive, side-by-side comparison.
Who is it for
Software architects, development leads, CTOs, technical trainers, and product managers who need a clear, professional slide to present and compare server-side vs. client-side components in their tech ecosystem.
Other Uses
Repurpose this template for DevOps toolchains, API vs. UI comparisons, cloud service vs. on-premise infrastructure, data pipeline mappings, or any scenario requiring structured, side-by-side technical breakdowns.
Login to download this file


