


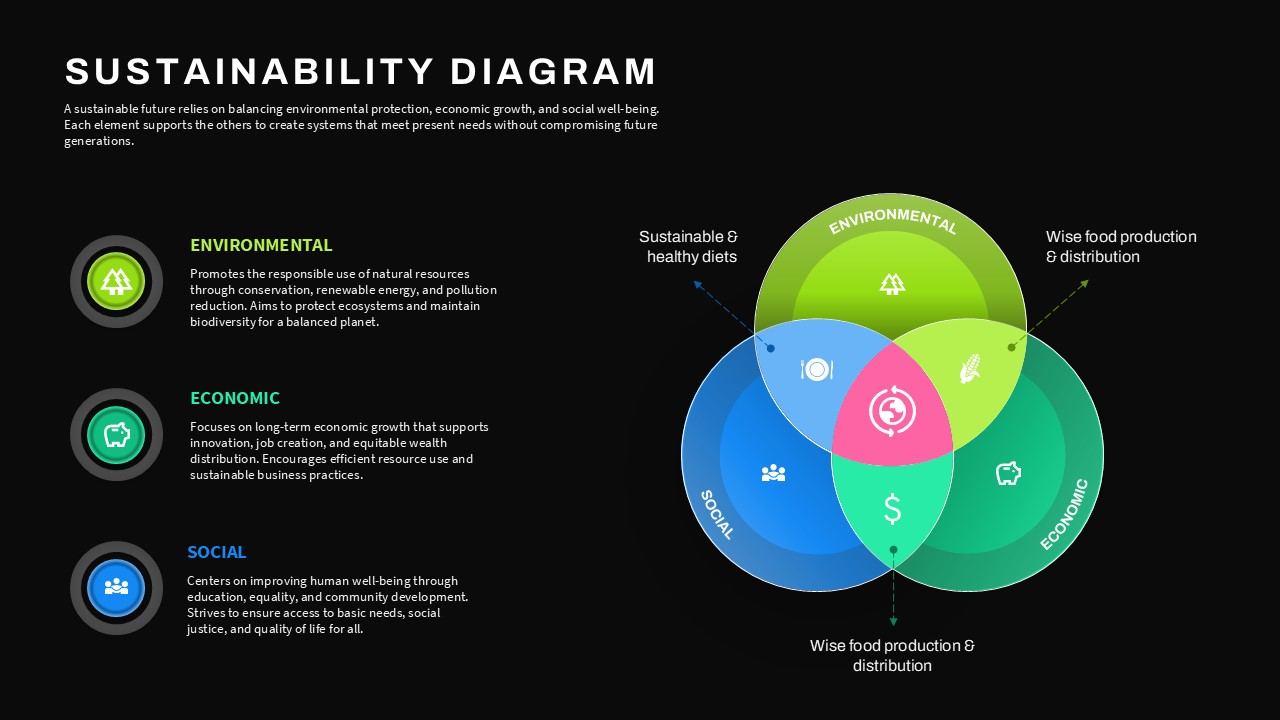
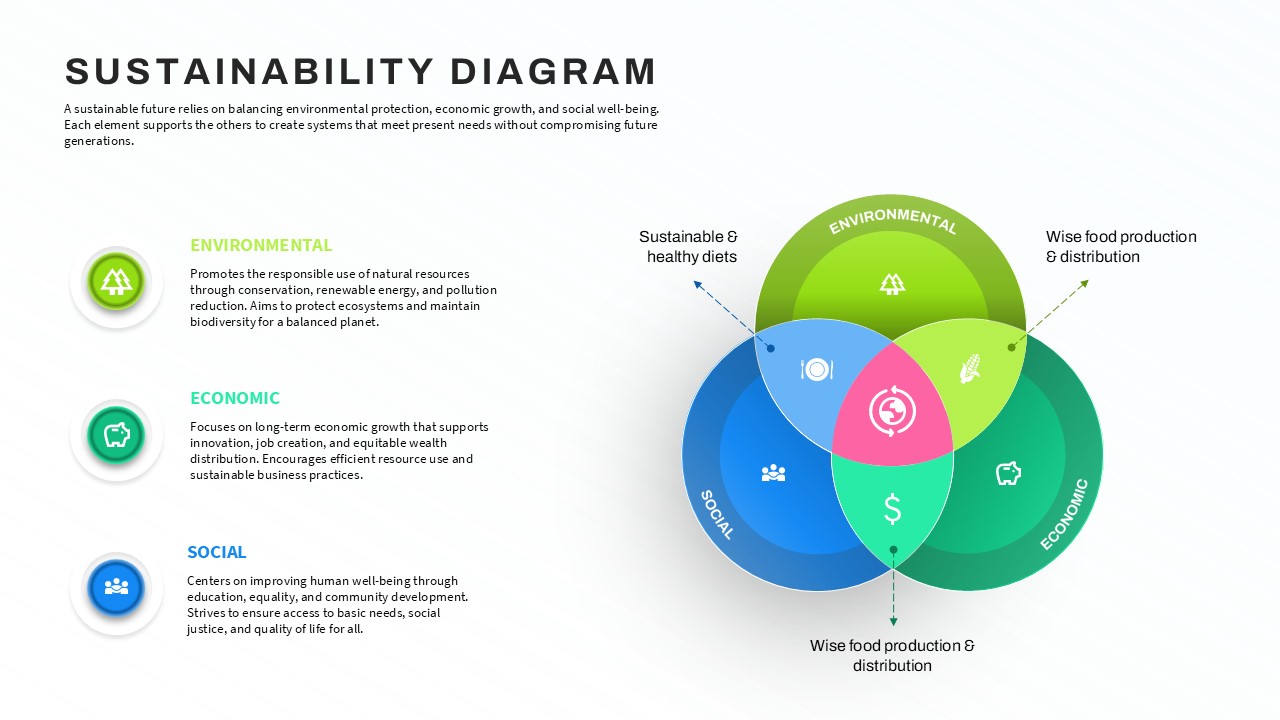
Sustainability Triple Bottom Line Venn Diagram Slide
This template is part of a deck featuring multiple slides. To check out all slides, click on See All.
See All

Login to download this file
Item ID
SB05730Designed By
Anand

Login to download this file
Item ID
SB05730Designed By
Anand