3 horizons slide


Description
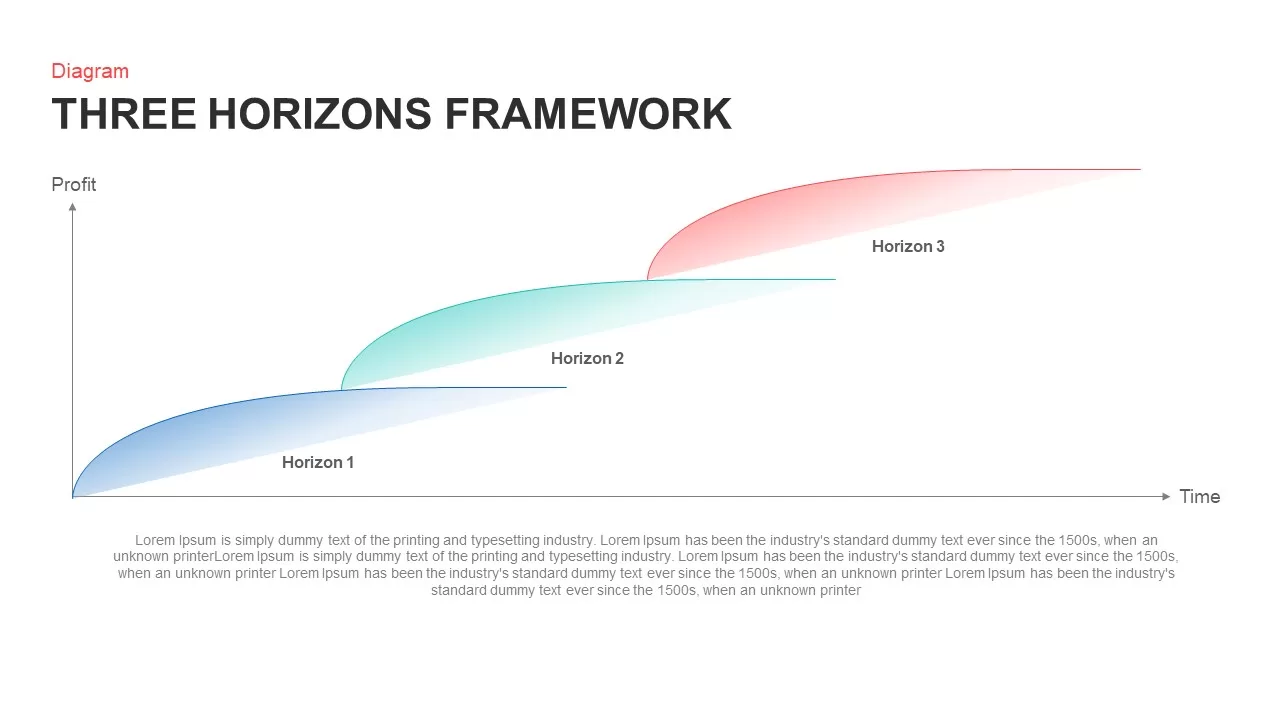
Drive strategic alignment and long-term growth planning with this comprehensive Three Horizons framework deck. The set includes four fully editable slides: an overview of the three‐stage profit-time curves plus dedicated detail slides for Horizon 1 (0–12 months), Horizon 2 (12–36 months), and Horizon 3 (36–72 months). Each slide features smooth gradient arcs—blue, teal, and coral—mapped against profit and time axes, with numbered markers highlighting transition points. Adjacent text panels on the detail slides provide structured placeholders for objectives, initiatives, and KPIs, ensuring your narrative flows logically and persuasively.
Built on master slides for both PowerPoint and Google Slides, this template enables instant customization of colors, fonts, markers, and annotations. Use built-in alignment guides to maintain consistent spacing, duplicate or hide slides to suit your presentation length, and swap gradients to match your corporate palette. The high-contrast, modern design guarantees legibility in virtual and in-room settings, while vector shapes ensure pixel-perfect clarity at any resolution.
Whether you’re briefing executives on portfolio balance, charting innovation pipelines, or conducting investor workshops, this deck accelerates slide creation and enforces visual consistency. The progressive curves underscore the shift from core offerings through expansion projects to breakthrough ventures, helping stakeholders grasp trade-offs and resource allocation. With seamless compatibility across platforms, you can collaborate in real time without version-control headaches.
Who is it for
Corporate strategists, innovation leads, and portfolio managers will leverage this framework to prioritize initiatives and balance short-, mid-, and long-term investments. Consultants, product teams, and C-suite executives can use the detailed slides to anchor data-driven discussions and secure stakeholder buy-in.
Other Uses
Repurpose this deck for roadmap planning, capability maturity models, R&D pipelines, or phased rollouts. Simply adjust axis labels, curve gradients, and text placeholders to map financial forecasts, operational milestones, or change-management phases.
Login to download this file


