Strategic Planning Cone Diagram PPT 2


Description
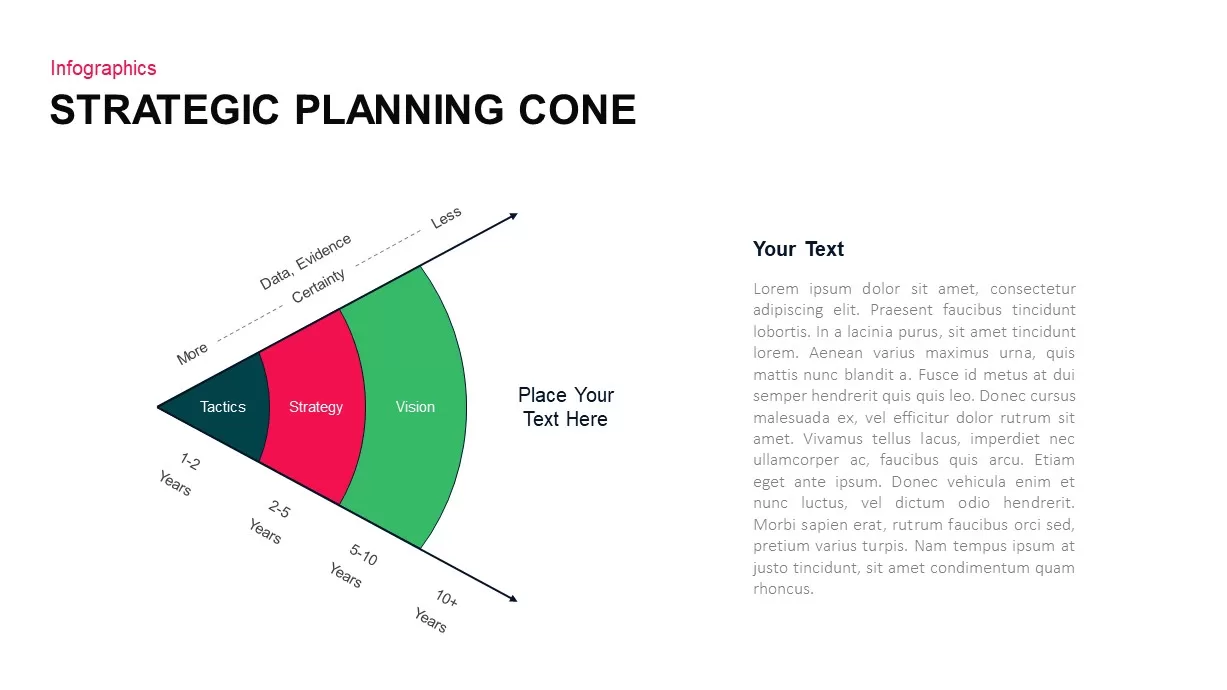
Visualize the relationship between short-term tactics, mid-term strategy, and long-term vision using this Strategic Planning Cone template. Three expanding arcs form a cone shape, color-coded in dark teal, magenta, and green for instant clarity. Segments are labeled “Tactics” (1–2 years), “Strategy” (2–5 years), and “Vision” (5–10 years), while an extending arrow denotes 10+ years. A dashed line along the arc highlights the shift from high data certainty to lower predictive precision. Each segment offers editable text and icon placeholders, and a side panel provides space for detailed annotations. The clean white background and minimalist typography ensure the cone remains the focal point, and master slide controls let you customize colors, fonts, and labels without altering the layout.
Optimized for both PowerPoint and Google Slides, this fully editable slide maintains crisp resolution across devices. Adjust timeline markers, swap icons, or overhaul the color palette in seconds to align with your brand guidelines. Ideal for illustrating strategic roadmaps, forecasting scenarios, or phased initiatives, this layout condenses complex narratives into a single, cohesive visual.
Who is it for
This slide is perfect for C-suite executives, project managers, and strategy consultants aiming to communicate phased initiatives or long-range planning. Product owners, marketing directors, and financial analysts can use the cone diagram to align stakeholders around growth milestones, risk assessments, and resource allocation over varying horizons.
Other Uses
Beyond strategic planning, repurpose this cone framework for investment roadmaps, technology adoption curves, or product life-cycle analyses. Educators and trainers can adapt the design to explain concept progression or research timelines. By relabeling segments and tweaking hues, you can also showcase performance benchmarks, maturity models, or roadmap gating criteria.
Login to download this file


