


Editable South America Map PowerPoint Template
Description
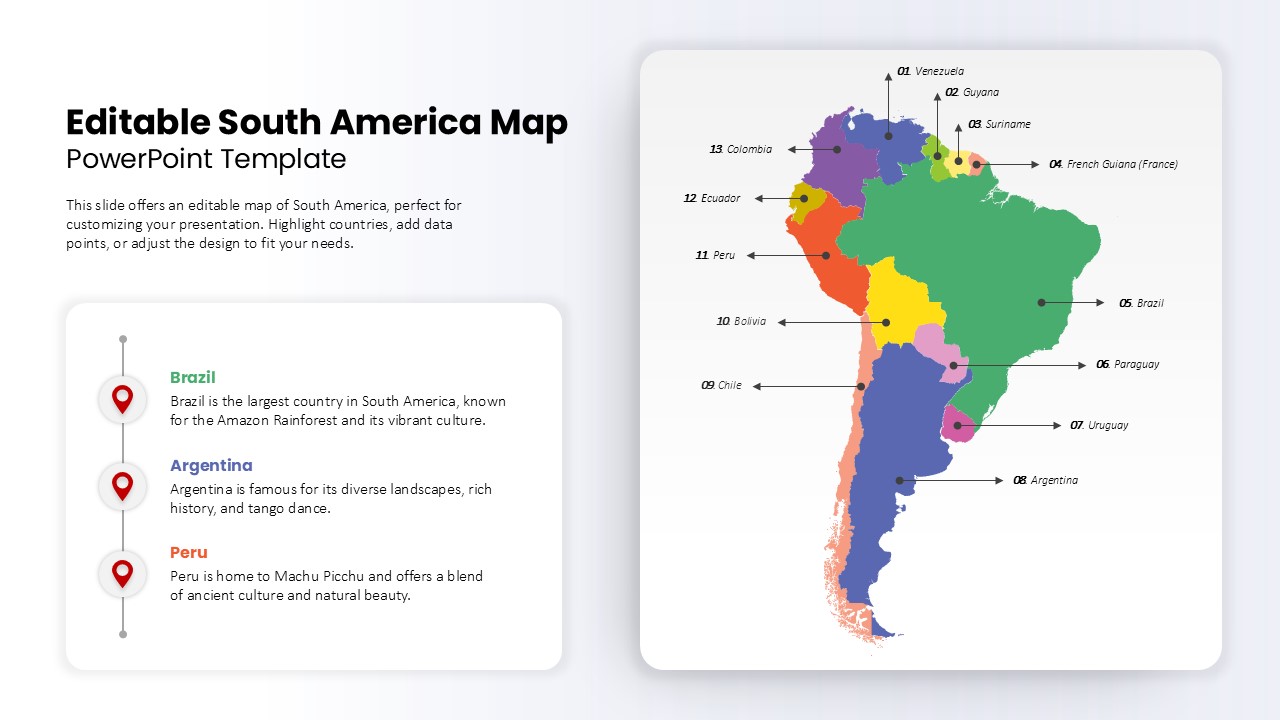
This slide offers a fully editable South America map diagram, perfect for highlighting individual countries, placing data points, or annotating regional insights. Each nation is rendered as a distinct vector shape in vibrant colors, with numbered callouts and arrows linking to side annotations. On the left, a tidy vertical timeline panel features pin icons and text placeholders for up to three country highlights—such as Brazil, Argentina, and Peru—with title and descriptive text. The clean white background, subtle drop shadows, and master‐slide layout make it easy to swap colors, adjust labels, or reposition markers without disturbing alignment. Whether you need to showcase market coverage, demographic data, or logistical hubs, this map diagram adapts seamlessly to both PowerPoint and Google Slides.
Who is it for
Marketing analysts, regional managers, consultants, and educators who need to visualize geographic data, compare country metrics, or illustrate expansion plans across South America.
Other Uses
Repurpose this template for sales territory mapping, supply-chain analyses, travel itineraries, demographic studies, or risk-assessment overlays by updating callouts, colors, and annotations to suit any regional narrative.
Login to download this file

Item ID
SB04909