Sliding Scale template for PowerPoint & Google Slides


Description:
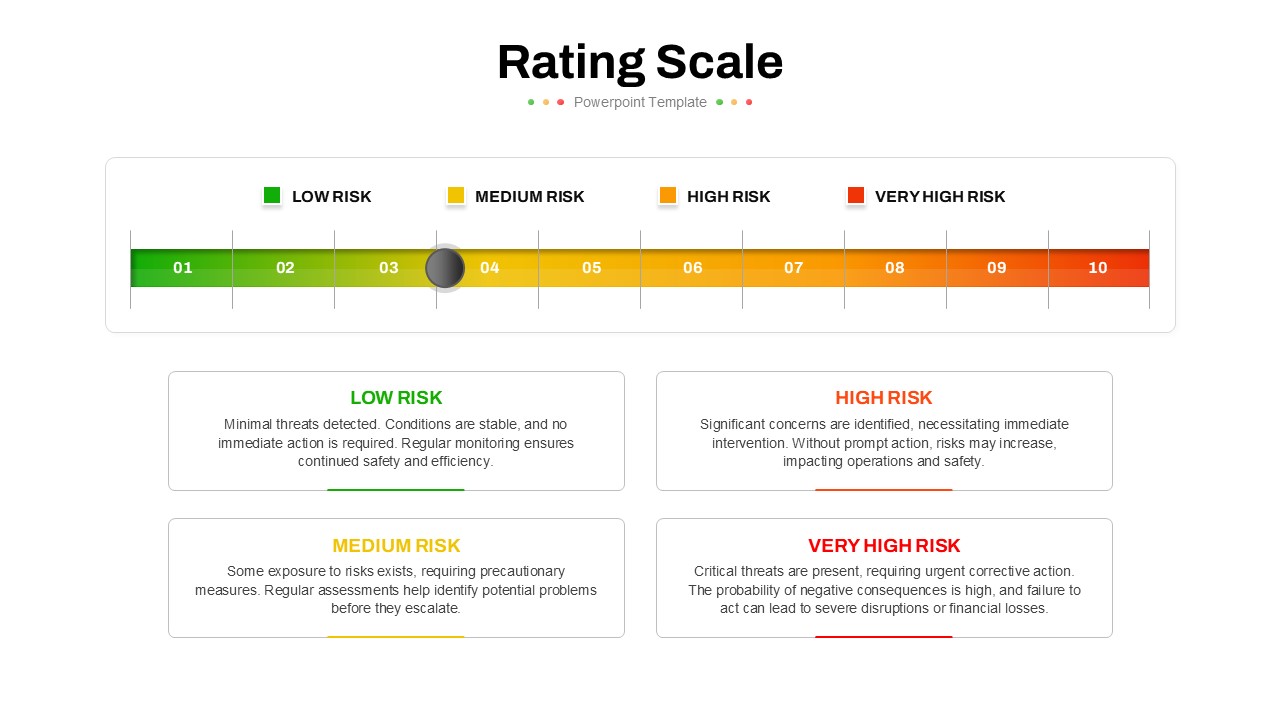
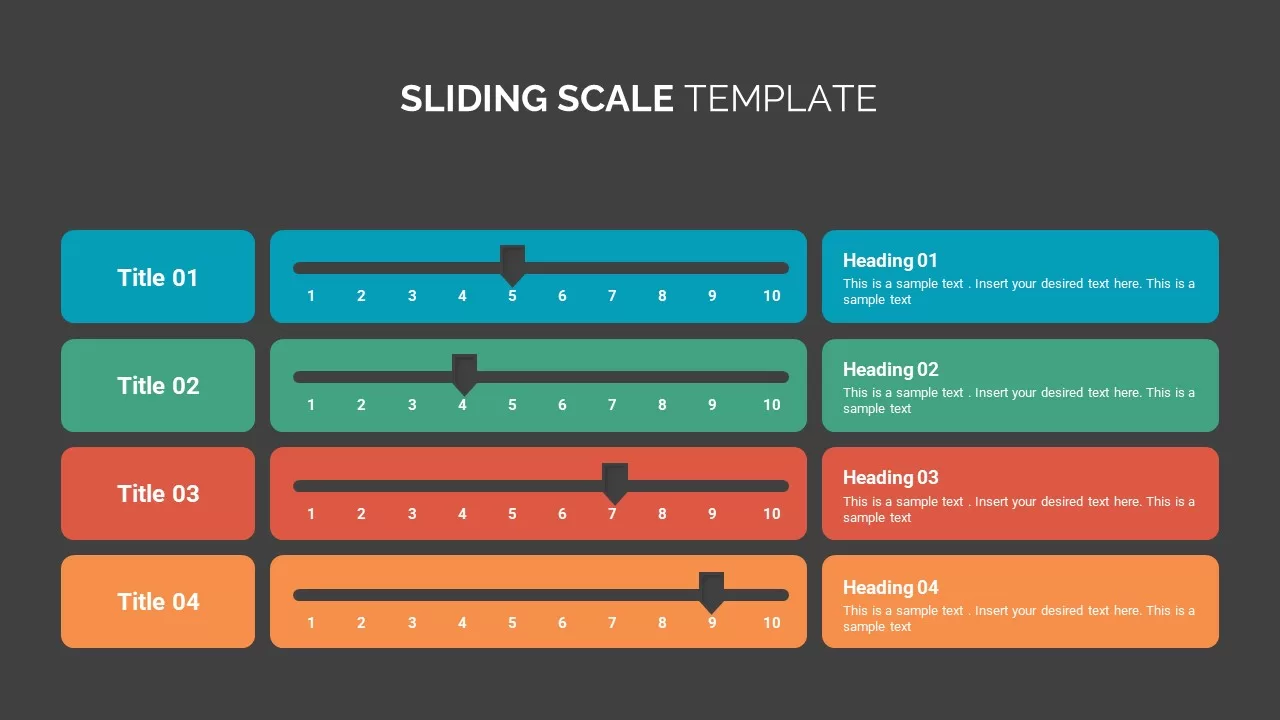
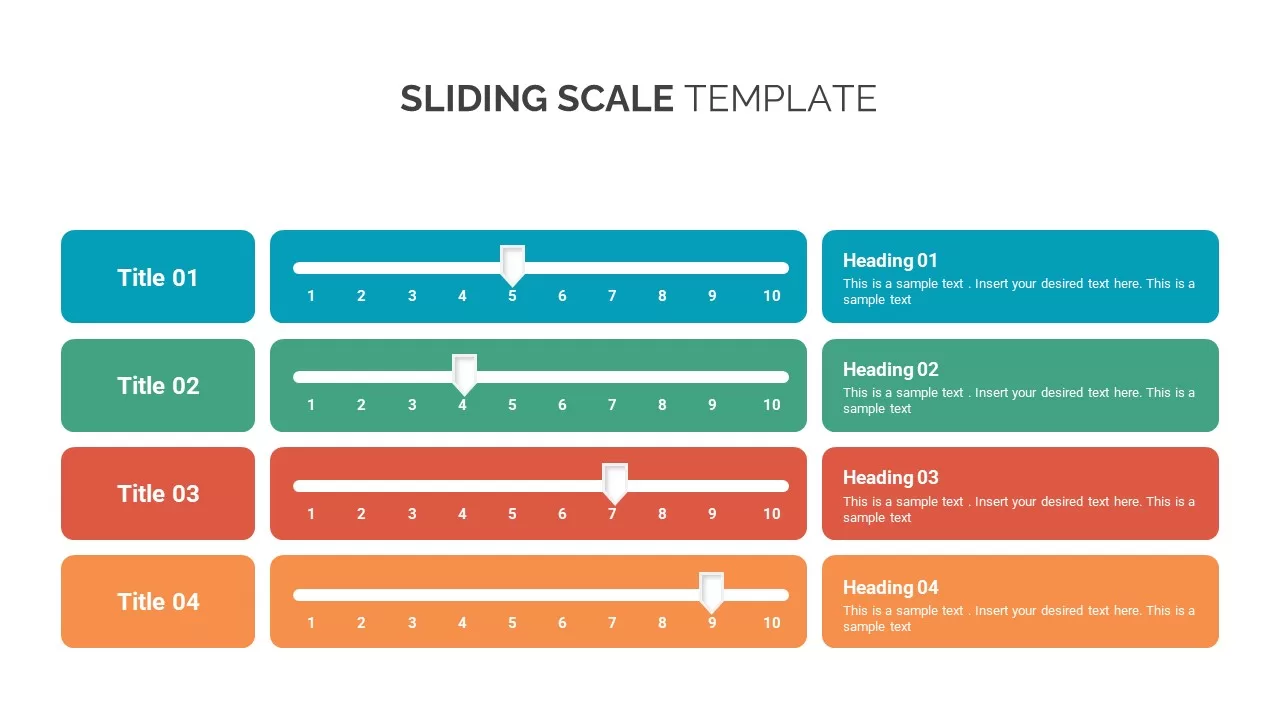
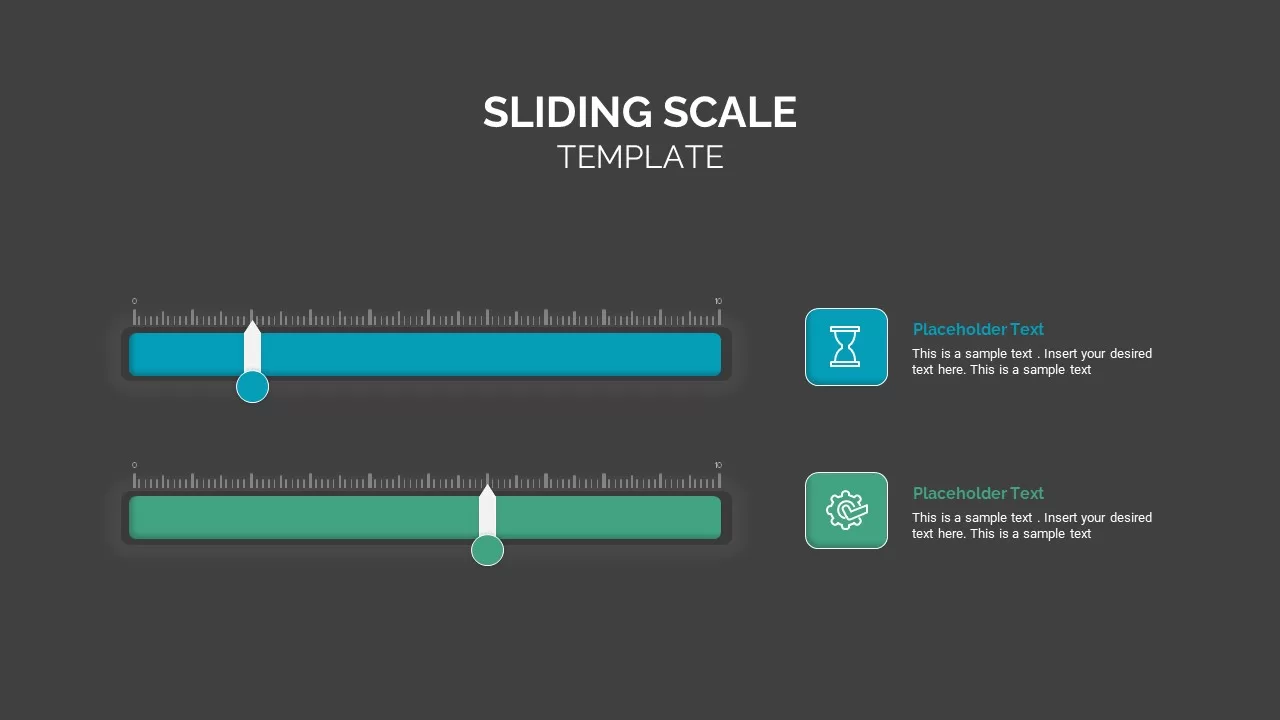
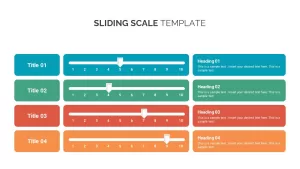
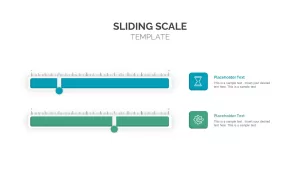
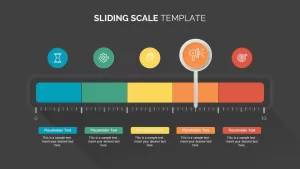
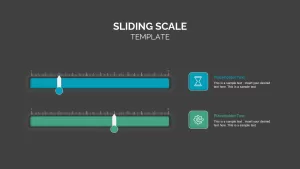
The Sliding Scale template is a visually engaging way to represent data along a continuum, ideal for illustrating progress, ratings, or comparisons. With its clean, modern design, this template offers a series of customizable sliders, allowing you to plot data or key factors on a scale from 0 to 10. Each slider can be paired with text placeholders, making it perfect for tracking performance, evaluating conditions, or comparing multiple categories.
This template features colorful sliding scales that can be tailored to match your specific data points, and icons are included to enhance each slider’s meaning. The minimalistic yet vibrant design ensures that each scale stands out, while still maintaining a professional and clear aesthetic. Whether you’re presenting performance metrics, survey results, or progress reports, the Sliding Scale template brings clarity and visual impact to your presentation.
Fully compatible with both PowerPoint and Google Slides, this template makes it easy to adapt and present your data across platforms. Its flexibility allows for a variety of use cases—from project management, customer satisfaction surveys, to business performance tracking.
Who is it for
This template is ideal for project managers, business analysts, and marketers who need to present quantitative data or track progress on various factors. It’s also great for educators, consultants, and HR professionals who want to evaluate or illustrate performance metrics or developmental stages.
Other Uses
In addition to tracking performance or progress, the Sliding Scale template can be used for visualizing customer satisfaction, product quality assessments, competency levels, or risk evaluations. It is also useful in surveys, feedback forms, and status reports, where a sliding scale helps simplify complex information into an easy-to-understand visual format.
Login to download this file

Item ID
SB02345
Related Templates

Emoji Scale PowerPoint Diagram for PowerPoint & Google Slides
Infographics

Scale Metaphor Metrics Comparison Template for PowerPoint & Google Slides
Charts
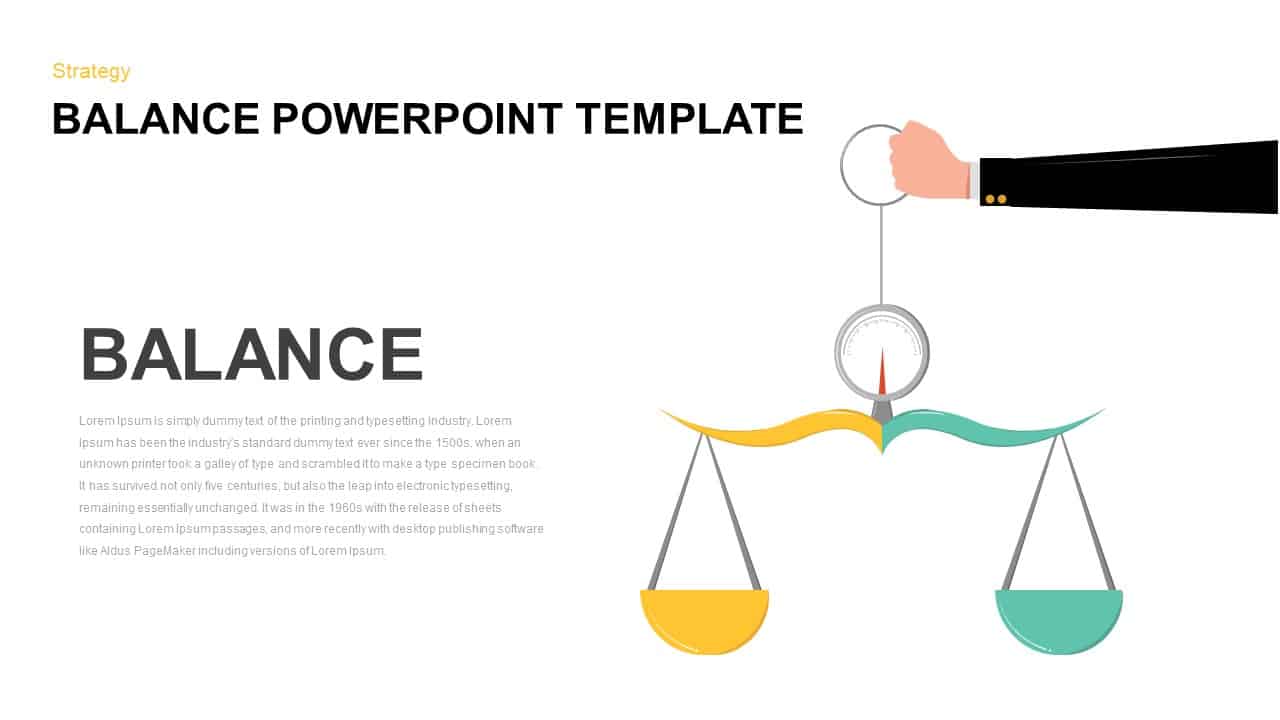
Mustard and Navy Balance Scale Metaphor Template for PowerPoint & Google Slides
Comparison
Balance Scale Visualization Infographic Template for PowerPoint & Google Slides
Comparison
IQ Scale Analysis Diagram template for PowerPoint & Google Slides
Employee Performance
Adam’s Equity Theory Scale Comparison Template for PowerPoint & Google Slides
Comparison
Economies of Scale Cost Curve Comparison Template for PowerPoint & Google Slides
Comparison Chart
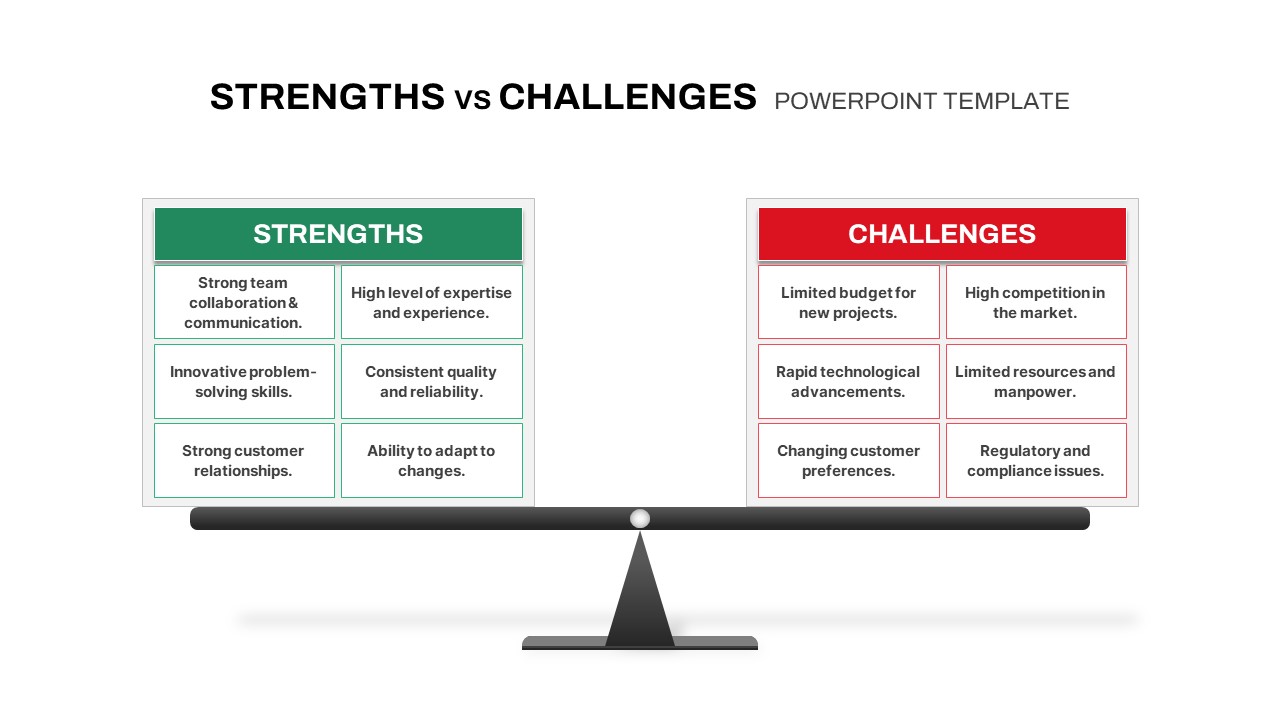
Strengths vs Challenges Weighing Scale Template for PowerPoint & Google Slides
Opportunities Challenges
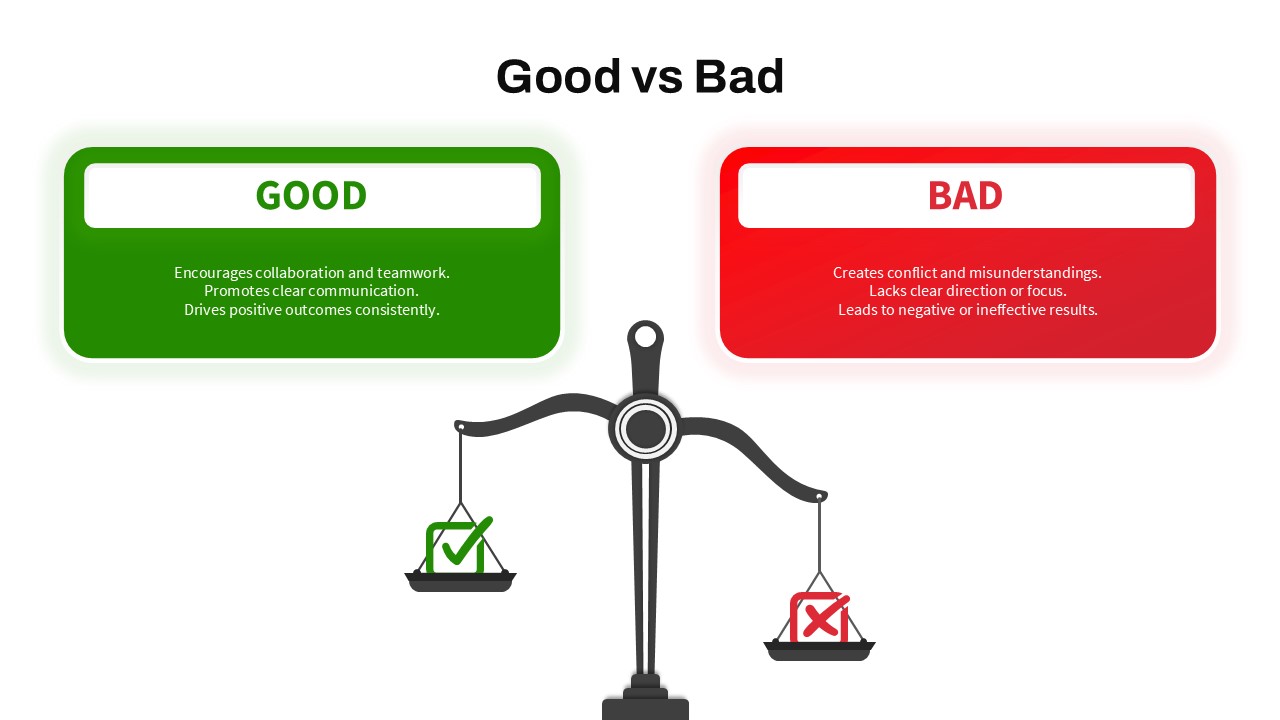
Good vs Bad Comparison with Scale Template for PowerPoint & Google Slides
Comparison
Five-Point Rating Scale Feedback Template for PowerPoint & Google Slides
Employee Performance
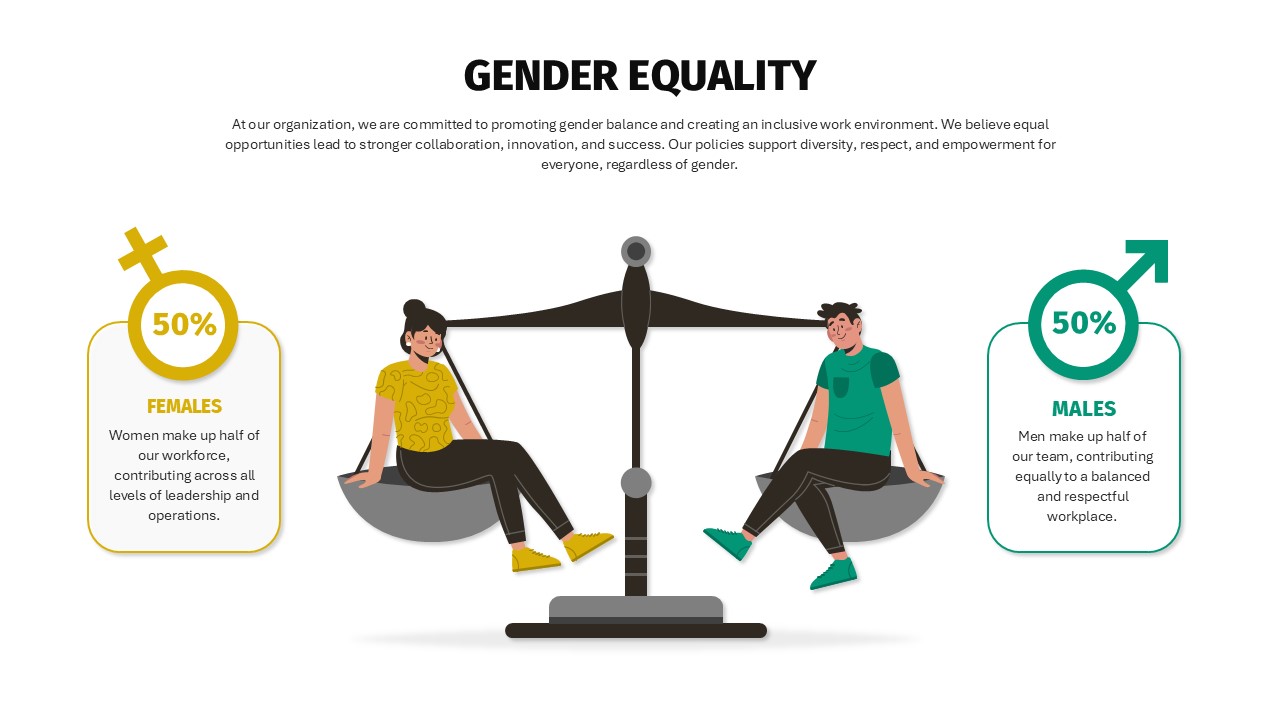
Balanced Gender Equality Scale Infographic Template for PowerPoint & Google Slides
Comparison
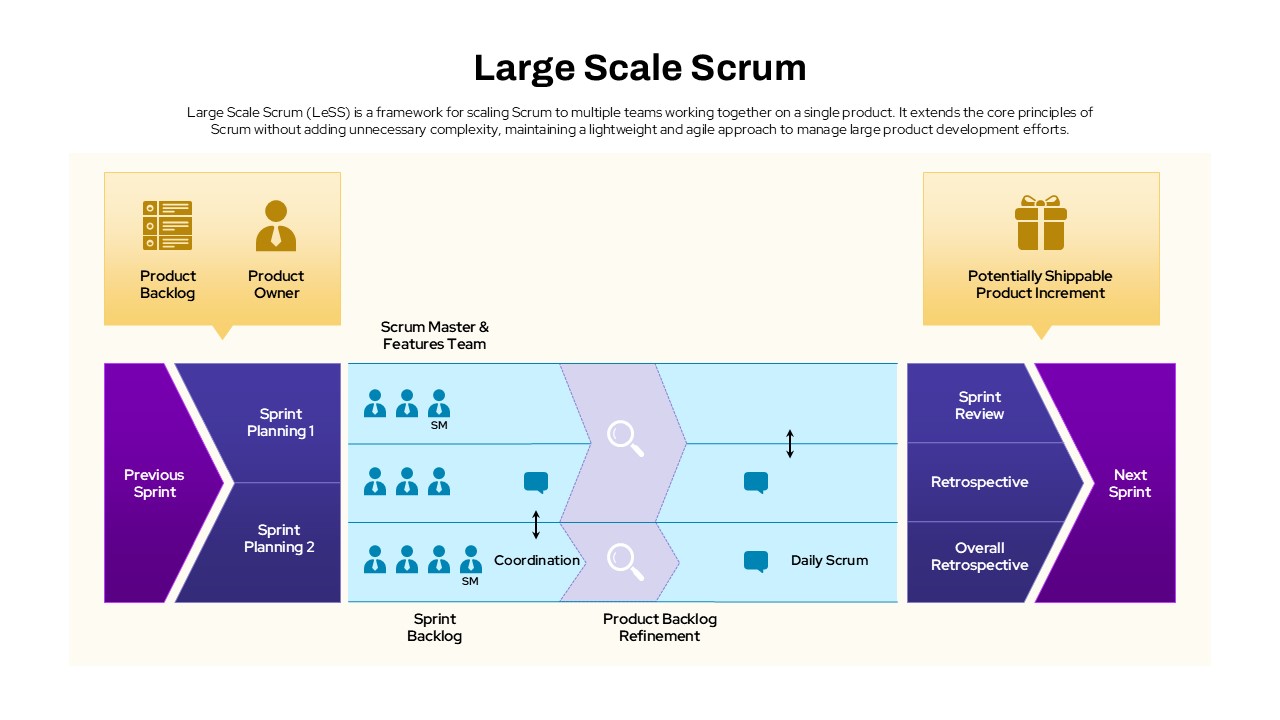
Large Scale Scrum Framework Process Template for PowerPoint & Google Slides
Scrum
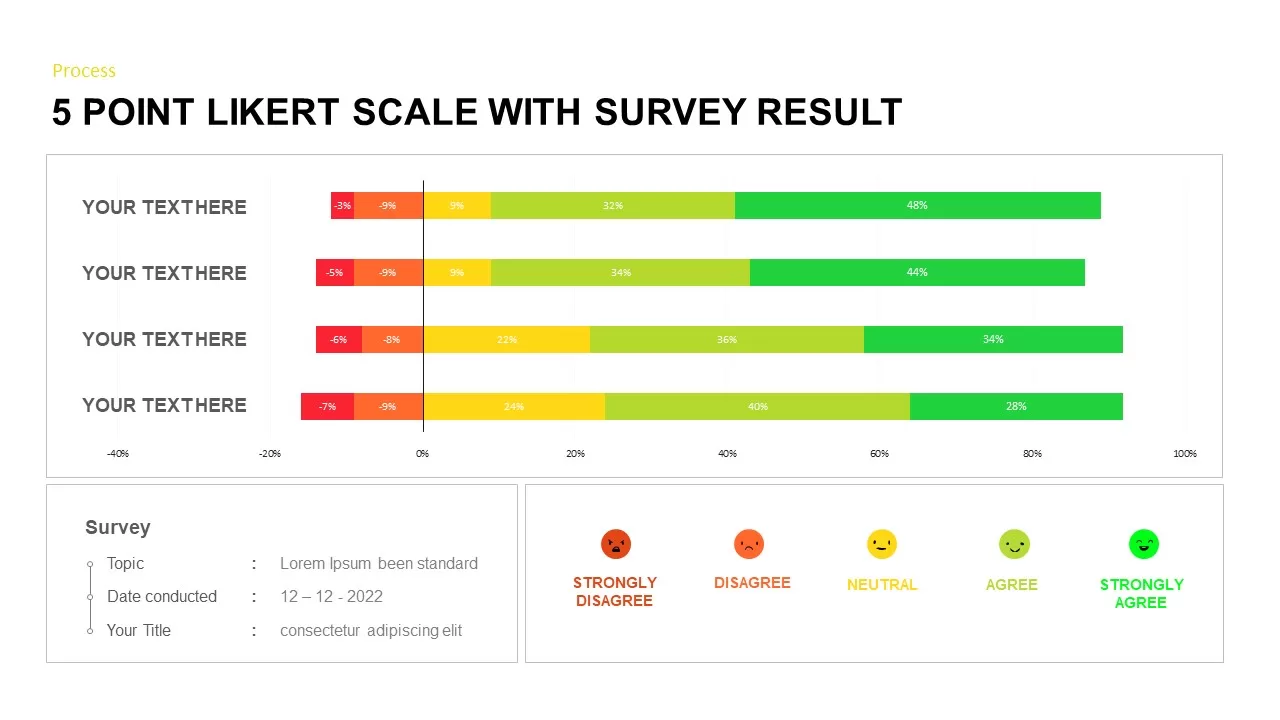
Likert Scale Survey Results infographic pack for PowerPoint & Google Slides
Business