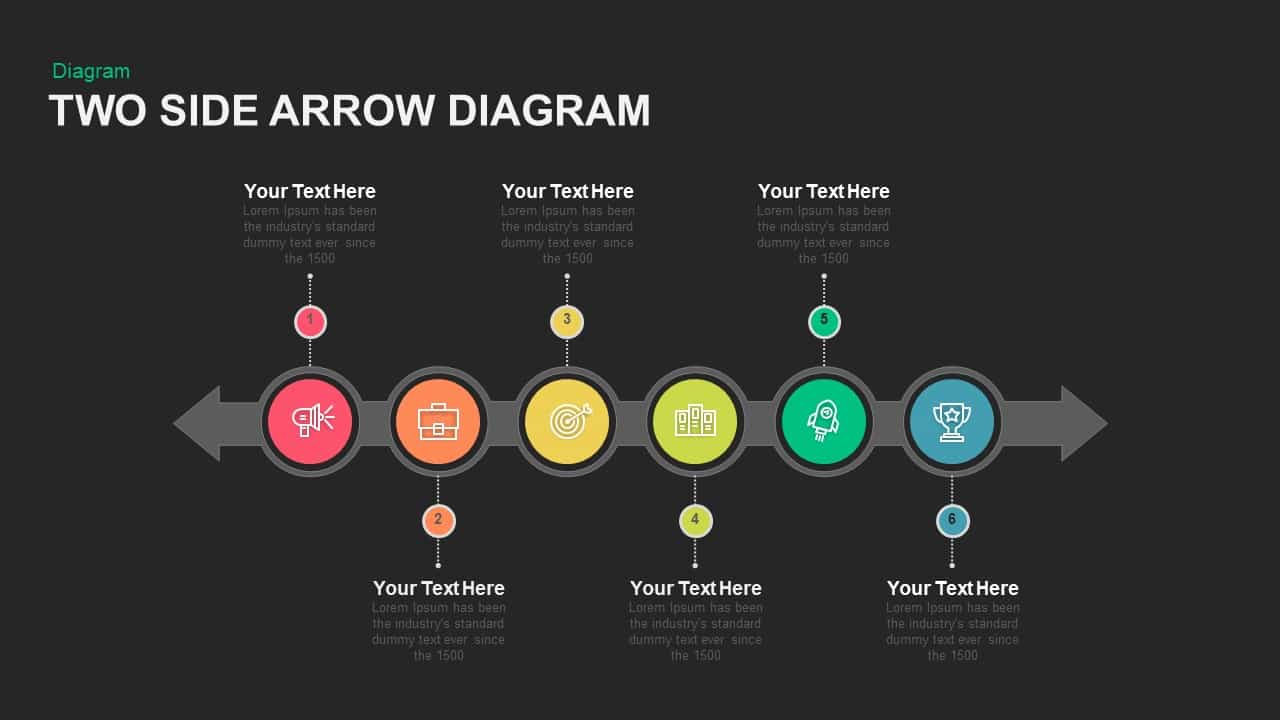
Two Side Arrow Diagram Powerpoint template

Use this Six-Step Two-Sided Arrow Diagram slide to depict linear workflows, process stages, or dual-directional sequences with clarity and visual appeal. The slide features a central horizontal bar with arrowheads at both ends and six evenly spaced circular markers, each containing a numbered line icon. Odd-numbered icons connect to text placeholders above the bar, while even-numbered icons link to placeholders below, enabling balanced annotation of key phases, objectives, or milestones in one glance.
Fully editable in PowerPoint and Google Slides, this template leverages vector shapes, master slide layouts, and snap-to-grid guides for rapid customization. Swap icons to match your content—marketing, strategy, documentation, launch, and achievement—and adjust marker colors to align with brand palettes. Master slide integration ensures consistency across uses, while aspect-ratio-locked vector objects maintain crisp, high-fidelity illustrations at any scale. The modern flat style employs clean typography, subtle drop shadows, and generous white space for a professional aesthetic that scales across devices without loss of fidelity.
Central arrowheads frame the process flow and emphasize directionality, making this diagram ideal for milestone-driven roadmaps, multi-phase project plans, software development sprints, or performance evaluation cycles. The modular layout also supports extension or reduction of steps by duplicating or hiding markers while preserving alignment guides. Whether you’re briefing stakeholders, training teams, or pitching to clients, this bi-directional arrow infographic simplifies complex sequences into a coherent narrative.
Who is it for
Project managers, business analysts, marketing teams, and process consultants will benefit from this diagram when presenting step-by-step workflows, project milestones, or strategic roadmaps.
Other Uses
Repurpose this layout for timeline presentations, software release plans, stakeholder reviews, training agendas, or performance assessment cycles to maintain visual consistency and engagement.
Login to download this file


