6 Step Flywheel Infographics Template

Description
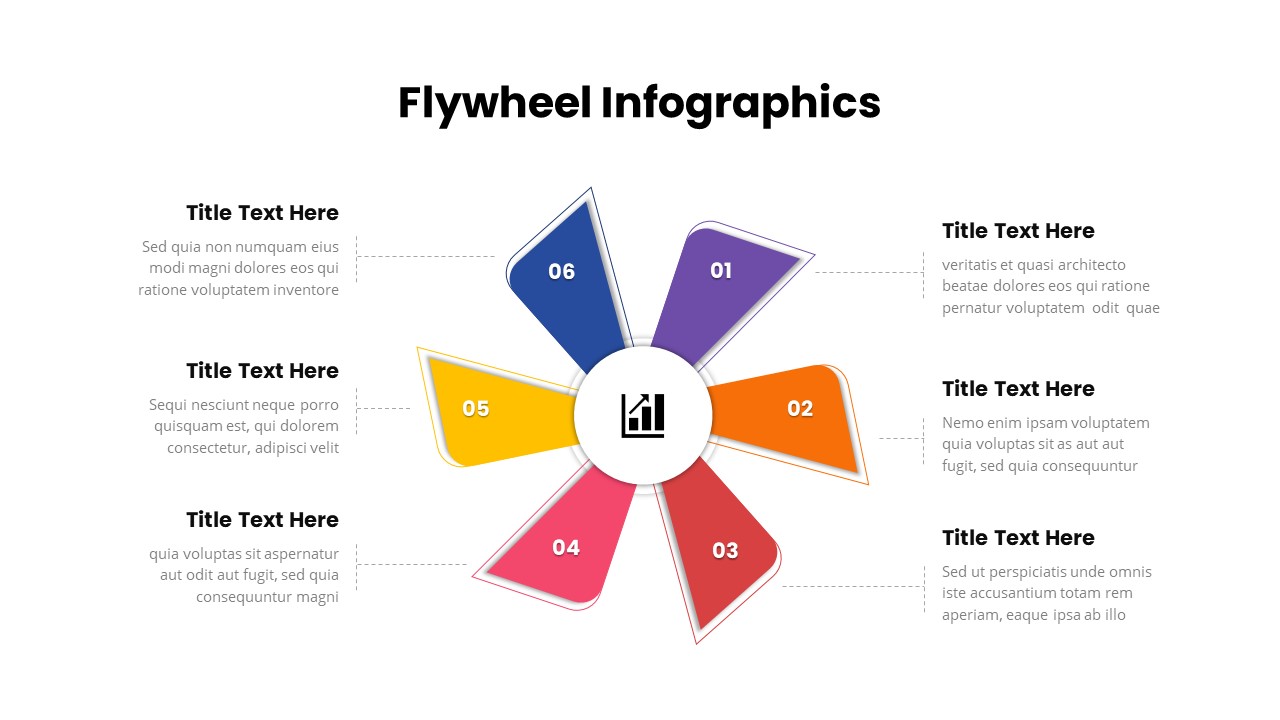
Use this six-step flywheel infographic slide to illustrate cyclical processes and growth strategies with maximum impact. The slide features a central circular hub with a metrics icon, surrounded by six angled petals arranged radially. Each petal has a distinct color—purple, orange, red, pink, yellow, and blue—and a numbered label, with dashed connectors leading to corresponding text blocks on either side. Fully editable vector shapes and master slide layouts ensure rapid customization: swap icons, adjust colors, reposition segments, or edit text placeholders without losing alignment. The design maintains a clean layout that adapts to any corporate identity.
The sleek flat design combined with subtle drop shadows and outline accents enhances readability and draws focus to individual stages. The radial flow reinforces the momentum-driven concept of a flywheel, highlighting how each phase contributes to continuous improvement and sustained performance. Platform-agnostic compatibility between PowerPoint and Google Slides guarantees consistent formatting and eliminates version-control issues.
Preconfigured animations and layer ordering facilitate step-by-step builds that guide audiences smoothly through each stage—ideal for stakeholder presentations, strategy workshops, and team briefings. Leverage the central icon to display key metrics or core values, while each petal can represent planning, execution, monitoring, optimization, evaluation, and scaling stages.
Whether you’re presenting marketing funnels, operational cycles, or performance reviews, this dynamic flywheel diagram offers versatility. Customize colors to align with your brand palette, or repurpose the layout for product development roadmaps, sales processes, or learning modules. By visualizing the interplay between phases and emphasizing cyclical momentum, this slide empowers presenters to convey complex workflows with clarity, drive engagement, and foster data-driven discussions.
Who is it for
Marketing directors, product managers, and business strategists will find this flywheel diagram invaluable for illustrating growth frameworks, process improvements, or performance metrics. Project managers, operations leaders, and team leads can leverage the radial layout to communicate iterative cycles and stakeholder workflows. Trainers and educators may also adopt it for teaching continuous improvement concepts or facilitating interactive workshop sessions.
Other Uses
Beyond illustrating business processes, use this slide for agile retrospectives, sales pipeline mapping, customer journey analysis, marketing funnel presentations, or performance review sessions. Expand or combine segments to depict product development roadmaps, compliance audits, or training modules, making it a versatile tool across departments and contexts.
Login to download this file


