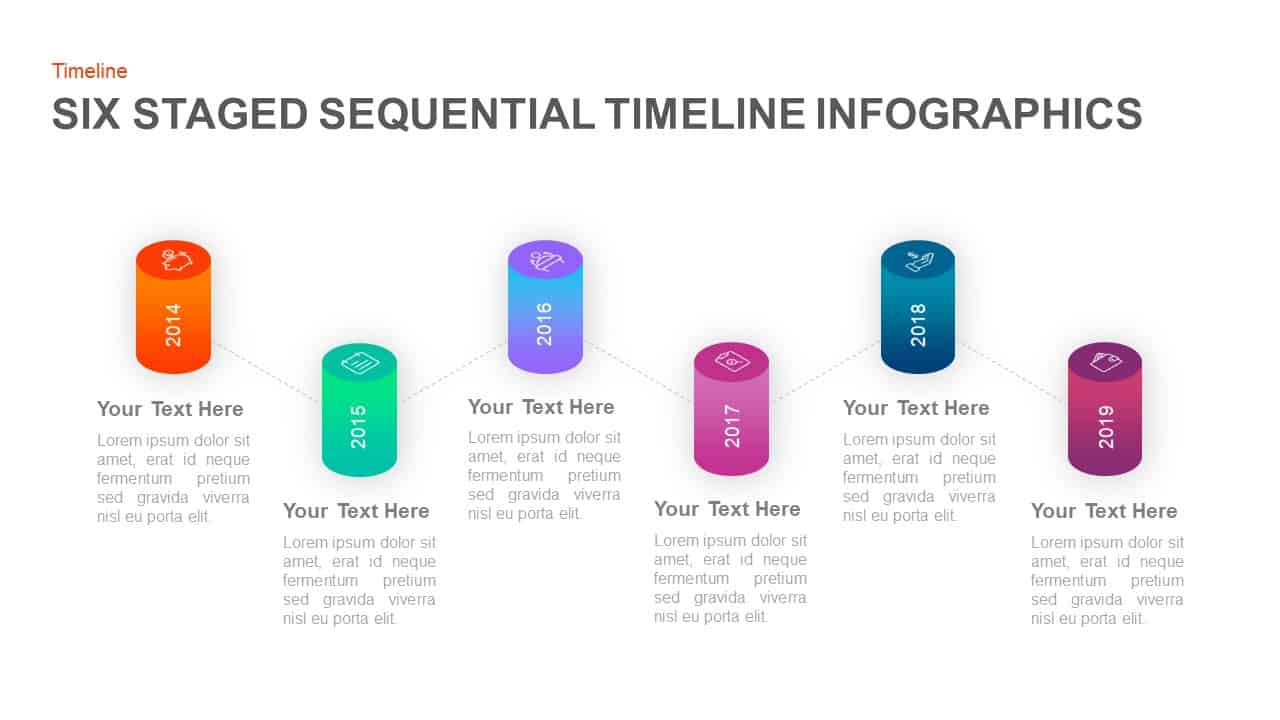
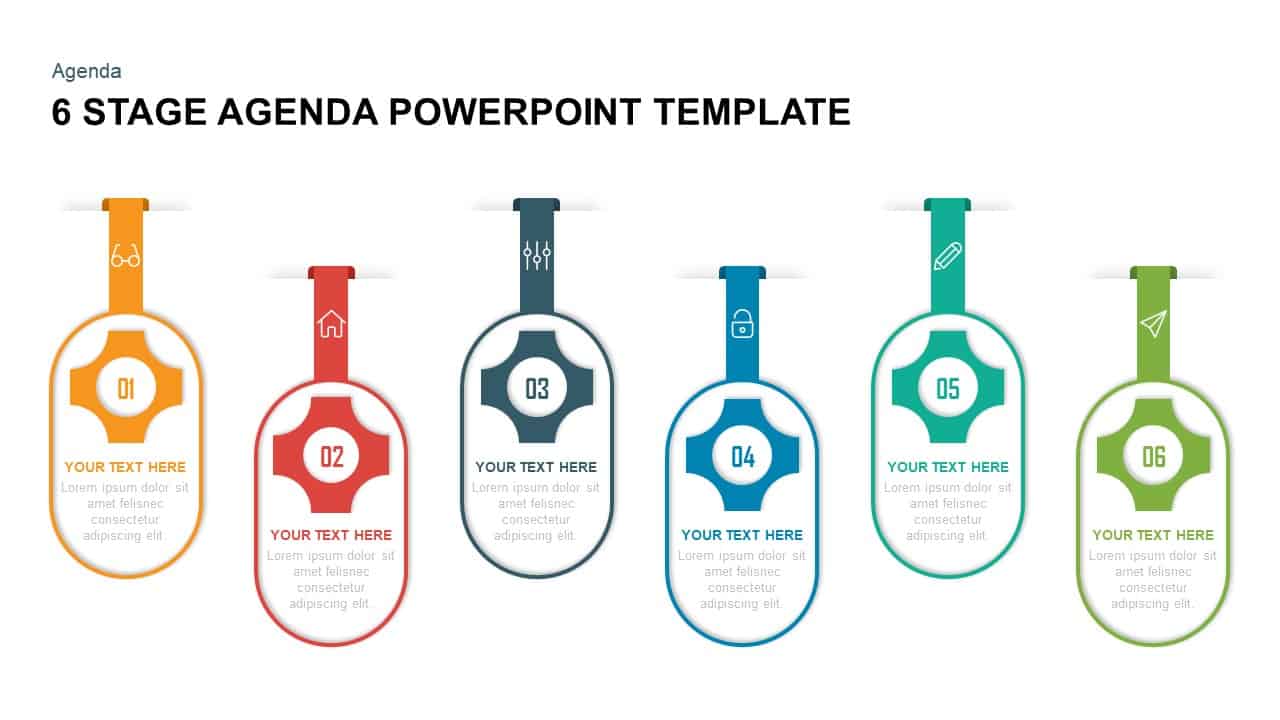
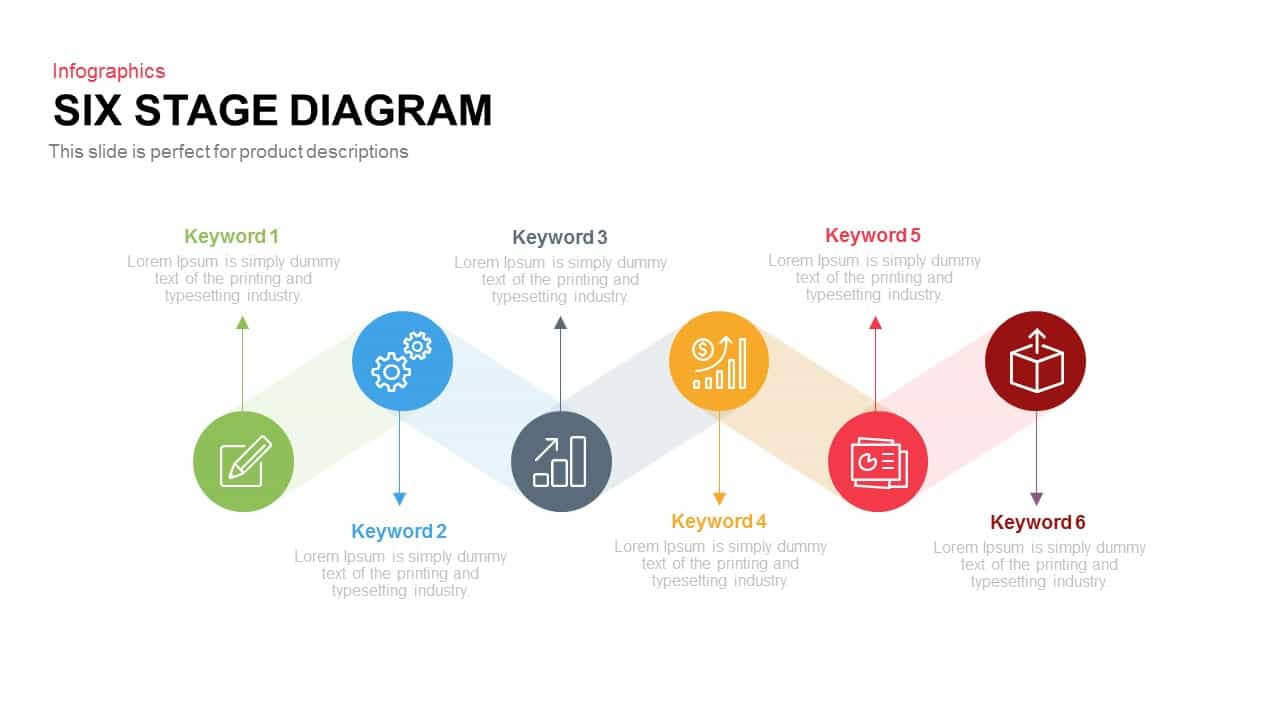
6 Stage Timeline Infographics template for PowerPoint & Google Slides
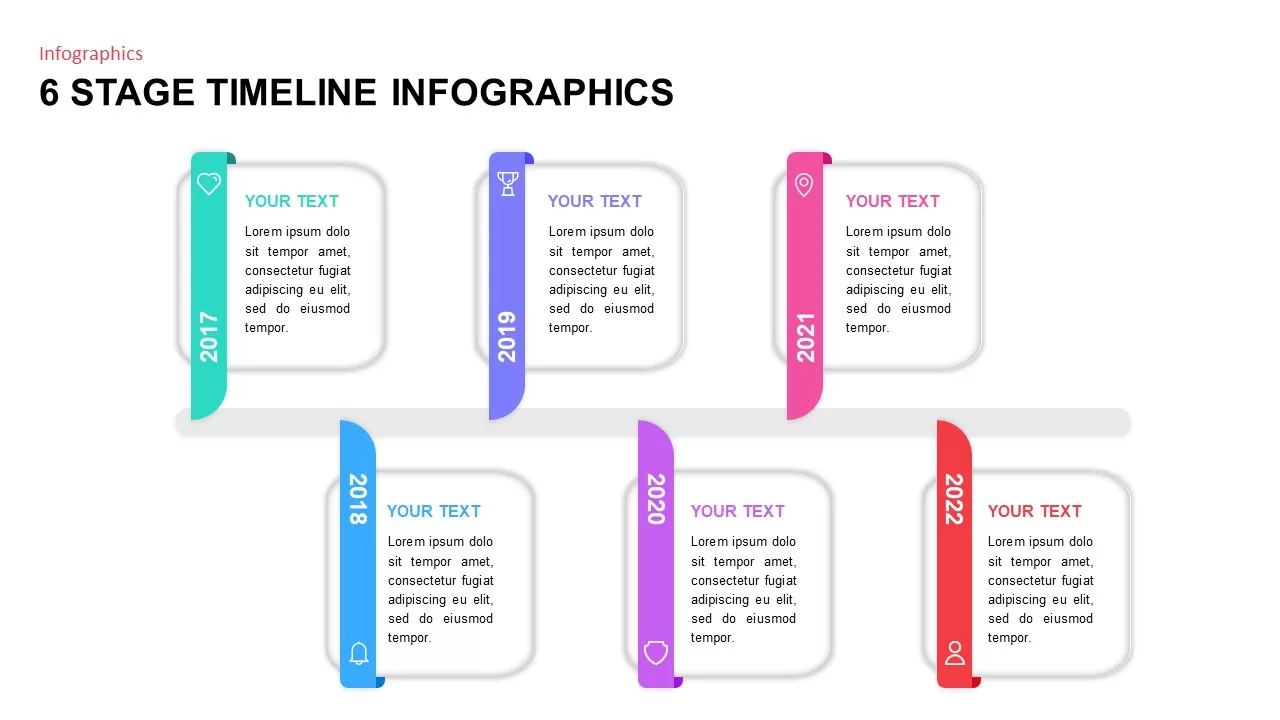
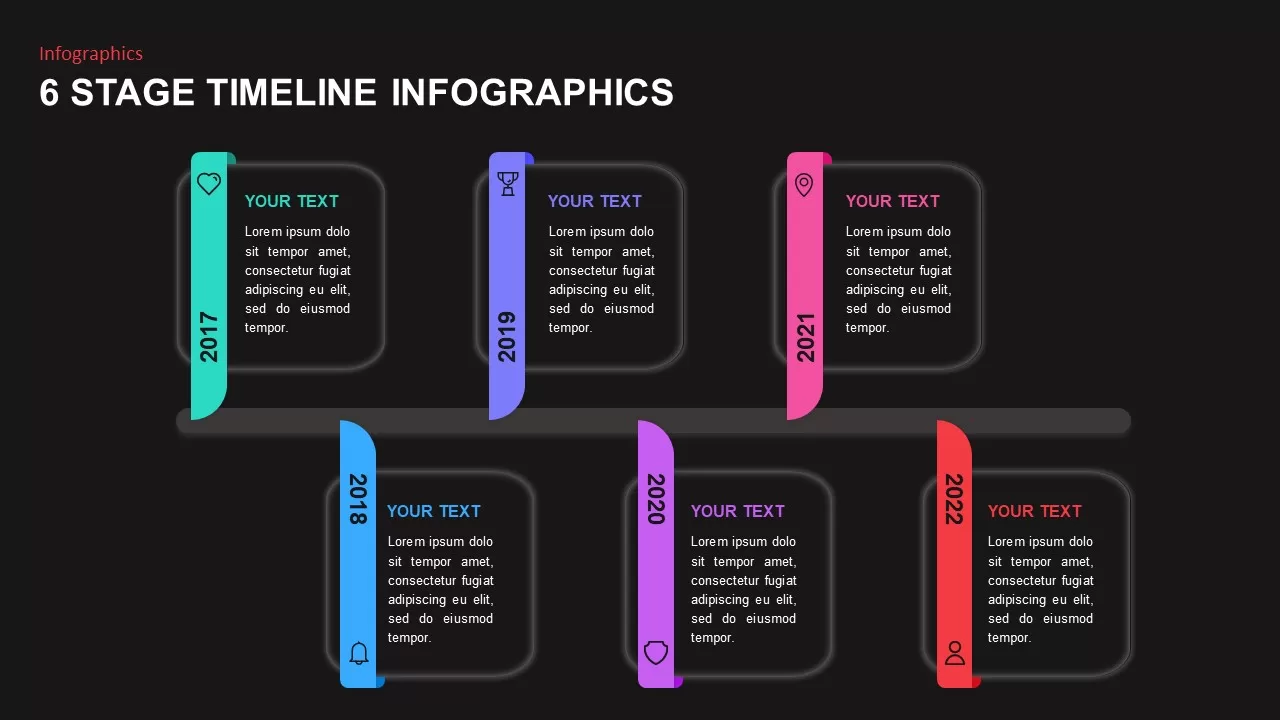
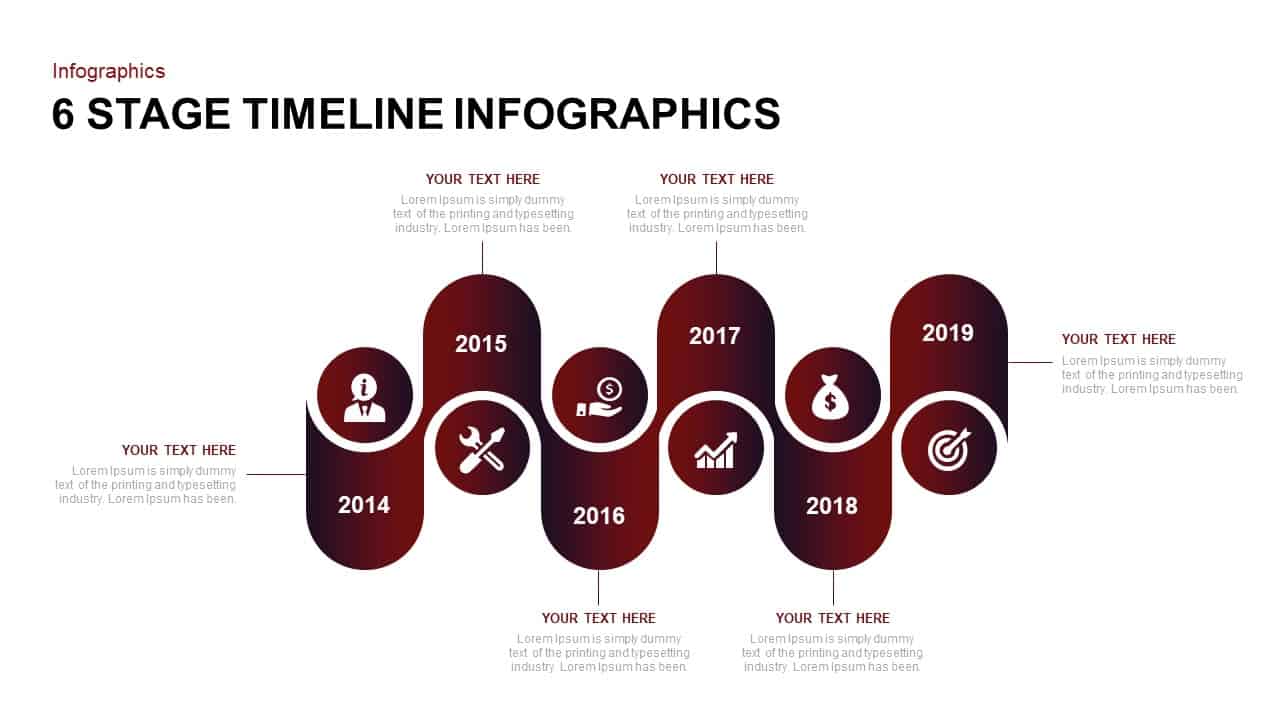
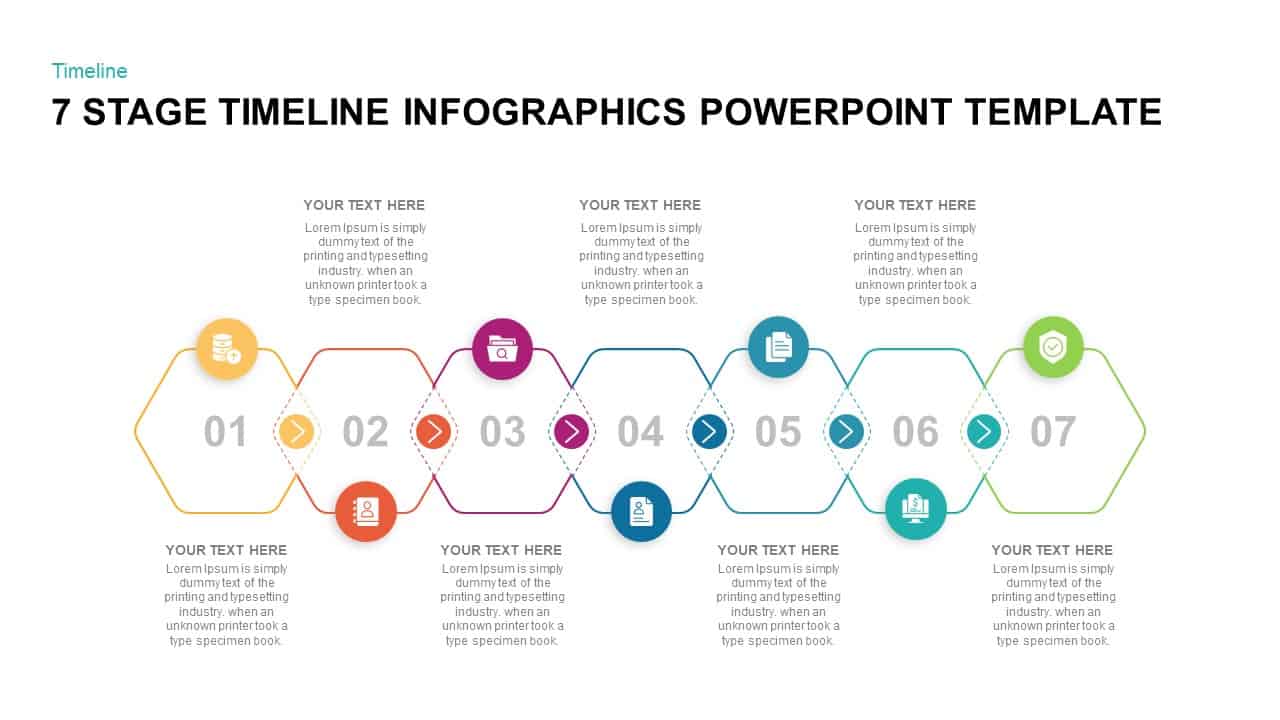
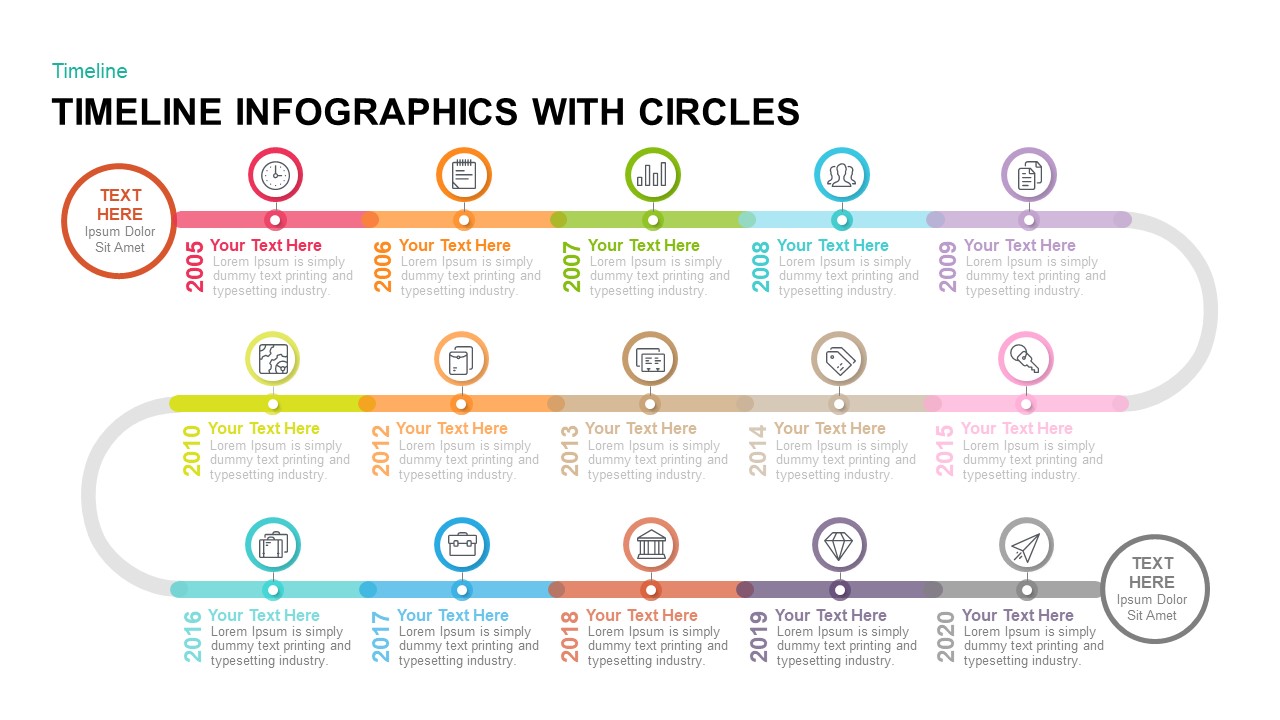
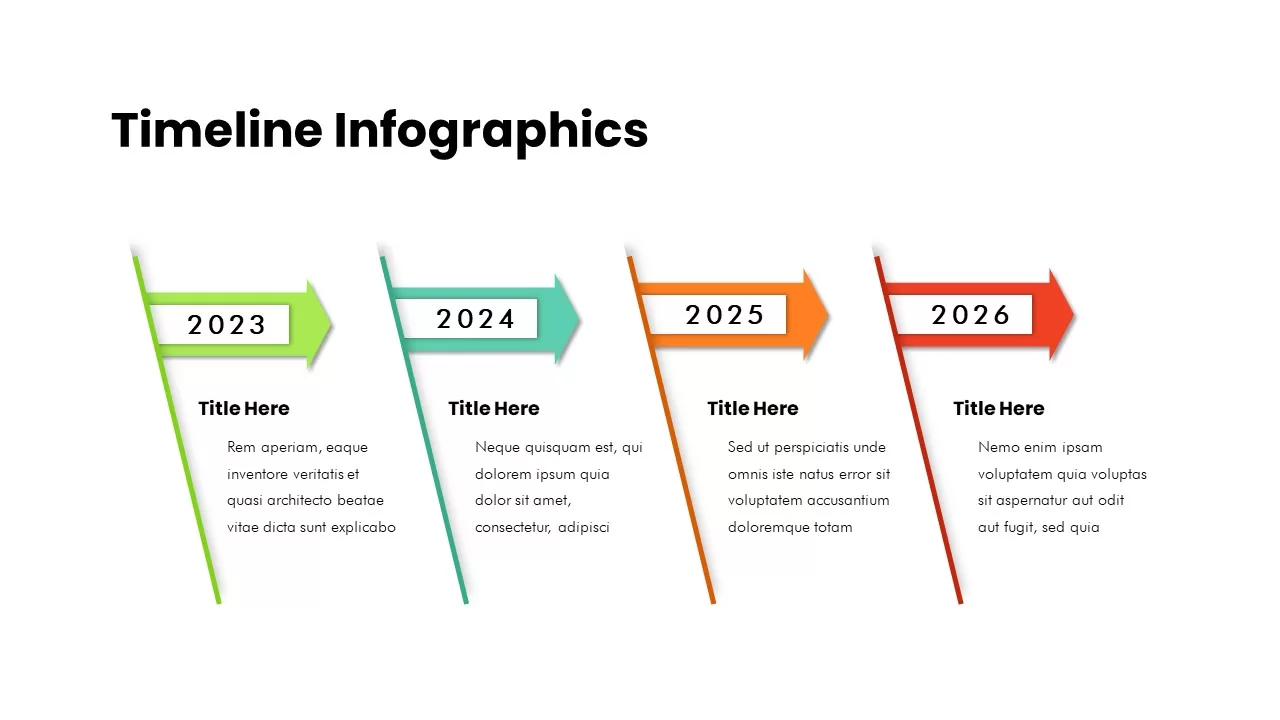
This 6-stage timeline infographic offers a clean and visually engaging way to showcase your project’s key milestones, objectives, or significant events over time. With each stage represented by a unique color, ranging from blue and purple to red and pink, this design allows for clear differentiation between different years and topics. The slide presents a horizontal flow, with icons and corresponding text boxes that make it easy to add and customize your own content.
Ideal for use in project overviews, business planning, and strategic development sessions, this timeline format ensures clarity and progression in visual storytelling. Whether presenting an annual report, a historical timeline, or a product lifecycle, the modern design helps audiences easily follow the sequence of events. The customizable text blocks allow for flexibility, while the intuitive layout ensures that your presentation remains organized and visually appealing.
With editable placeholders for each year and event, this infographic can be tailored to any industry or presentation style, making it a versatile asset for both PowerPoint and Google Slides. Present data efficiently and effectively, and impress your audience with a timeline that’s as engaging as it is informative.
Who is it for
This infographic is ideal for project managers, business strategists, and marketers who need to showcase the progression of projects or business strategies over time. It is also valuable for educators and consultants working on detailed reports or presentations that need to track milestones or progress.
Other Uses
In addition to project overviews, this timeline infographic can be used for planning product development, tracking key events in a business’s history, mapping out personal growth, or creating a detailed roadmap for a marketing campaign. It is also a great tool for team retrospectives or client presentations that require a clear, step-by-step layout.
Login to download this file

Item ID
SB02062
Related Templates

Multi-Stage Timeline Infographics Template for PowerPoint & Google Slides
Timeline
Five-Stage Arrow Infographics Timeline Template for PowerPoint & Google Slides
Arrow
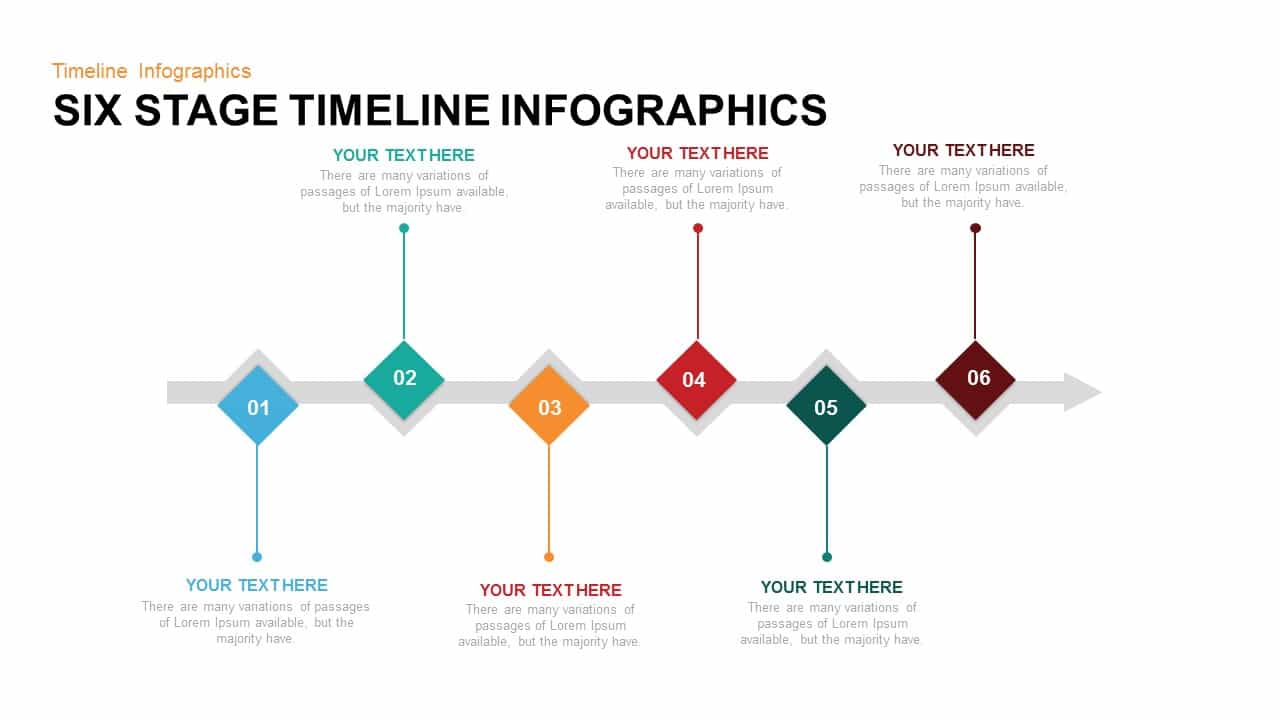
Six Stage Timeline Infographics Template for PowerPoint & Google Slides
Timeline

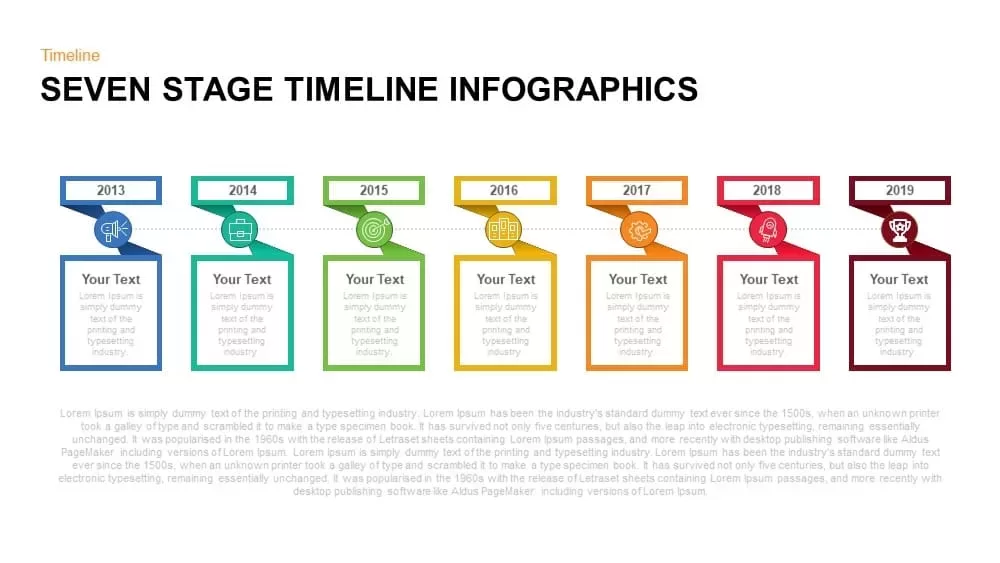
Seven-Stage Timeline Infographics Template for PowerPoint & Google Slides
Timeline
Six-Stage Timeline Infographics Slide Template for PowerPoint & Google Slides
Timeline
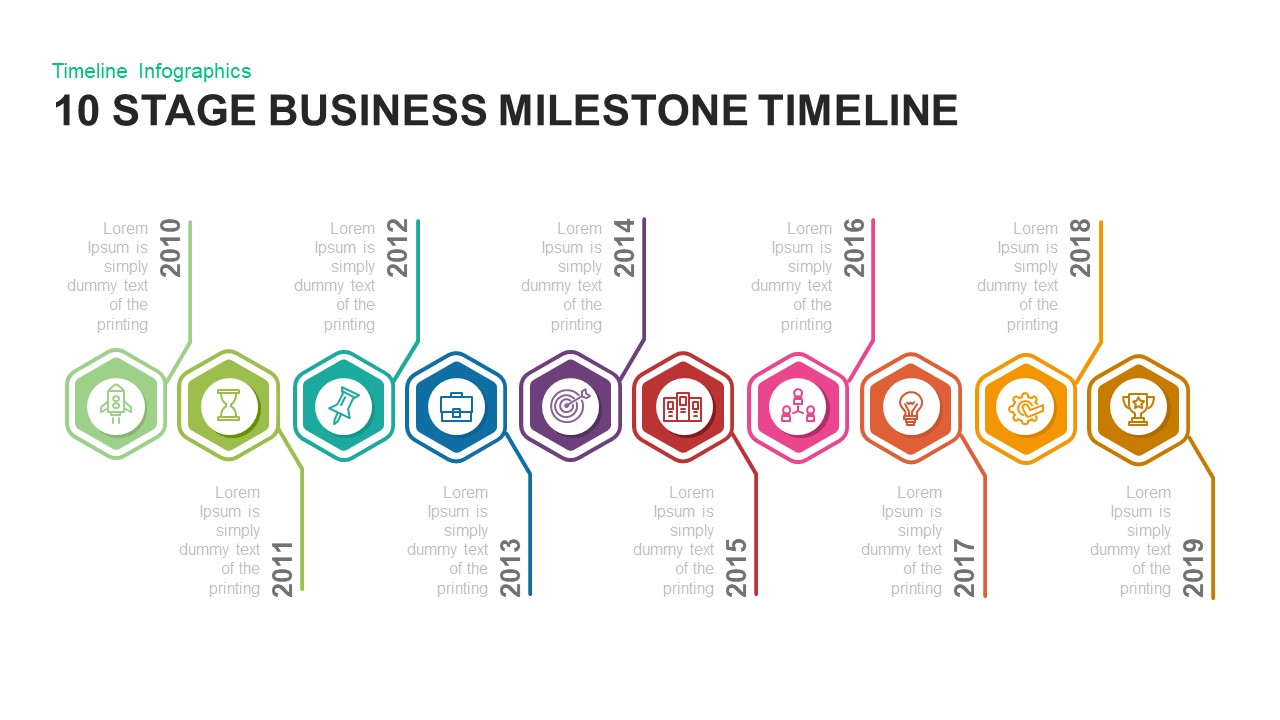
10 Stage Business Milestone Timeline PowerPoint Template for PowerPoint & Google Slides
Timeline
7-Stage Colorful Timeline Infographic Template for PowerPoint & Google Slides
Timeline
Three Four Five Stage Timeline Infographic Template for PowerPoint & Google Slides
Timeline
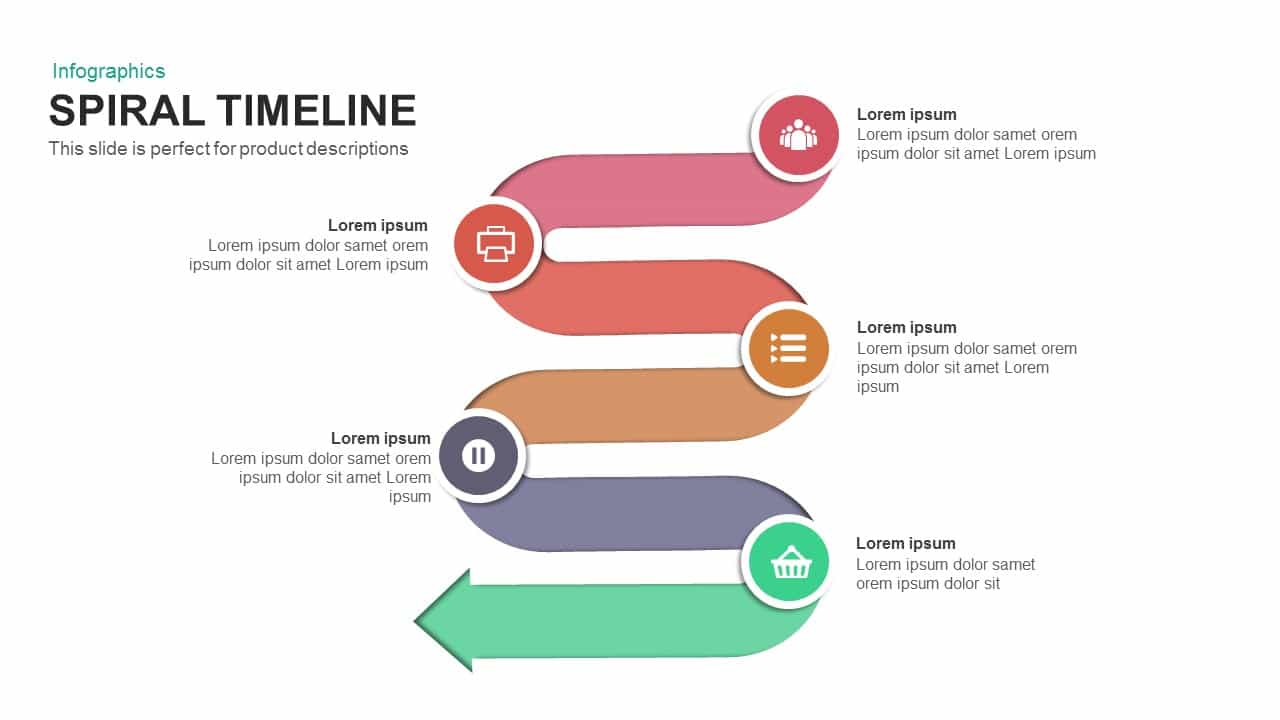
Six-Stage Colorful Spiral Timeline Template for PowerPoint & Google Slides
Timeline
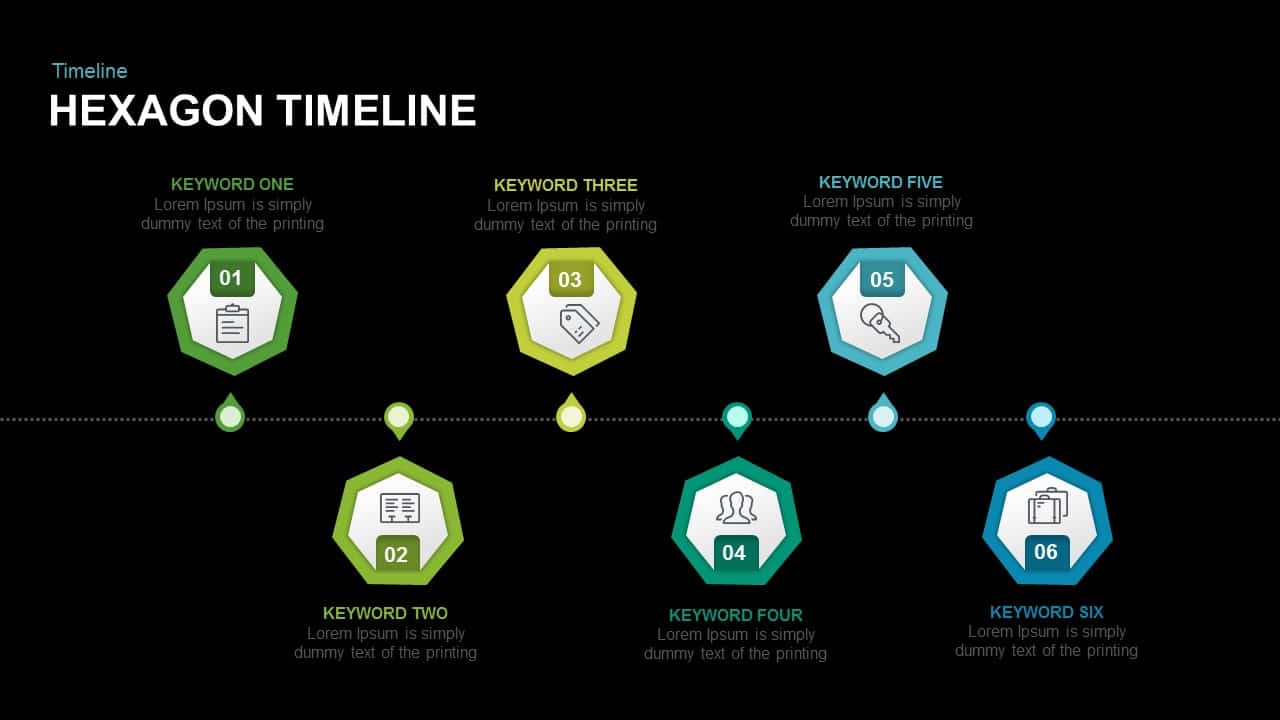
Six-Stage Hexagon Timeline Infographic Template for PowerPoint & Google Slides
Timeline

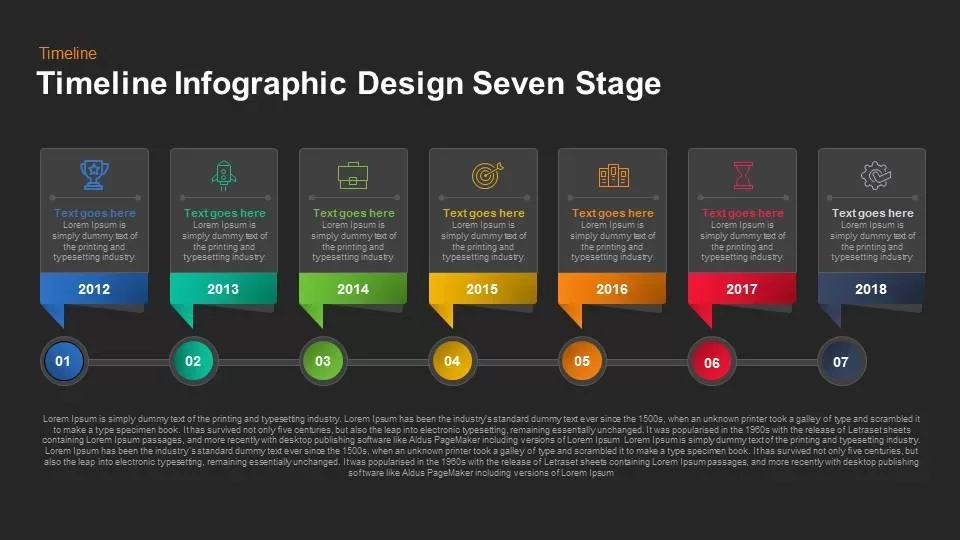
Timeline Infographic Design Seven Stage template for PowerPoint & Google Slides
Timeline
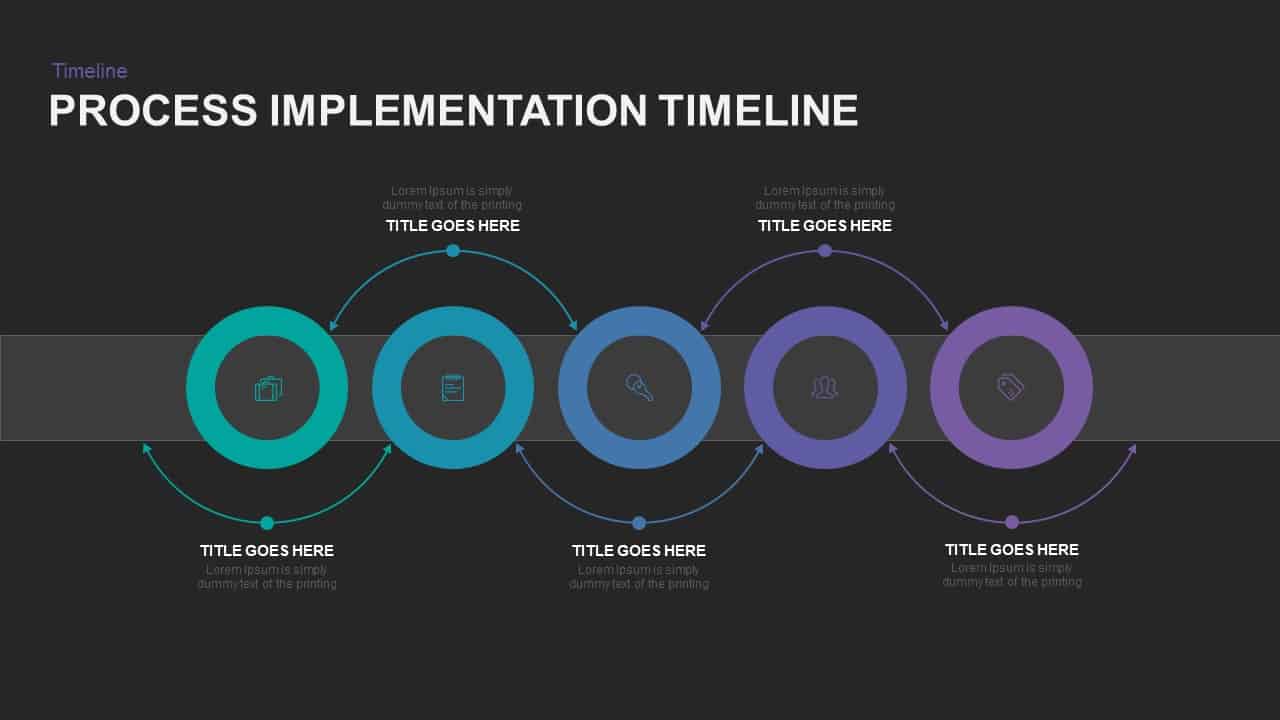
5-Stage Process Implementation Timeline Template for PowerPoint & Google Slides
Timeline
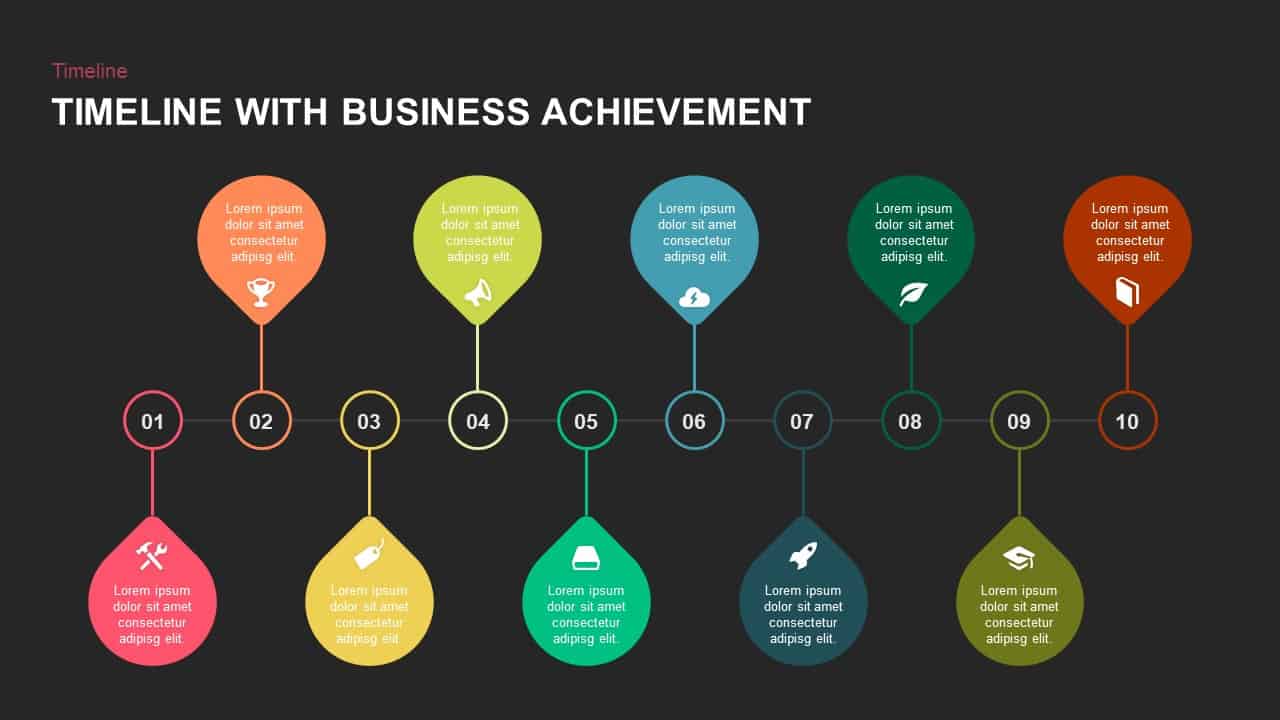
10-Stage Timeline with Business Achievements Template for PowerPoint & Google Slides
Timeline
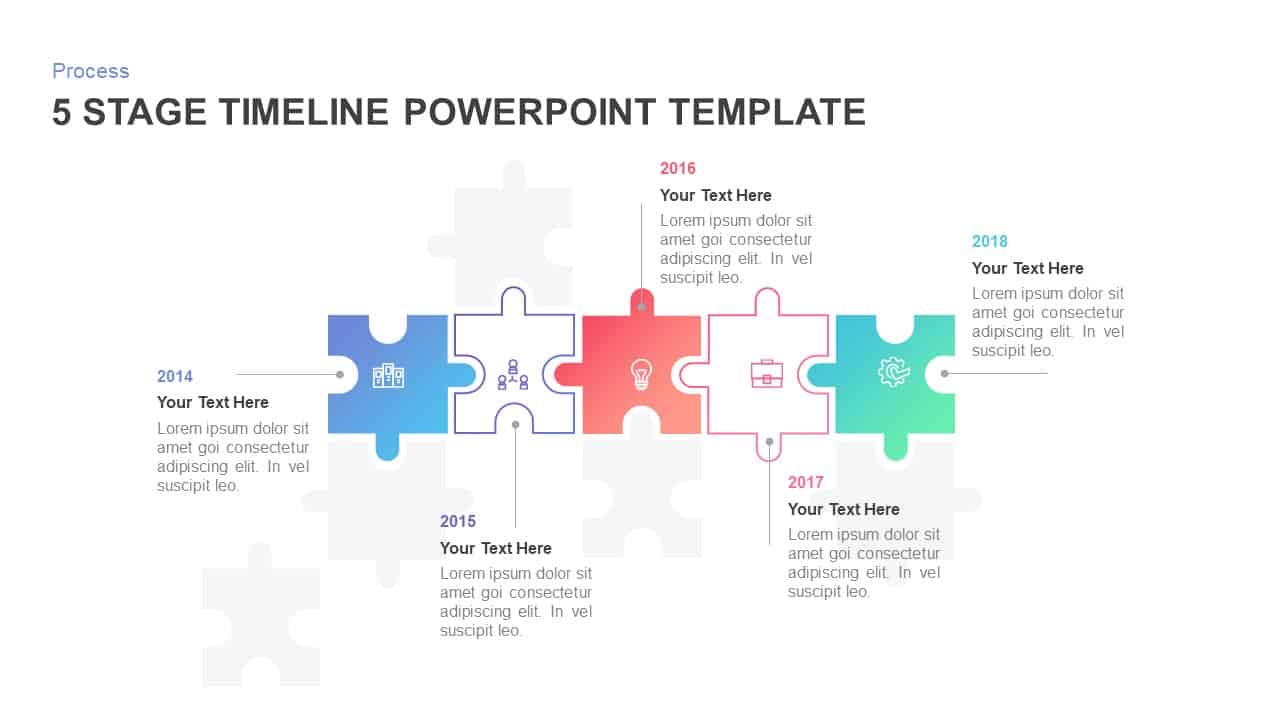
Animated 5-Stage Puzzle Timeline Infographic Template for PowerPoint & Google Slides
Timeline
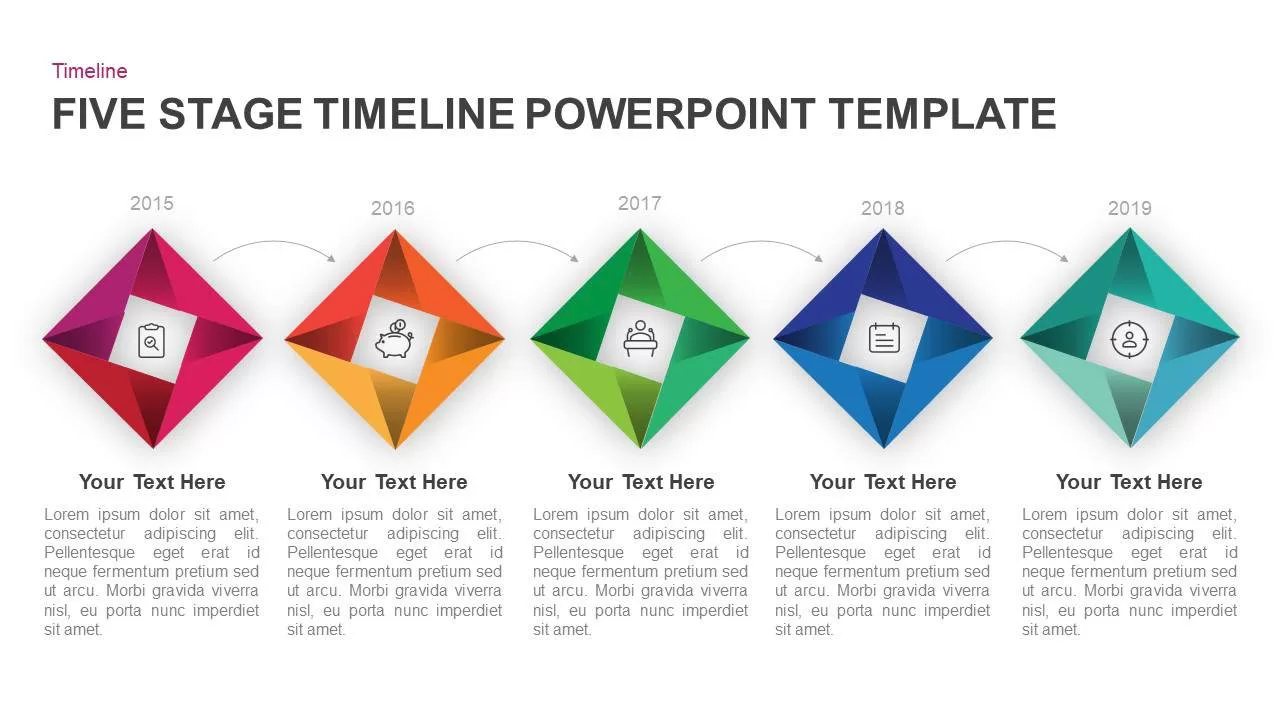
Five-Stage Diamond Timeline Chart Template for PowerPoint & Google Slides
Timeline
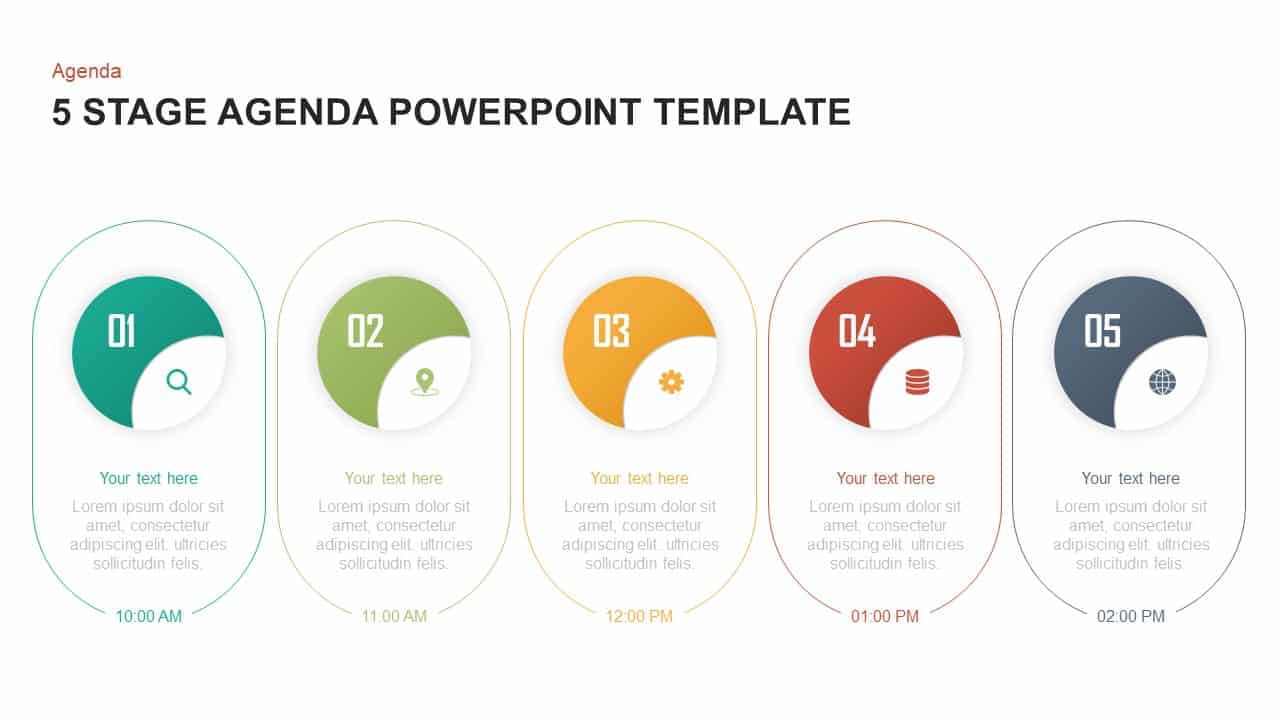
5 Stage Agenda Timeline Carousel Template for PowerPoint & Google Slides
Agenda
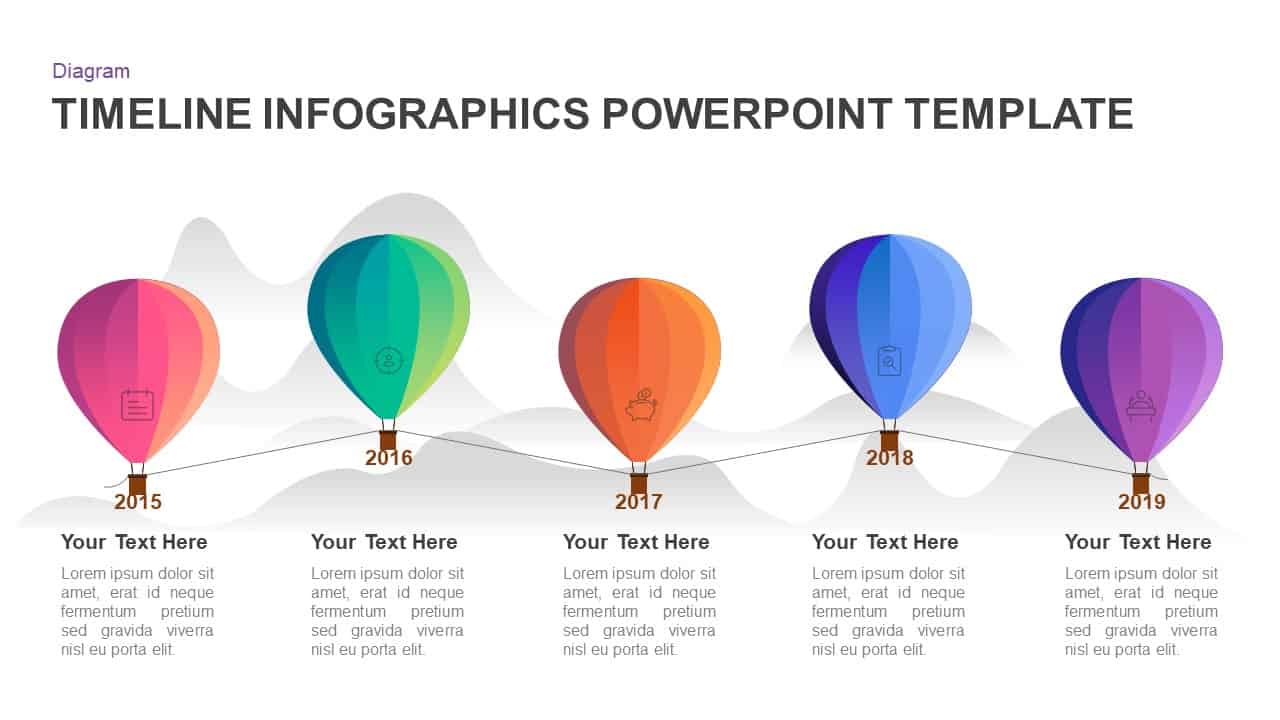
5-Stage Hot-Air Balloon Timeline Template for PowerPoint & Google Slides
Timeline
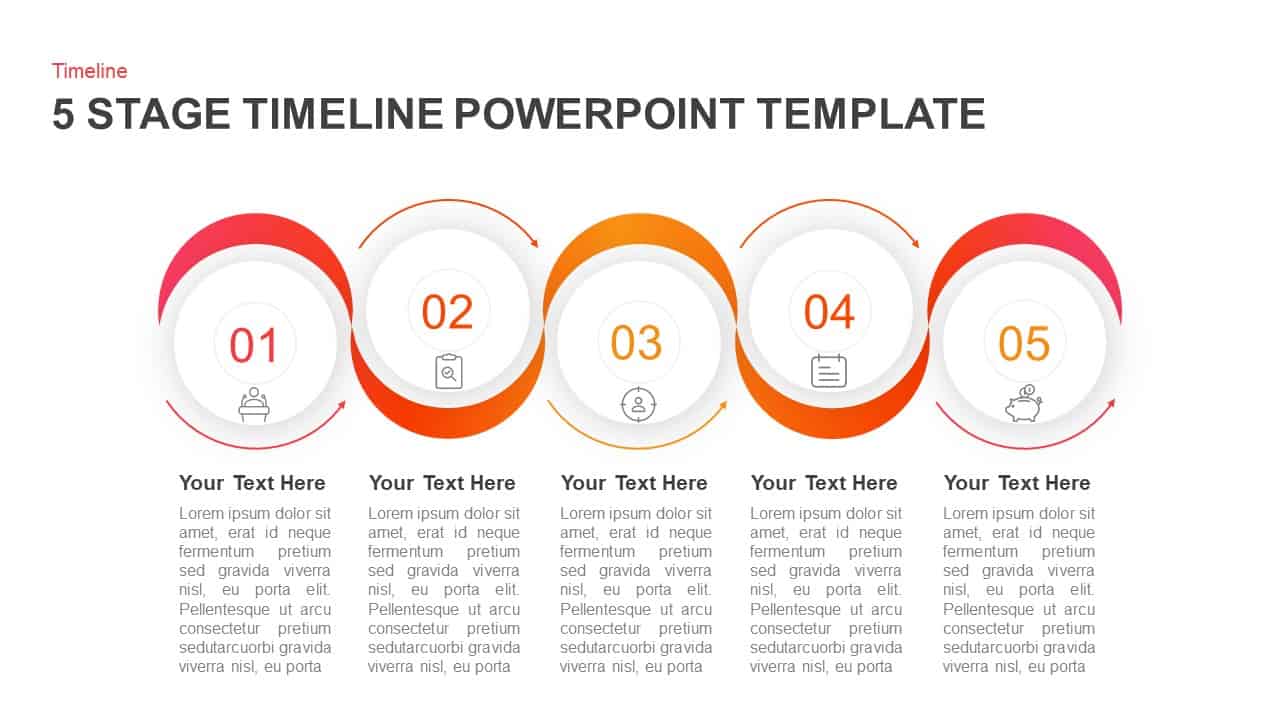
5 Stage Circular Timeline Infographic Template for PowerPoint & Google Slides
Timeline
Six-Stage Arrow Timeline Diagram Template for PowerPoint & Google Slides
Timeline
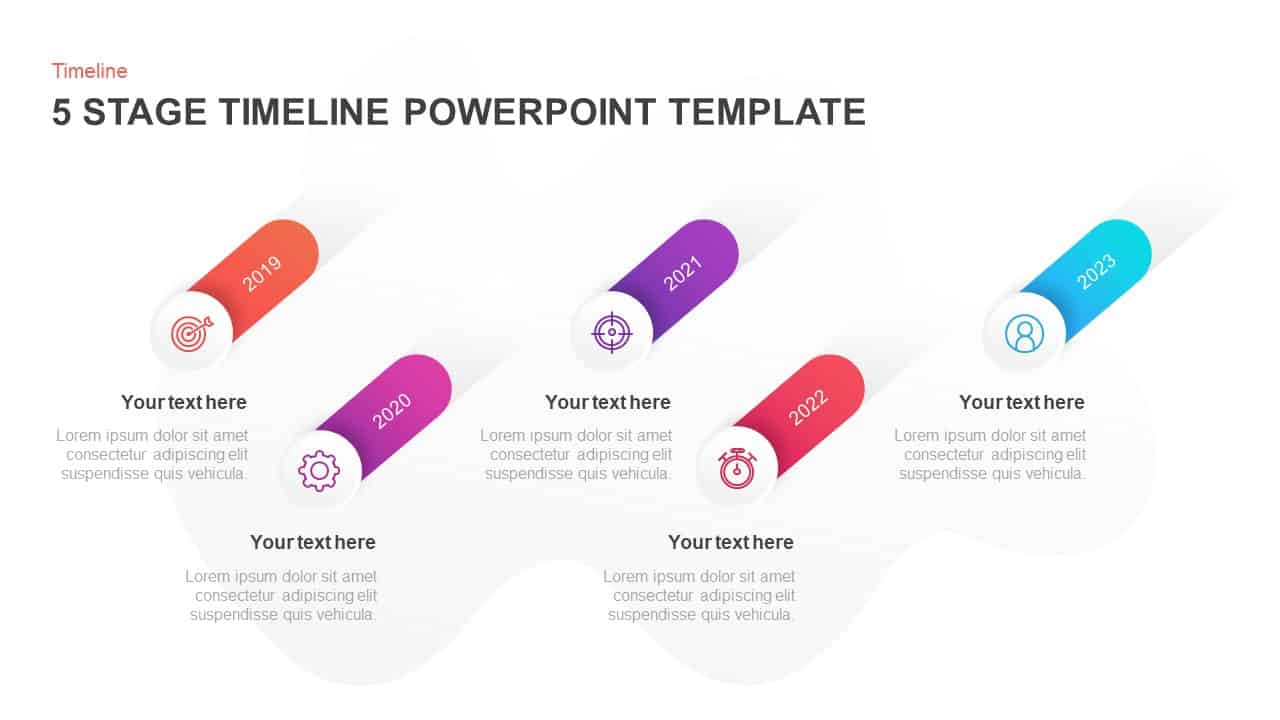
Five-Stage Slanted Timeline Diagram Template for PowerPoint & Google Slides
Timeline
Six-Stage Timeline Infographic Template for PowerPoint & Google Slides
Timeline
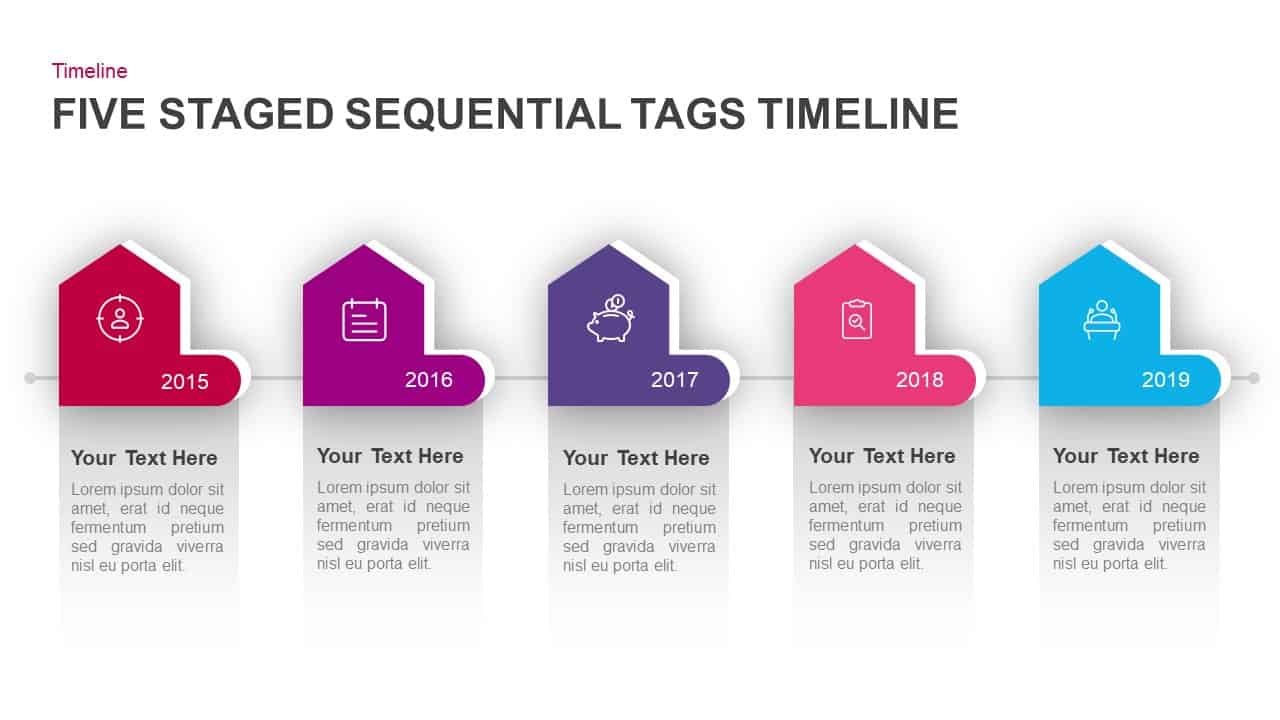
Five-Stage Sequential Tags Timeline Template for PowerPoint & Google Slides
Timeline
Six Stage Agenda Timeline Diagram template for PowerPoint & Google Slides
Agenda
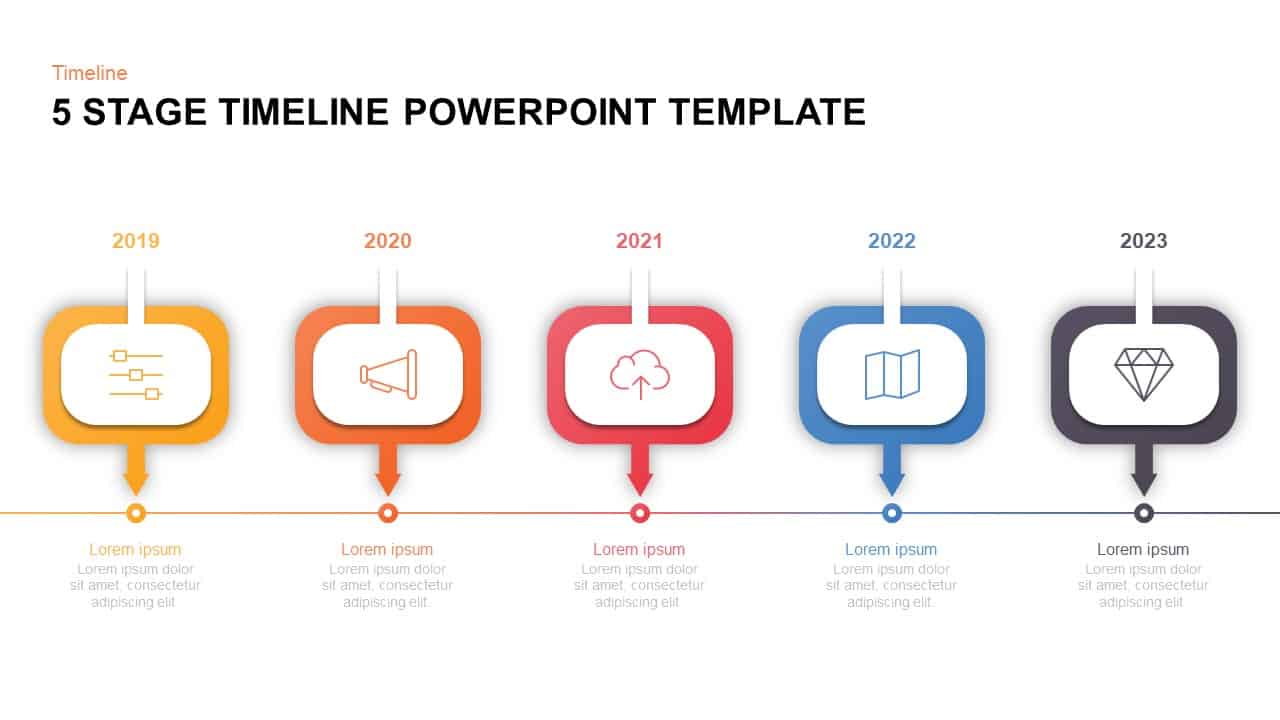
5 Stage Timeline Infographic Slide Template for PowerPoint & Google Slides
Timeline
5-Stage Financial Growth Timeline Template for PowerPoint & Google Slides
Timeline
5-Stage Timeline Infographic Slide Template for PowerPoint & Google Slides
Timeline
Seven-Stage Hexagon Timeline Infographic Template for PowerPoint & Google Slides
Timeline
Six-Stage Road Map Infographic Timeline Template for PowerPoint & Google Slides
Roadmap
Clock-Timeline Nine-Stage Agenda Template for PowerPoint & Google Slides
Agenda
Colorful Five-Stage Education Timeline Template for PowerPoint & Google Slides
Timeline
Free Multicolor Five-Stage Milestone Timeline Template for PowerPoint & Google Slides
Timeline
Free
Six Stage Timeline Diagram for PowerPoint & Google Slides
Timeline
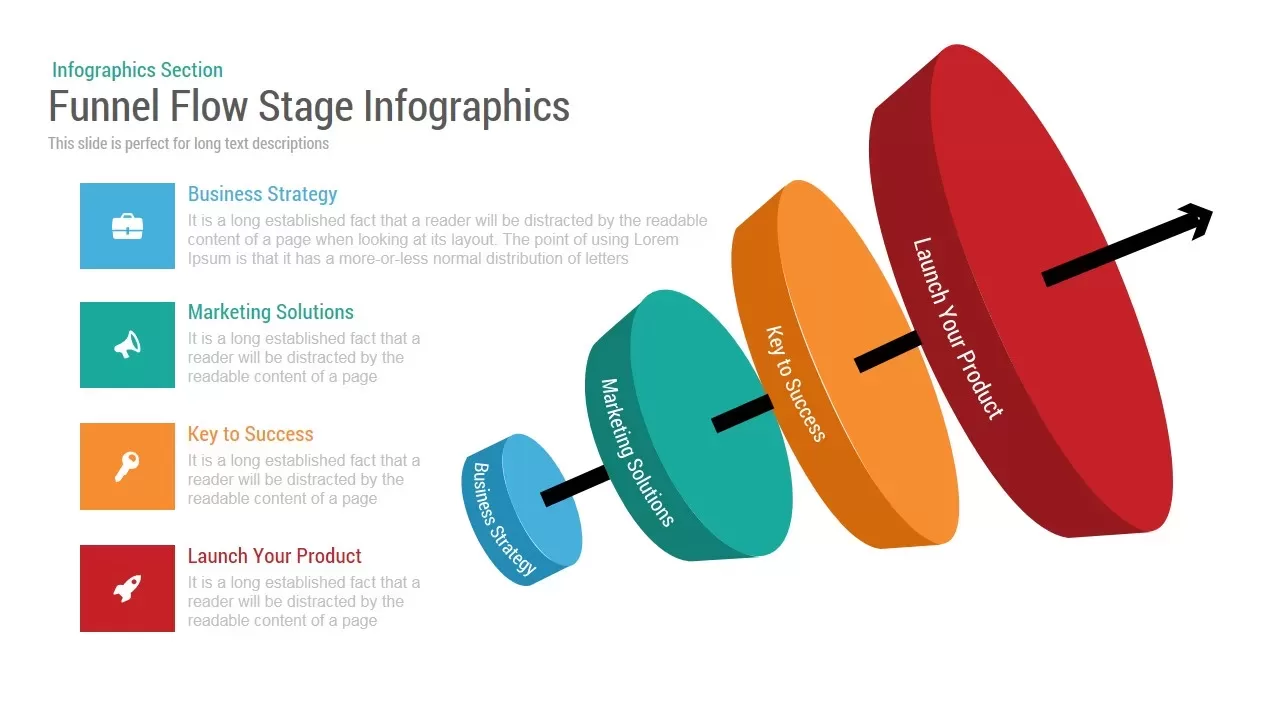
Funnel Flow Stage Infographics template for PowerPoint & Google Slides
Funnel
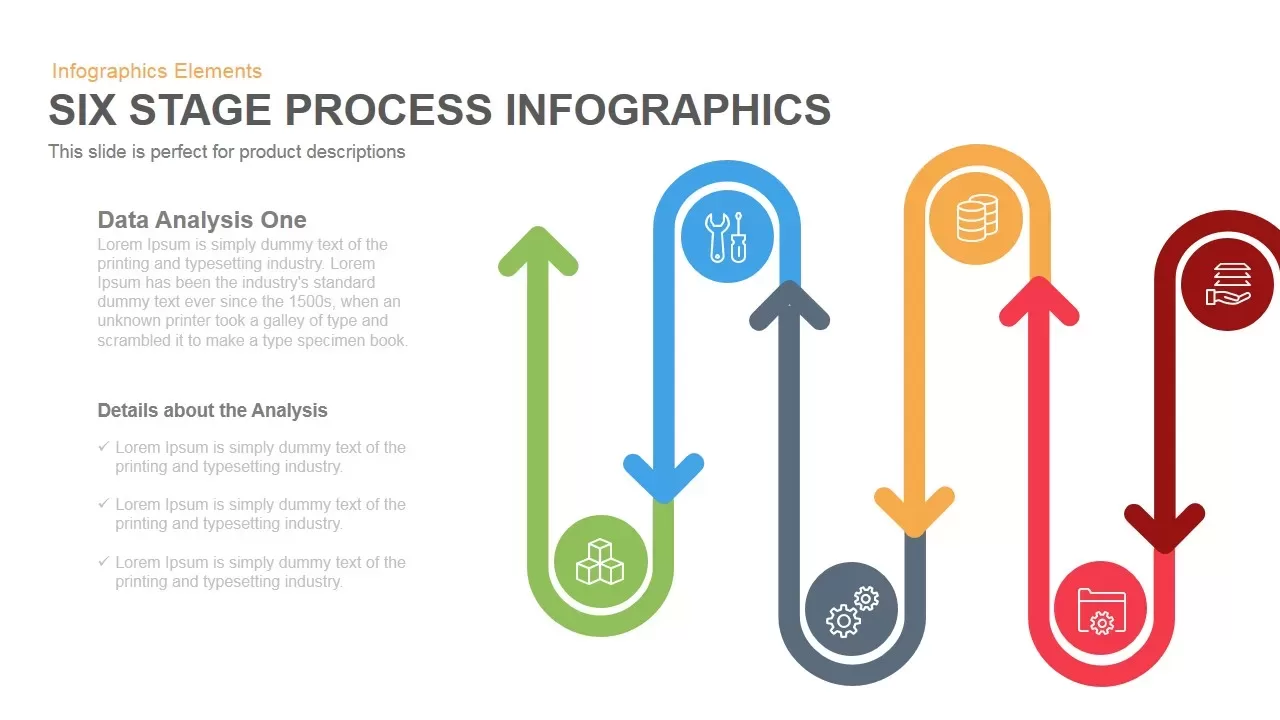
Six-Stage Process Infographics Template for PowerPoint & Google Slides
Process
5-Stage Arrow Infographics Process Flow Template for PowerPoint & Google Slides
Arrow
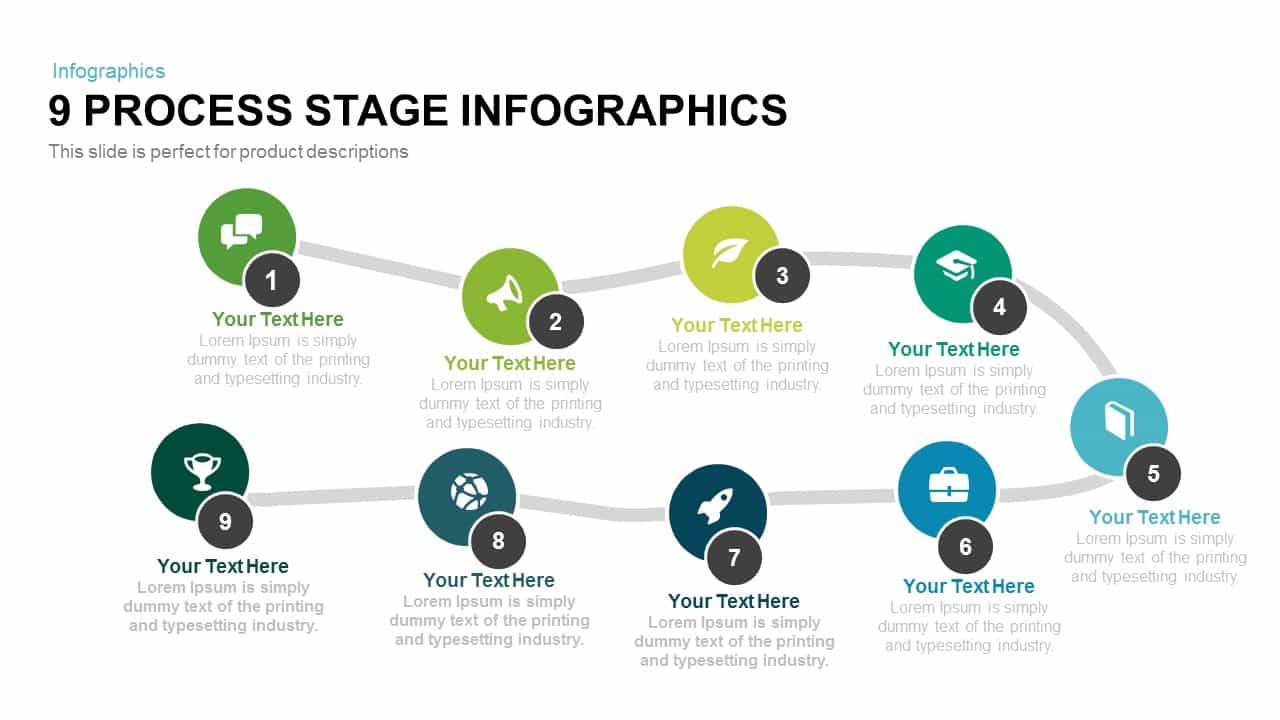
9 Process Stage Infographics template for PowerPoint & Google Slides
Process
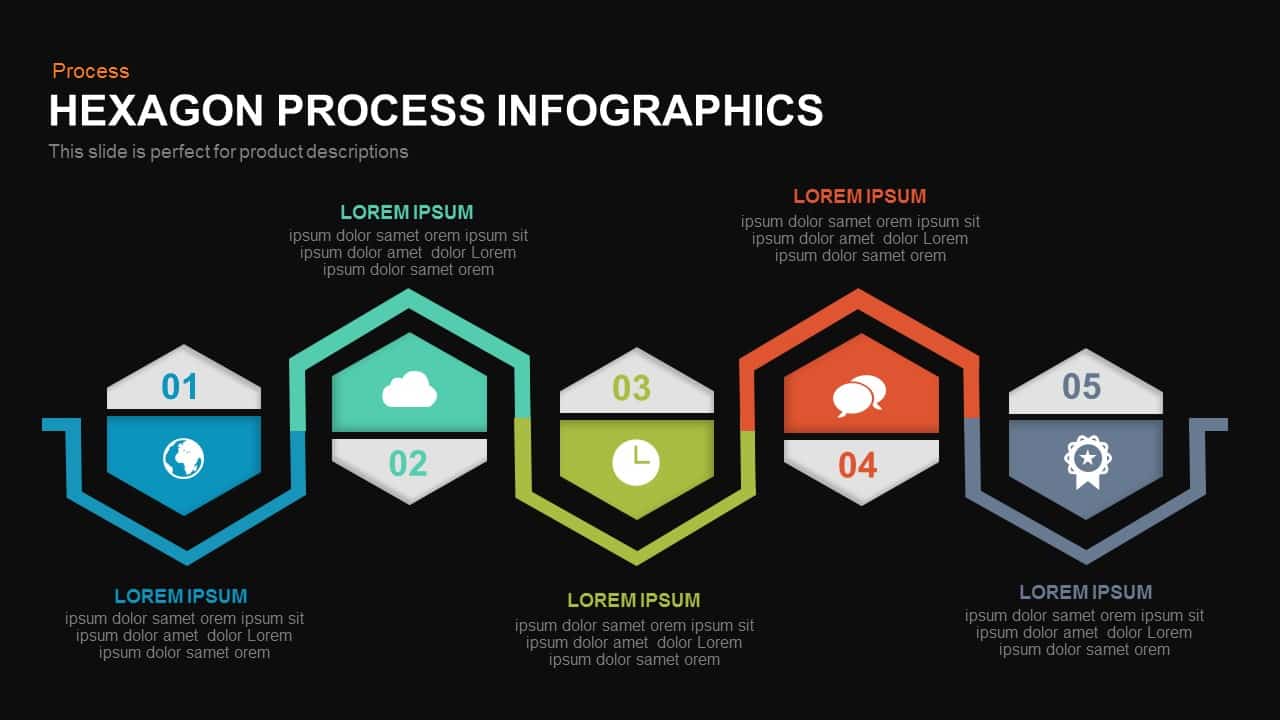
Five-Stage Hexagon Process Infographics template for PowerPoint & Google Slides
Process
Five-Stage Pyramid Infographics Diagram Template for PowerPoint & Google Slides
Pyramid
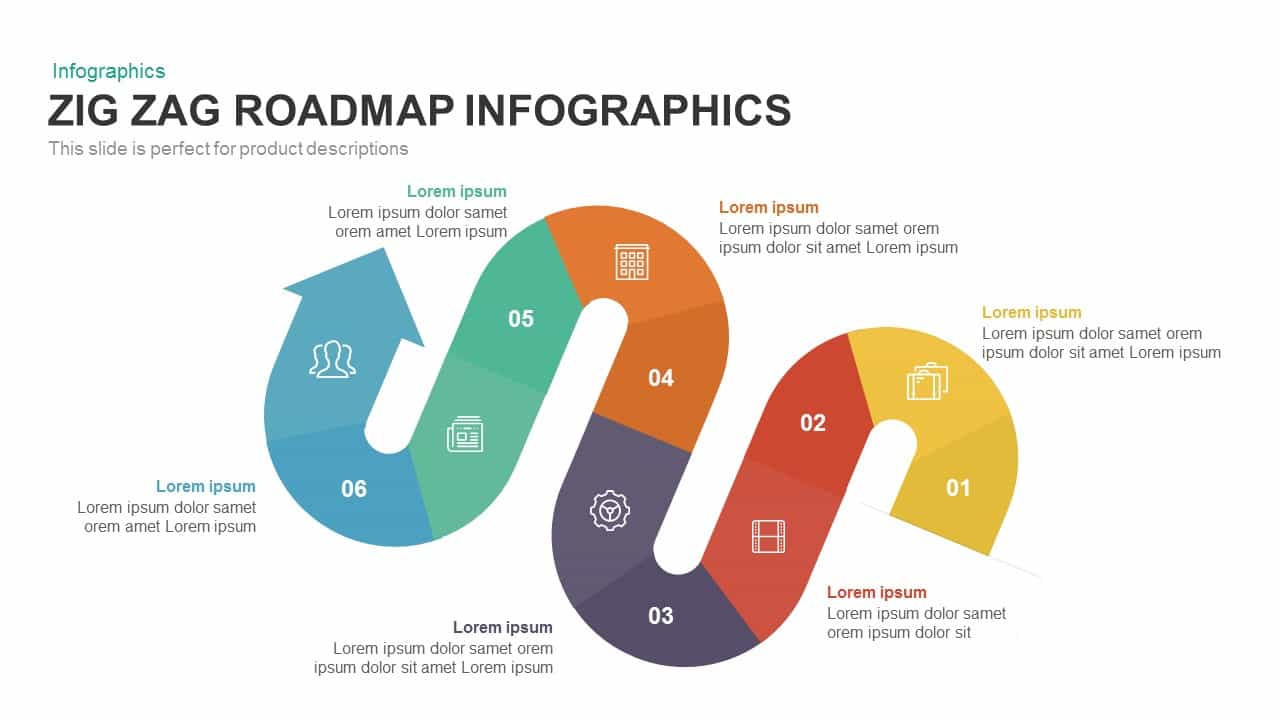
Six-Stage Zig-Zag Roadmap Infographics Template for PowerPoint & Google Slides
Roadmap
Six-Stage Time Arrow Infographics Template for PowerPoint & Google Slides
Arrow
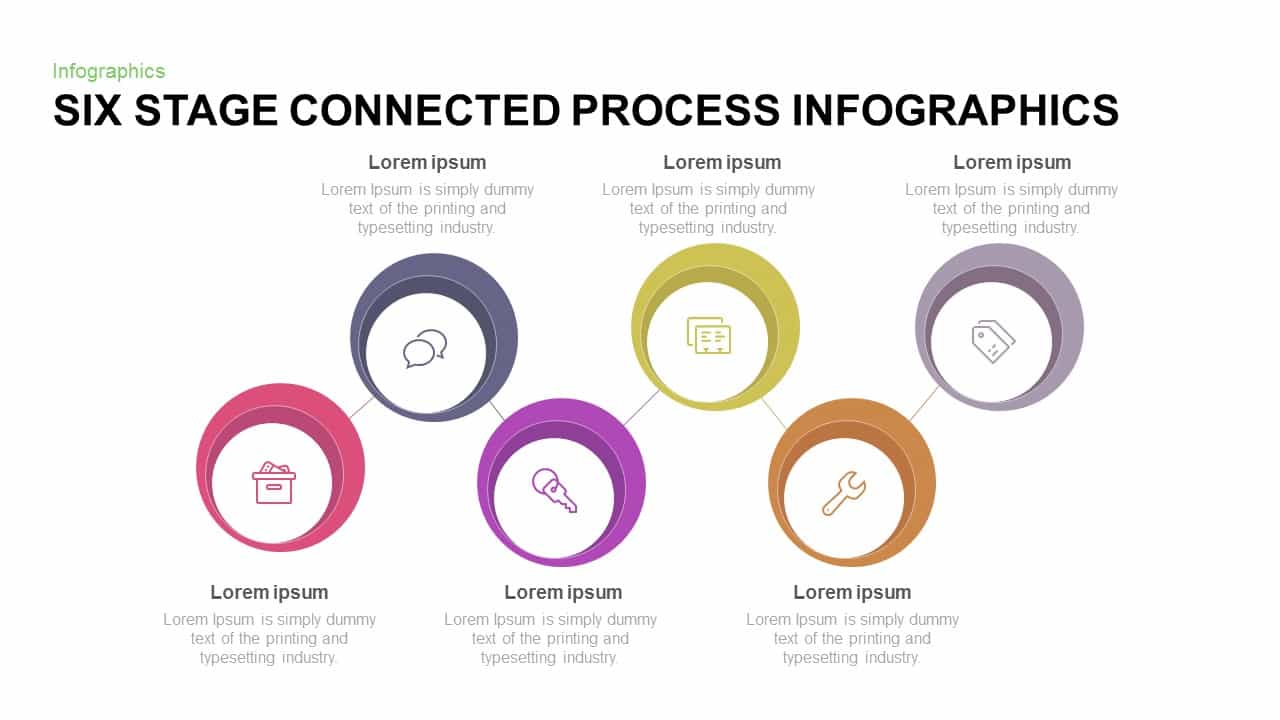
Six-Stage Connected Process Infographics Template for PowerPoint & Google Slides
Process
Five-Stage Pyramid Infographics Process Template for PowerPoint & Google Slides
Pyramid
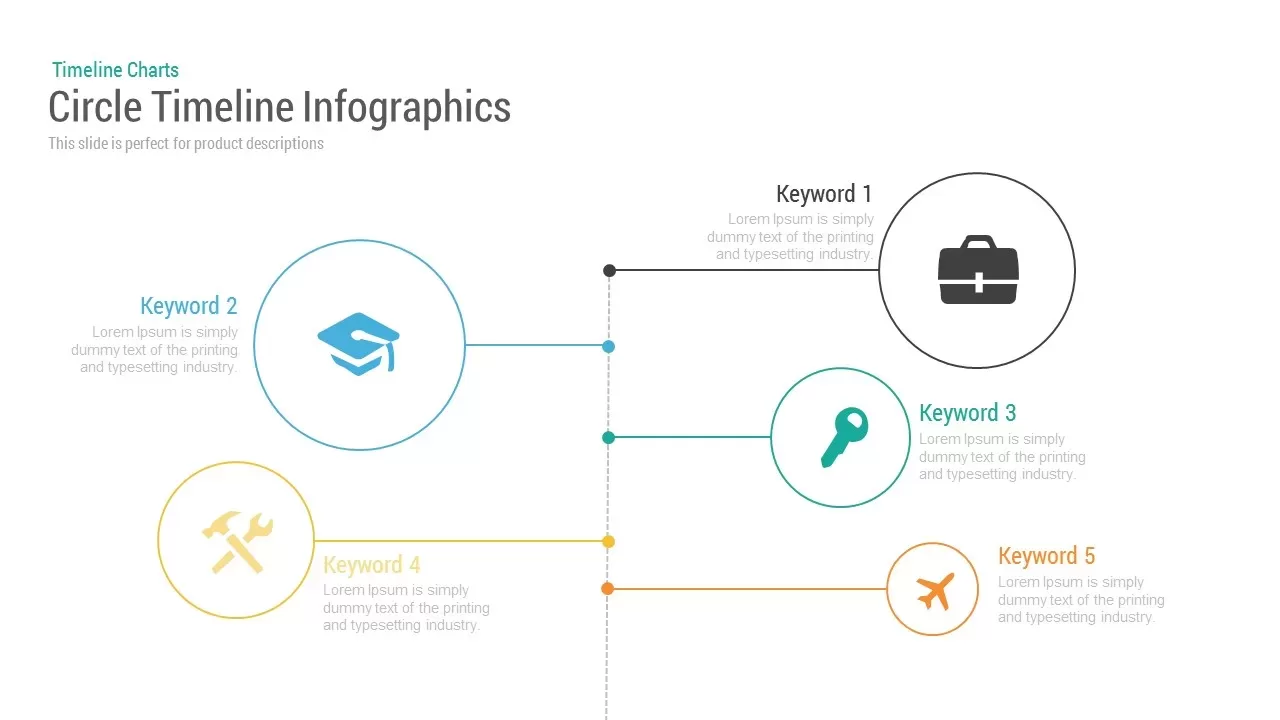
Circle Timeline Infographics template for PowerPoint & Google Slides
Timeline

Dynamic Circle Timeline Infographics template for PowerPoint & Google Slides
Timeline
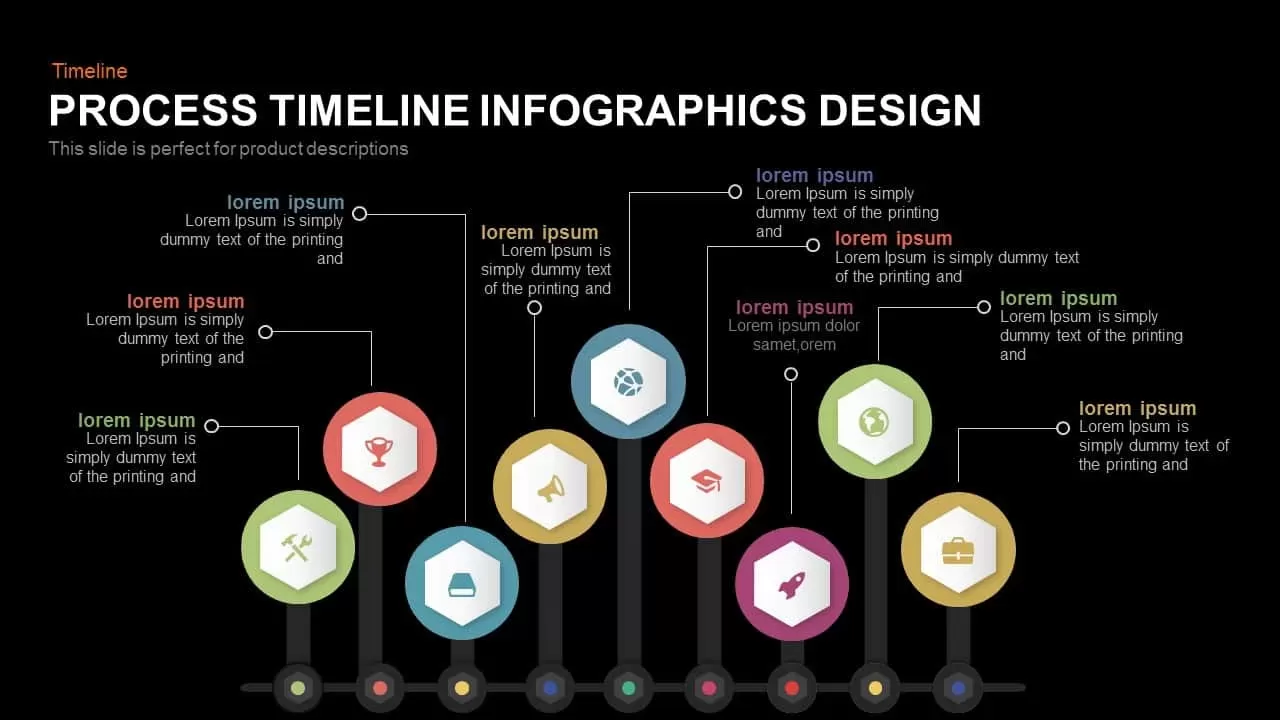
Process Timeline Infographics Design template for PowerPoint & Google Slides
Timeline
Timeline Arrow Infographics Diagram Template for PowerPoint & Google Slides
Timeline
Circular Timeline Infographics Template for PowerPoint & Google Slides
Timeline
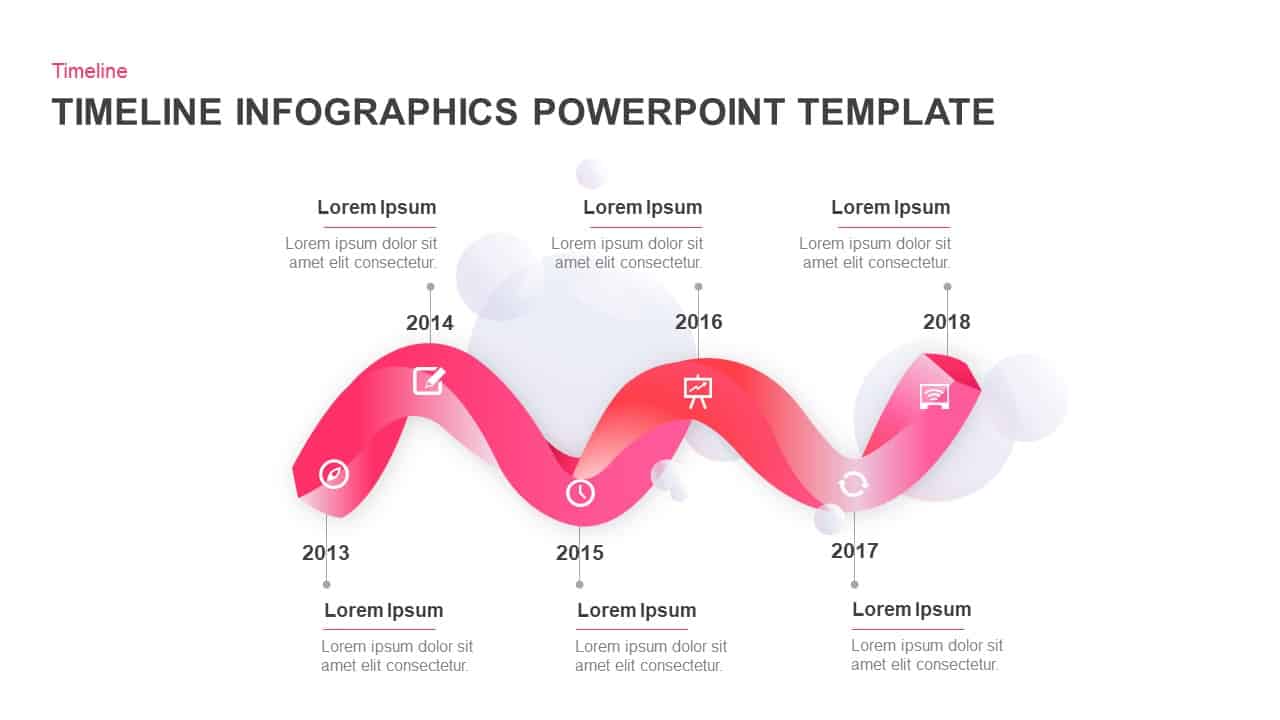
Wavy Ribbon Timeline Infographics Template for PowerPoint & Google Slides
Timeline
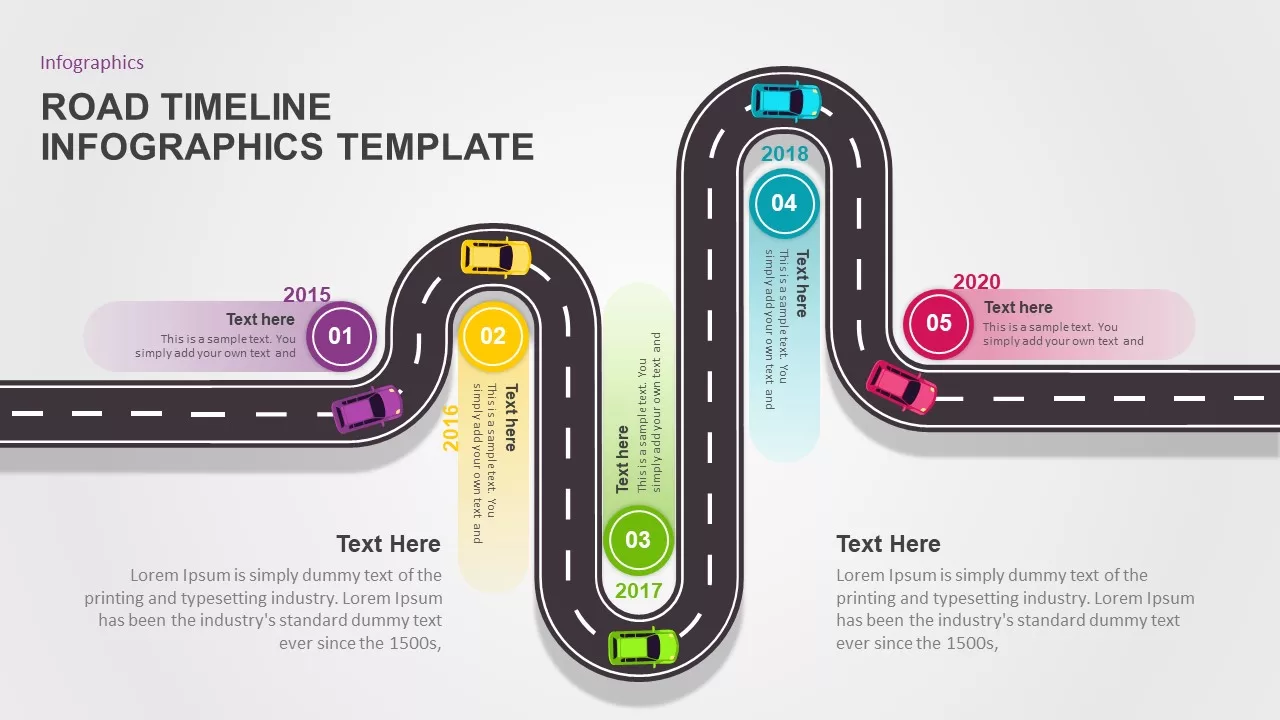
Road Timeline Infographics Template for PowerPoint & Google Slides
Timeline
Animated Timeline Infographics template for PowerPoint & Google Slides
Timeline
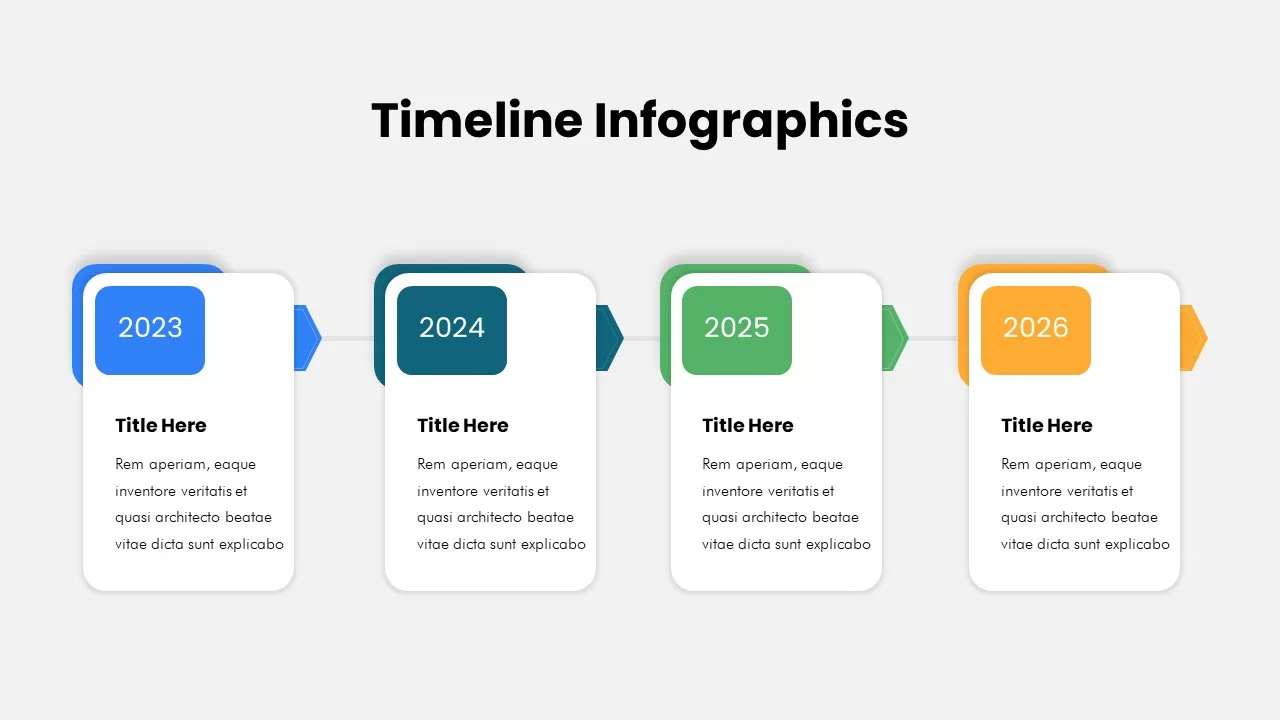
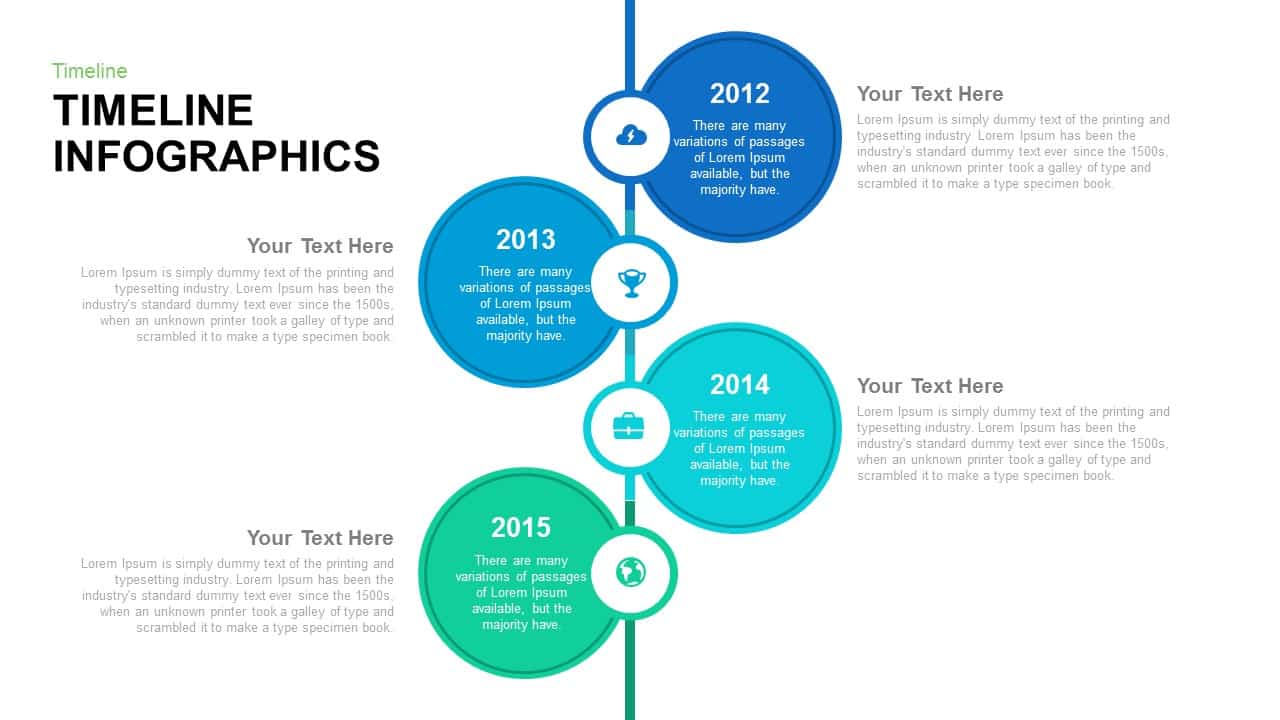
Timeline Infographics template for PowerPoint & Google Slides
Timeline
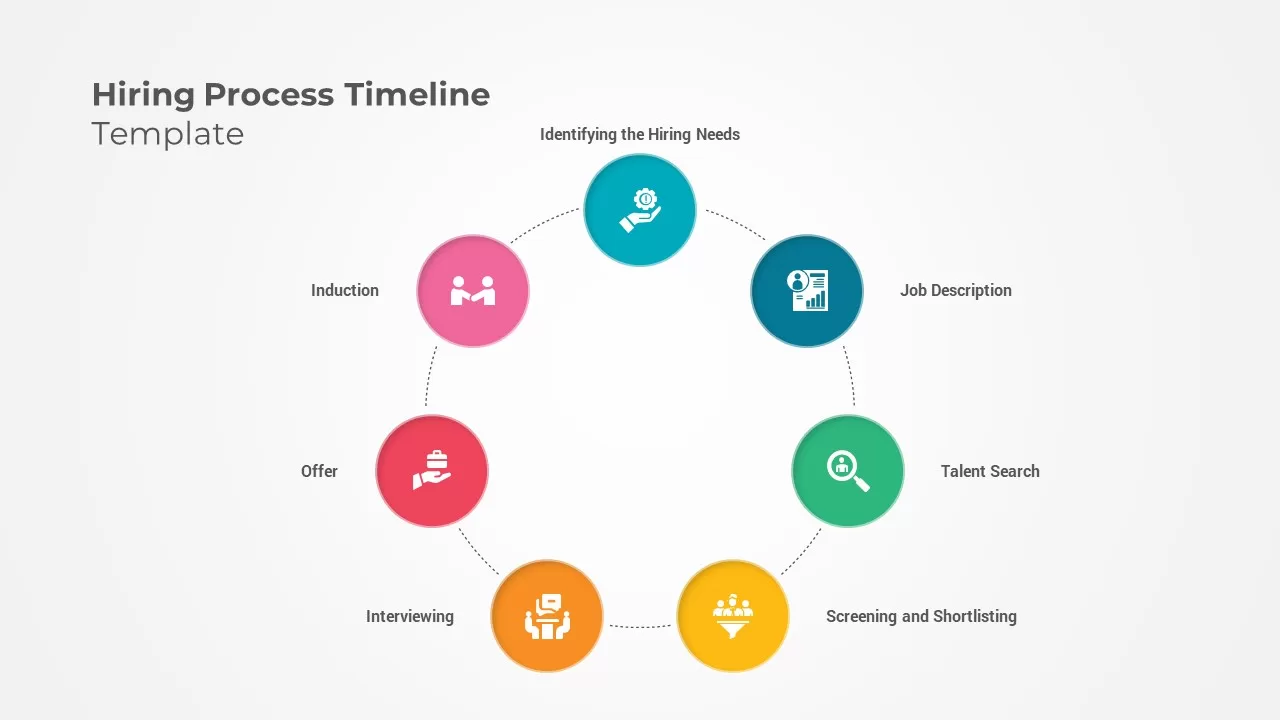
Hiring Process Timeline Infographics Template for PowerPoint & Google Slides
Recruitment

Free Colorful Timeline Infographics Template for PowerPoint & Google Slides
Timeline
Free
Timeline Infographics for PowerPoint & Google Slides
Timeline
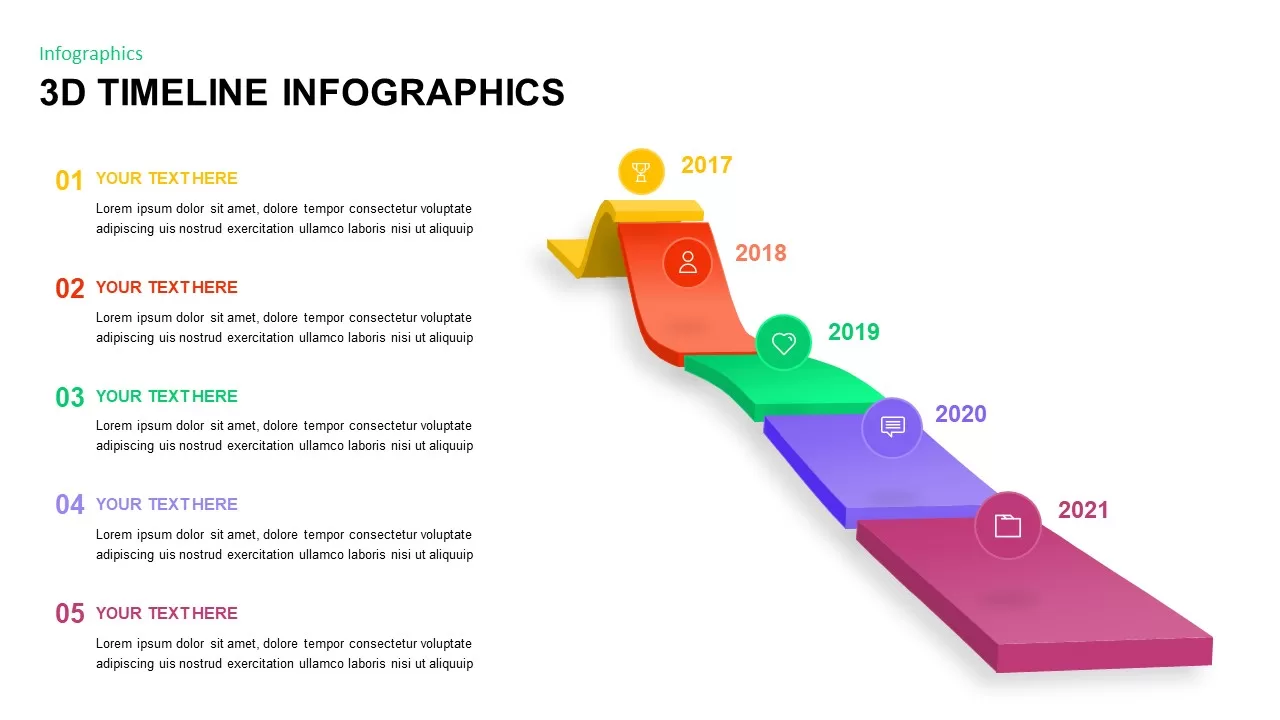
3D Timeline Infographics for PowerPoint & Google Slides
Project Status
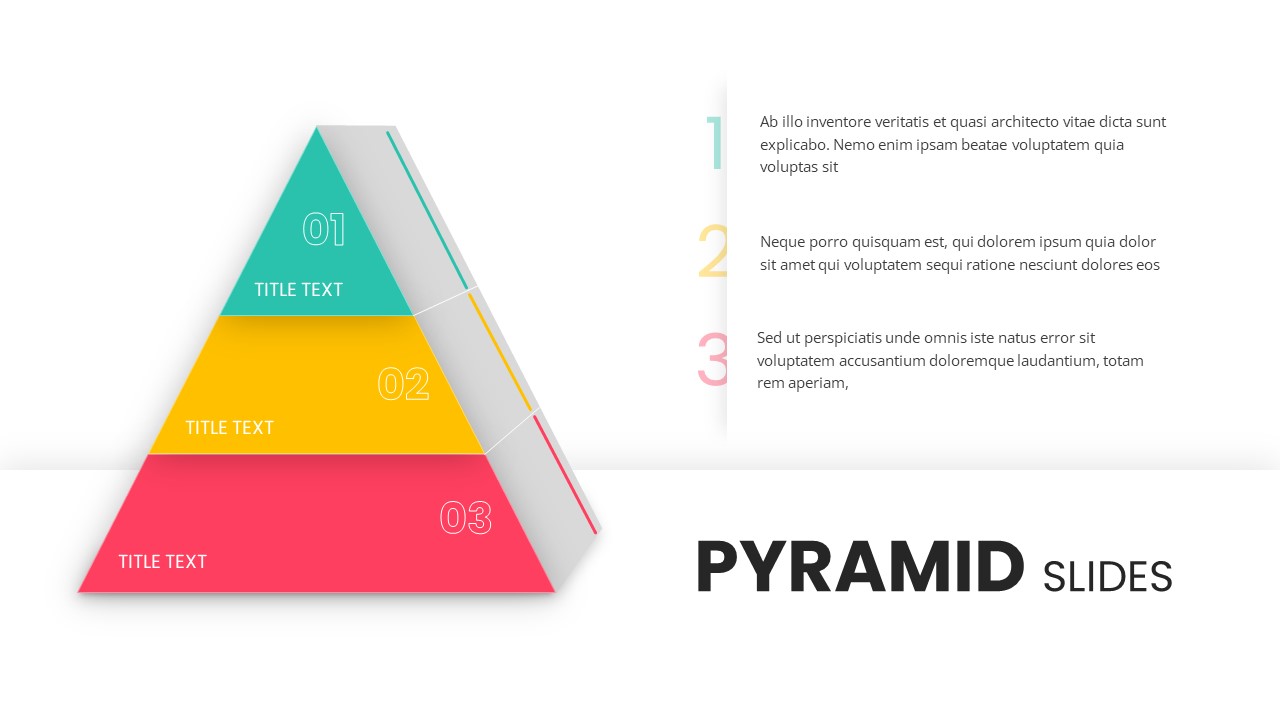
3 Stage Pyramid Slides for PowerPoint & Google Slides
Pyramid
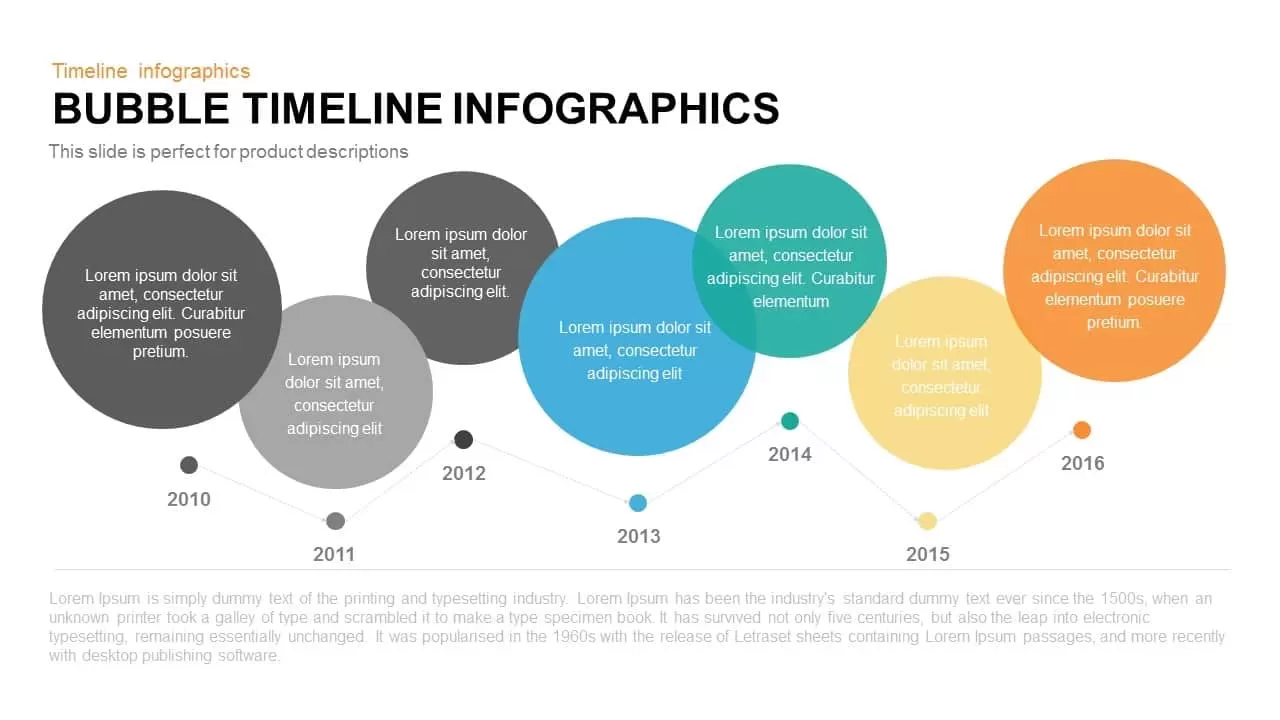
Bubble Timeline Infographics PowerPoint Template and Keynote
Business
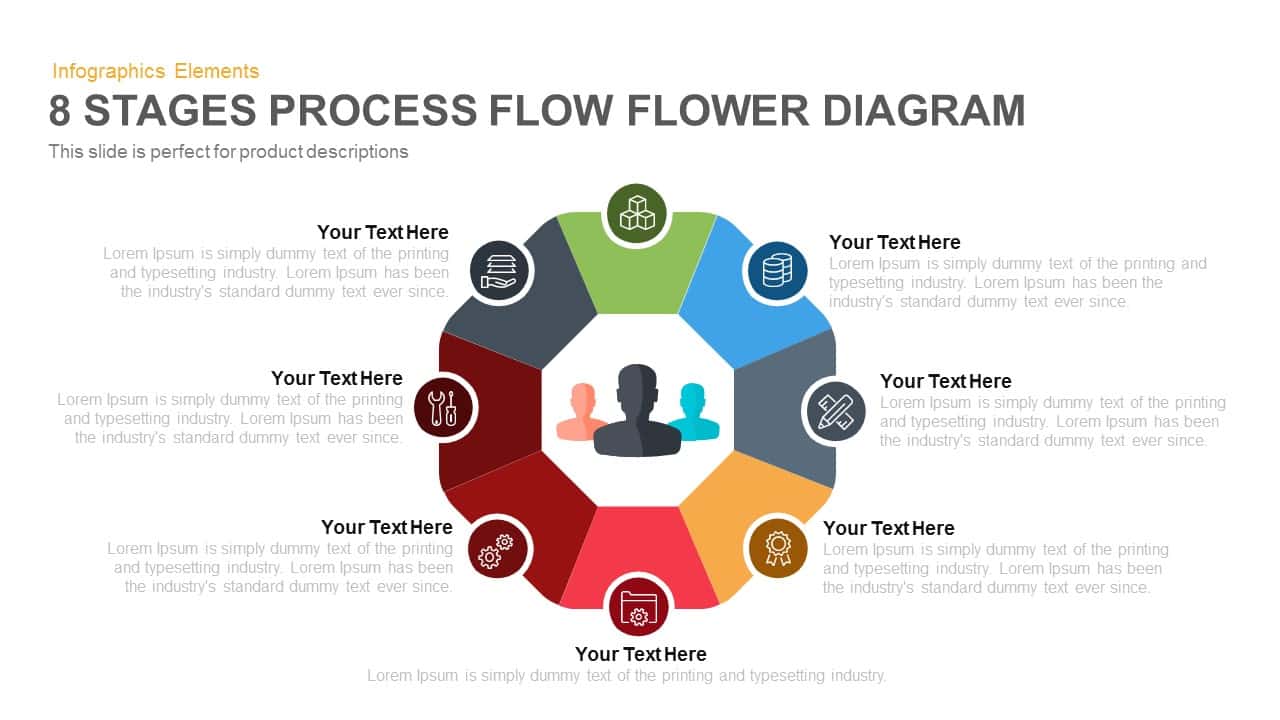
8-Stage Process Flow Flower Diagram Template for PowerPoint & Google Slides
Infographics
Six Stage Zigzag Process Diagram Template for PowerPoint & Google Slides
Process
Arrow Stage Process Diagram template for PowerPoint & Google Slides
Arrow
3 Stage Section Process Diagram Template for PowerPoint & Google Slides
Process
5 Stage Process Diagram Slide Overview Template for PowerPoint & Google Slides
Process
Three-Stage Ring Process Diagram Template for PowerPoint & Google Slides
Circular
Seven-Stage Arrow Process Diagram Template for PowerPoint & Google Slides
Process
Five-Stage Zig-Zag Arrow Diagram Template for PowerPoint & Google Slides
Process
Five-Stage Direct Flow Arrow Process Template for PowerPoint & Google Slides
Arrow
Four and Five-Stage Funnel Diagram Template for PowerPoint & Google Slides
Funnel
Colorful Four-Stage Infographic Process Template for PowerPoint & Google Slides
Process
Five-Stage Growth Arrow Infographic Template for PowerPoint & Google Slides
Arrow
Six-Stage Circle Process Diagram Template for PowerPoint & Google Slides
Process
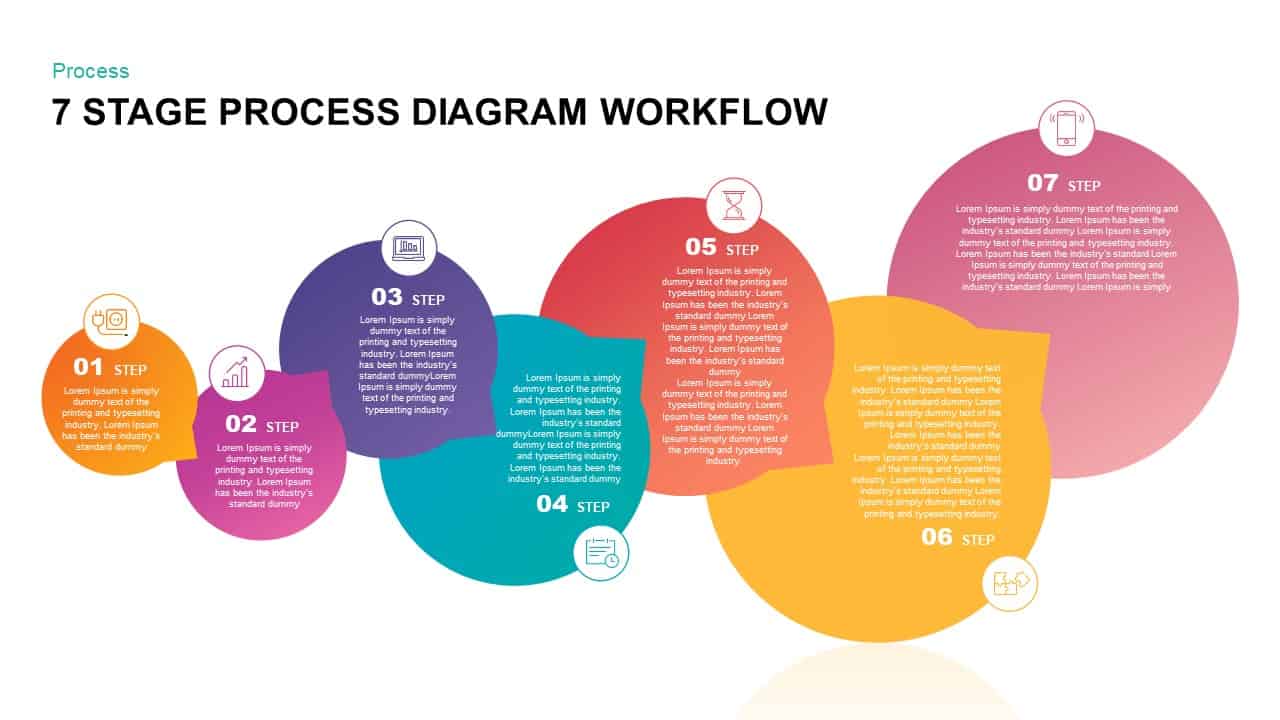
Gradient Seven-Stage Bubble Workflow Template for PowerPoint & Google Slides
Process
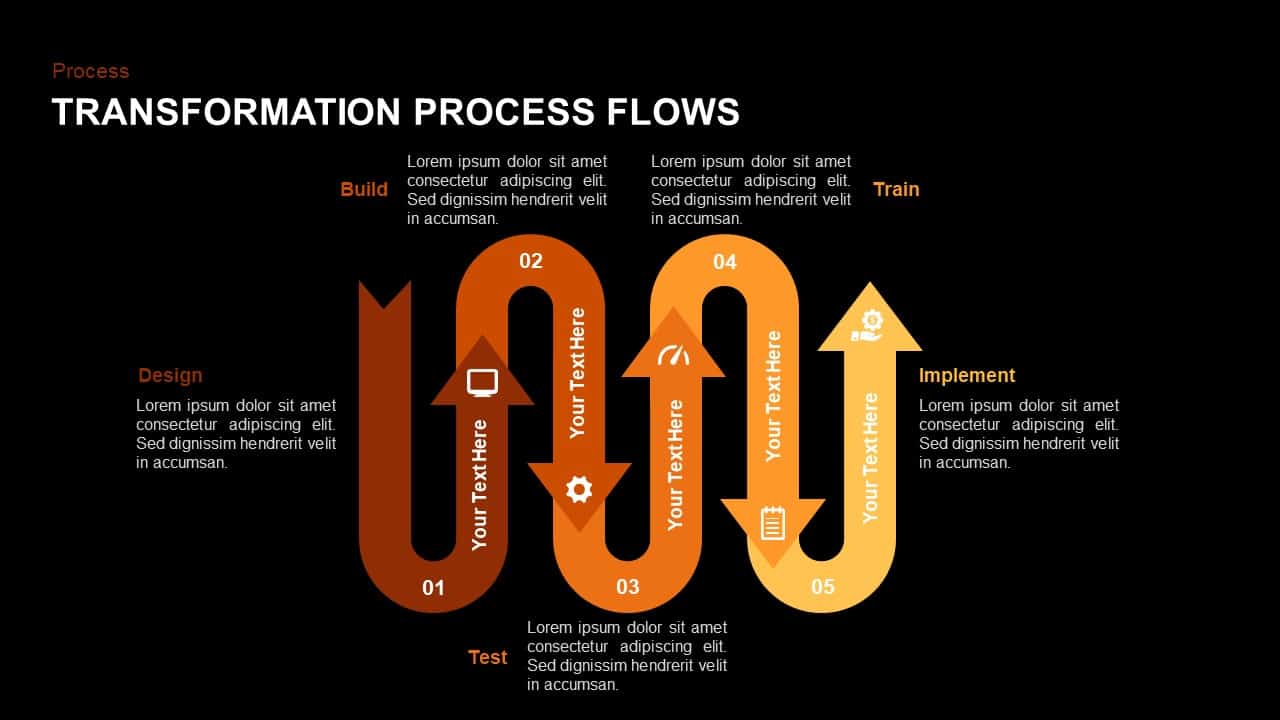
Wavy Five-Stage Transformation Flow Template for PowerPoint & Google Slides
Process
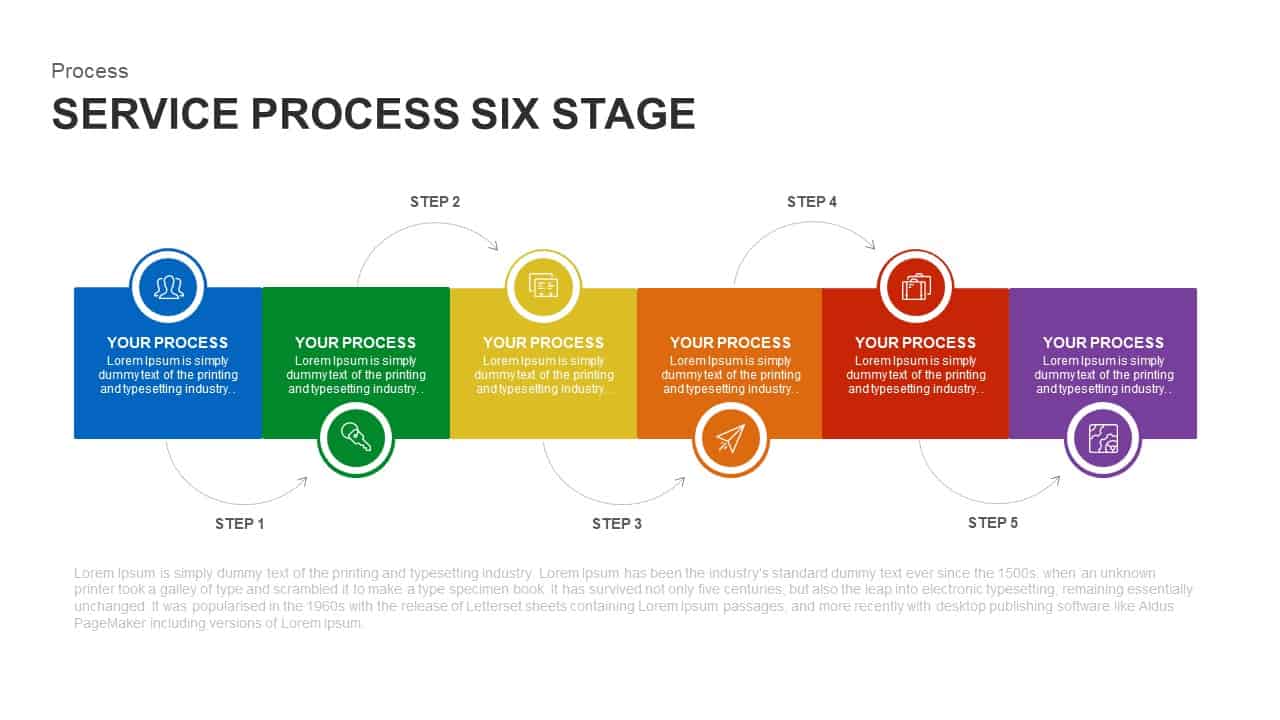
Six-Stage Service Process Workflow Template for PowerPoint & Google Slides
Process
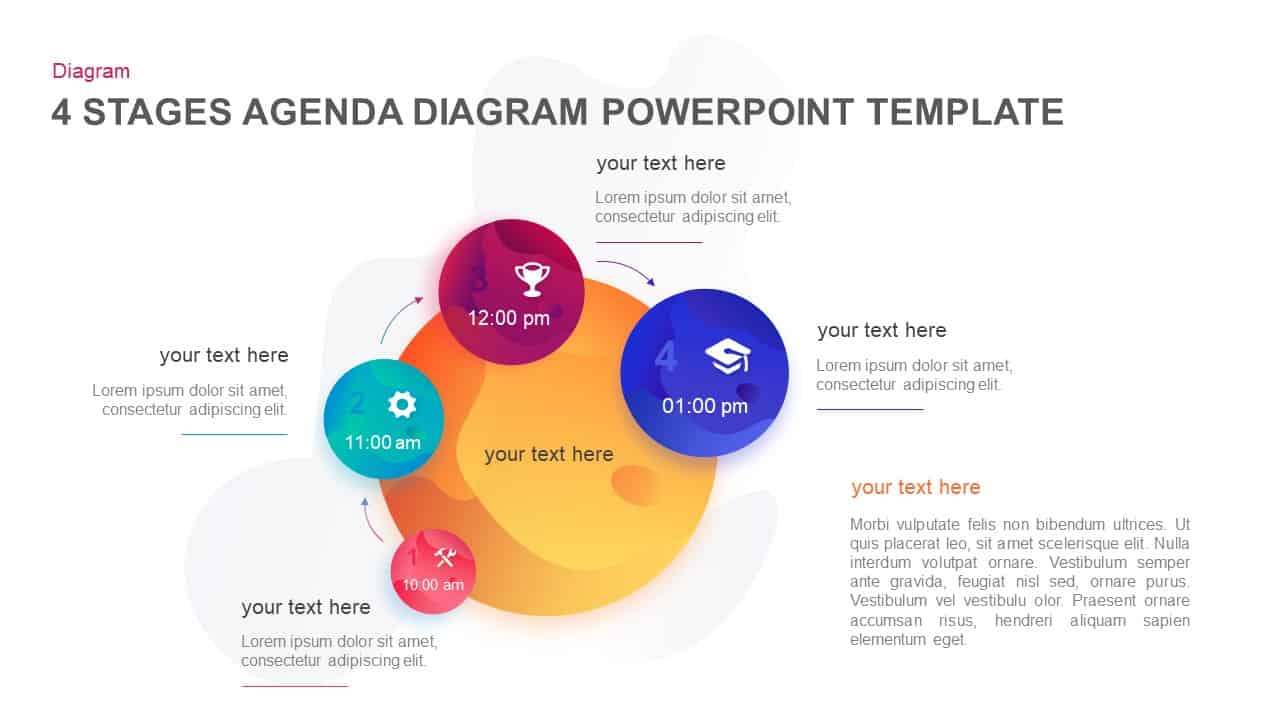
Four-Stage Agenda Circle Diagram Slide Template for PowerPoint & Google Slides
Agenda
Isometric Five-Stage Process Flow Template for PowerPoint & Google Slides
Process
Six-Stage Gear Wheel Diagram Template for PowerPoint & Google Slides
Circular
Gradient Chevron Five-Stage Process Flow Template for PowerPoint & Google Slides
Arrow
Five-Stage Agenda Flow Diagram Template for PowerPoint & Google Slides
Agenda
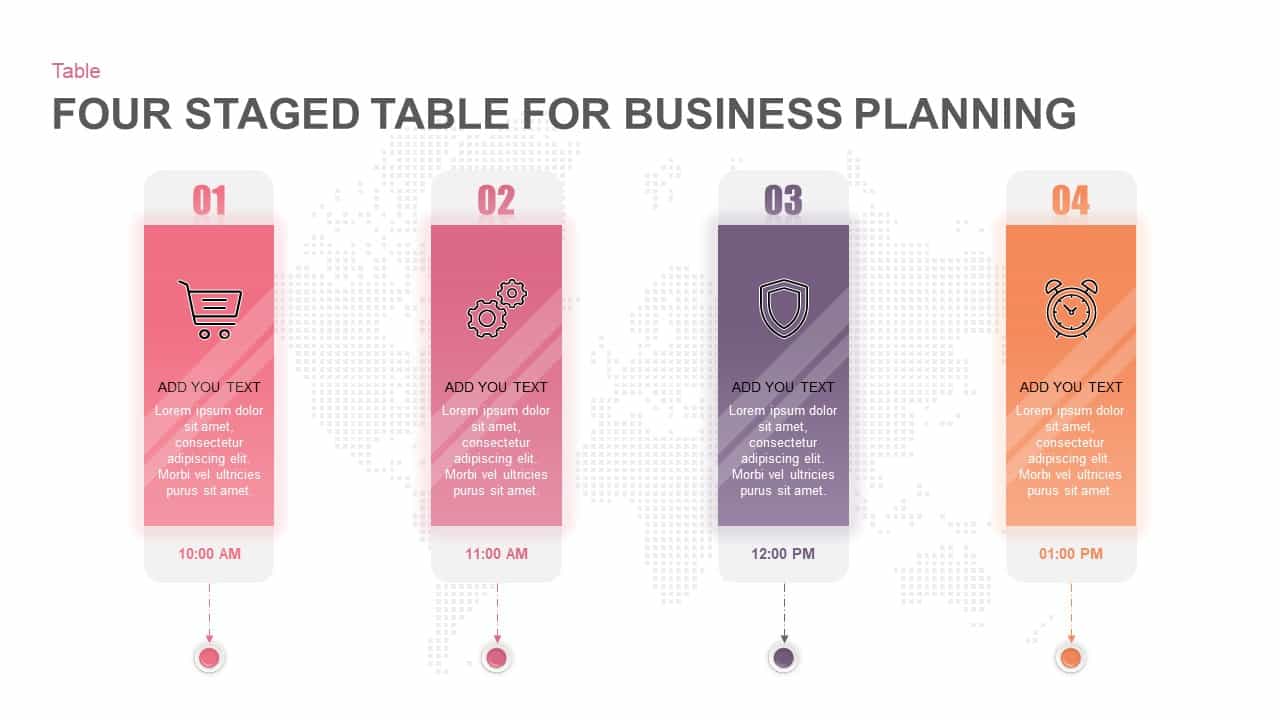
Four-Stage Business Planning Table Template for PowerPoint & Google Slides
Business Plan
Six-Stage Clockwise Circular Diagram Template for PowerPoint & Google Slides
Circular
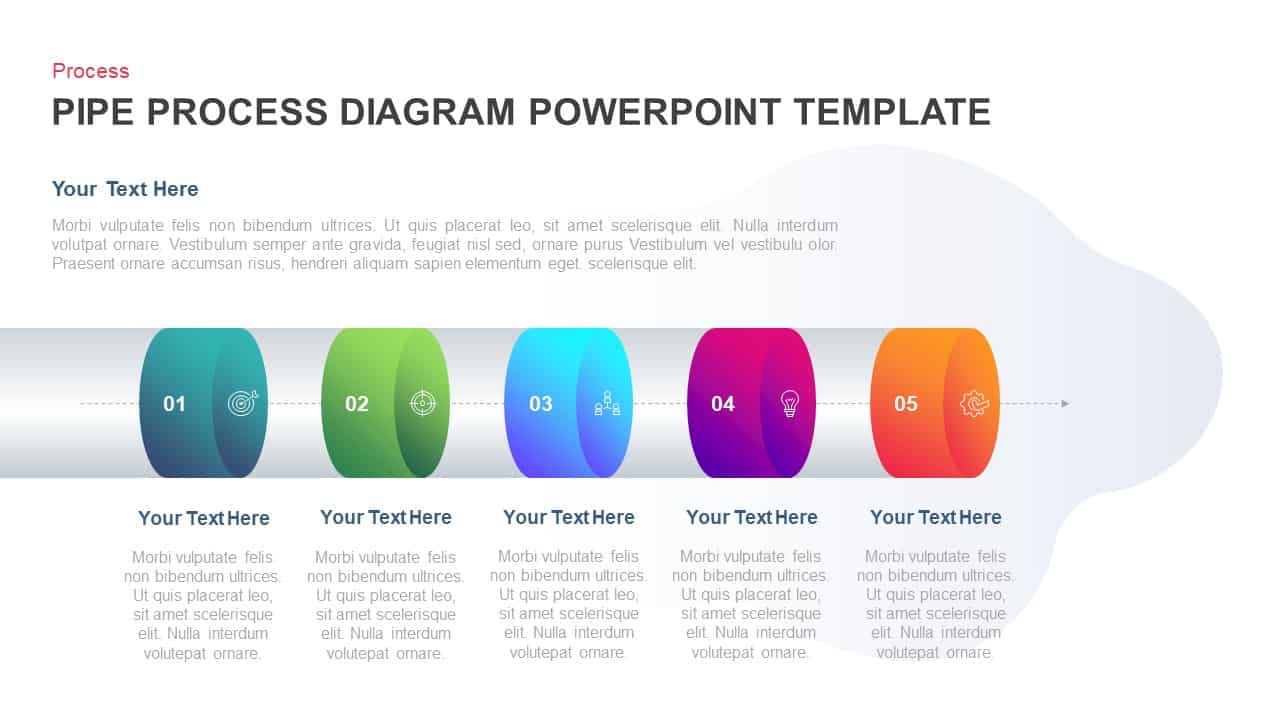
Five-Stage Pipe Process Diagram Template for PowerPoint & Google Slides
Process
5 Stage Linear Process Flow Diagram Template for PowerPoint & Google Slides
Process
4 Stage Linear Process Flow Diagram Template for PowerPoint & Google Slides
Process
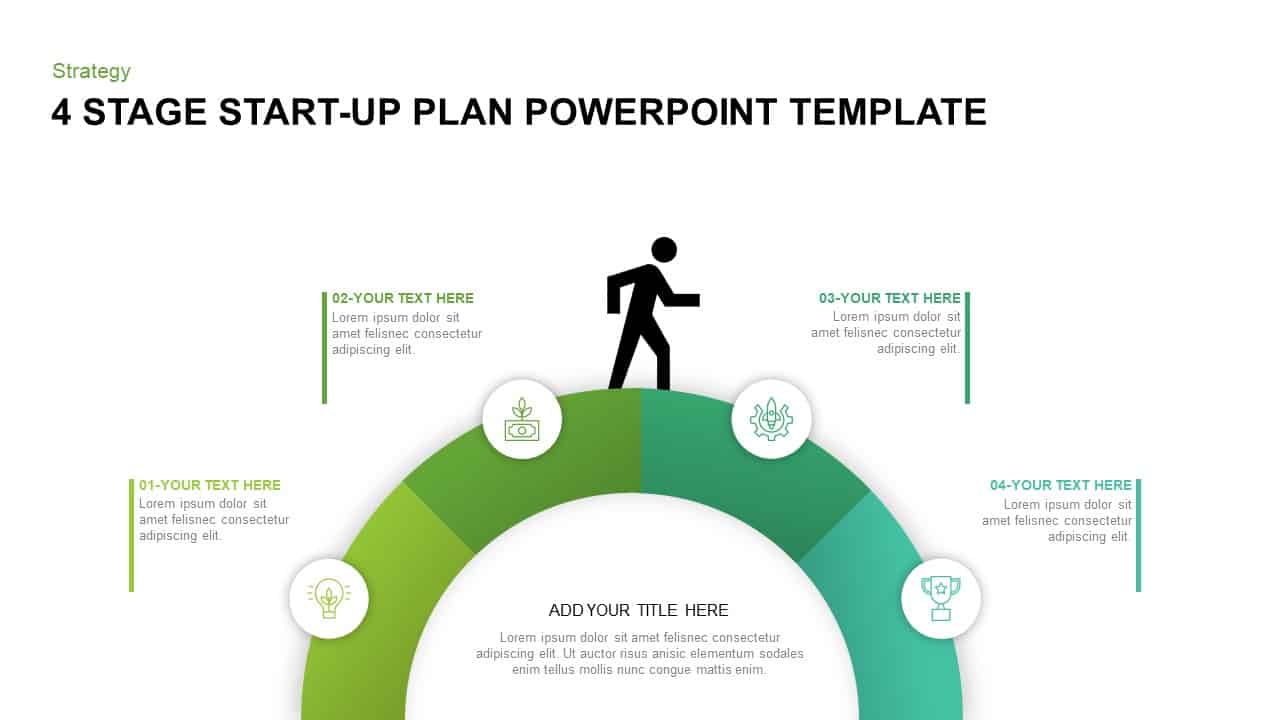
Four-Stage Start-Up Plan Arc Diagram Template for PowerPoint & Google Slides
Process
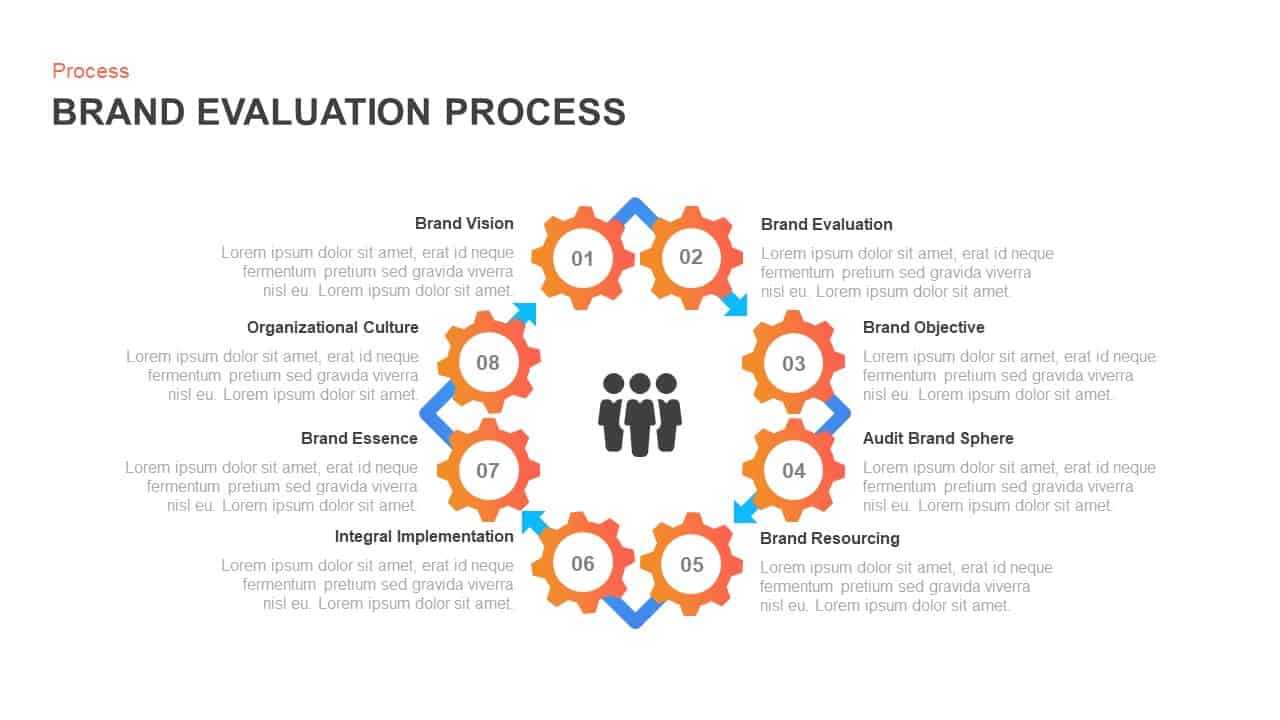
8-Stage Brand Evaluation Process Diagram Template for PowerPoint & Google Slides
Process
8-Stage Chevron Circular Diagram Template for PowerPoint & Google Slides
Process
Five Stage Puzzle Flow Diagram Template for PowerPoint & Google Slides
Process
4-Stage Documentation Control Diagram Template for PowerPoint & Google Slides
Process
Four-Stage Funnel Diagram Infographic Template for PowerPoint & Google Slides
Funnel
Four-Stage Communication Skills Diamond Template for PowerPoint & Google Slides
Circular
4 stage Process Flow template for PowerPoint & Google Slides
Process
Four-Stage Circle Arrow Infographic Template for PowerPoint & Google Slides
Circular
PDCA Four-Stage Cycle Infographic Template for PowerPoint & Google Slides
Process
Five-Stage Digital Maturity Model Diagram Template for PowerPoint & Google Slides
Process
6 Stage Hub and Spoke Stages template for PowerPoint & Google Slides
Business Models
3D Five-Stage Pyramid Diagram Slide Template for PowerPoint & Google Slides
Pyramid
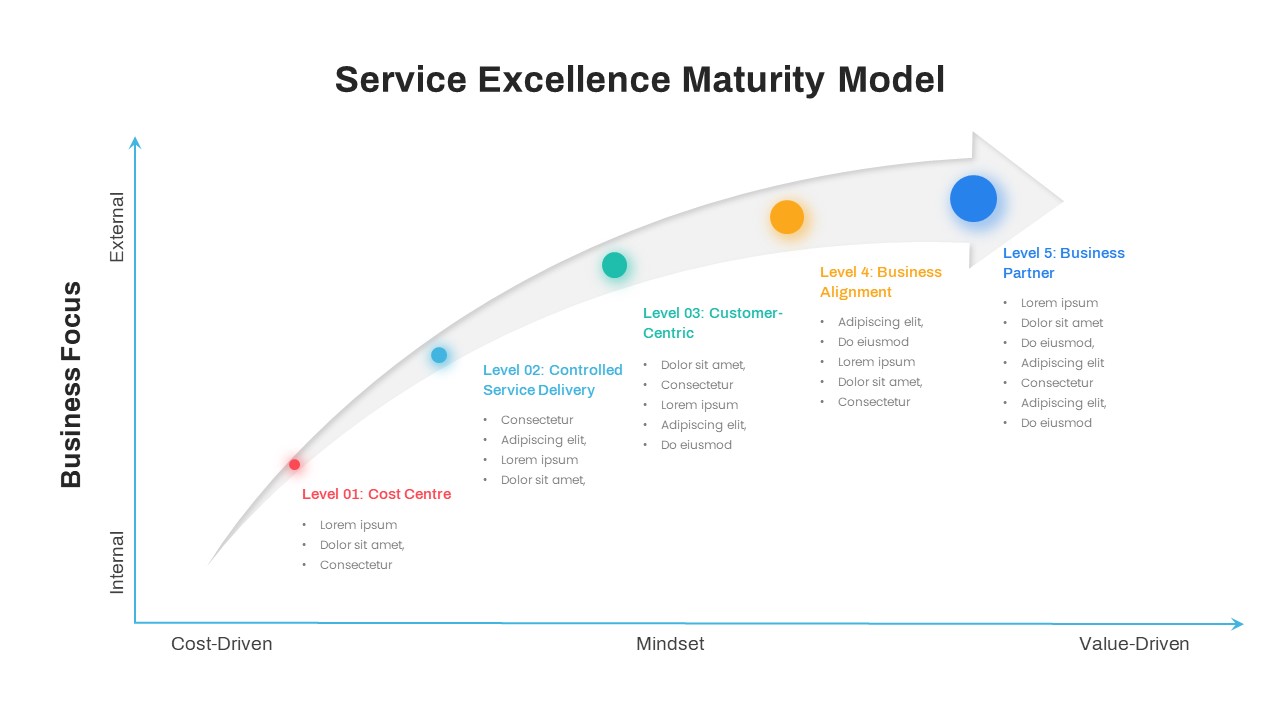
Service Excellence Maturity 5-Stage Template for PowerPoint & Google Slides
Process
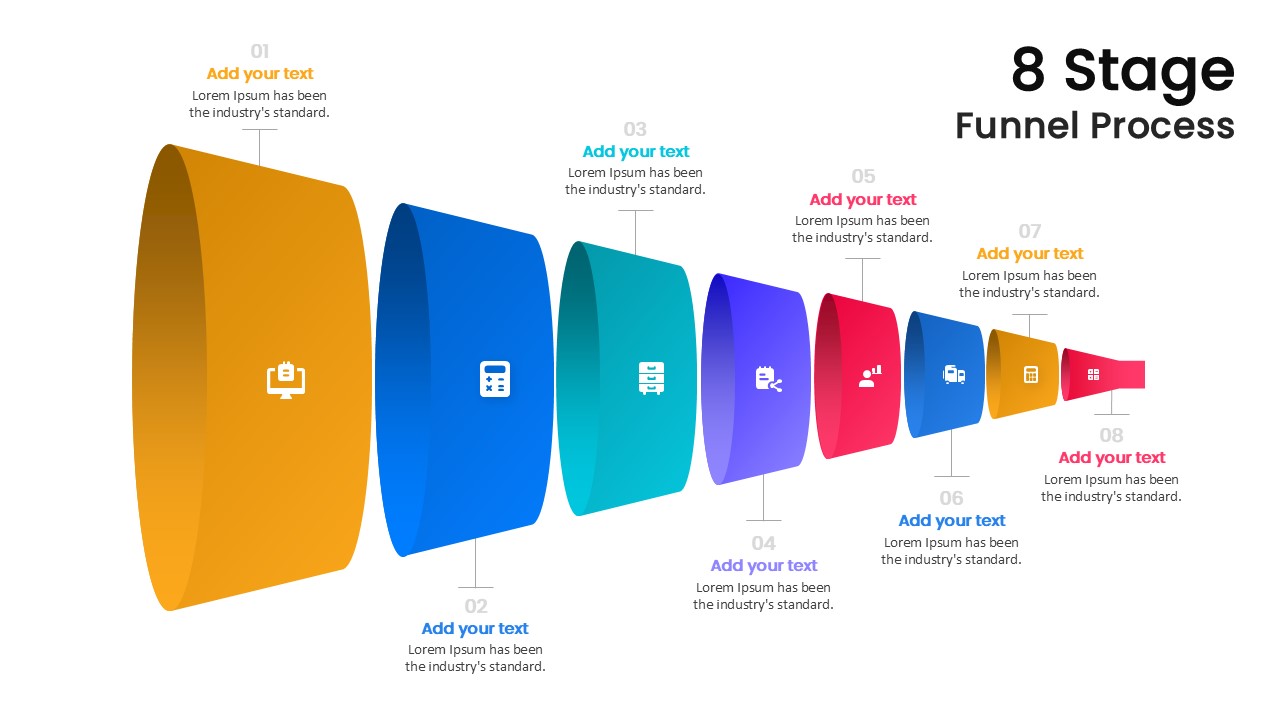
8 Stage Funnel Process template for PowerPoint & Google Slides
Funnel
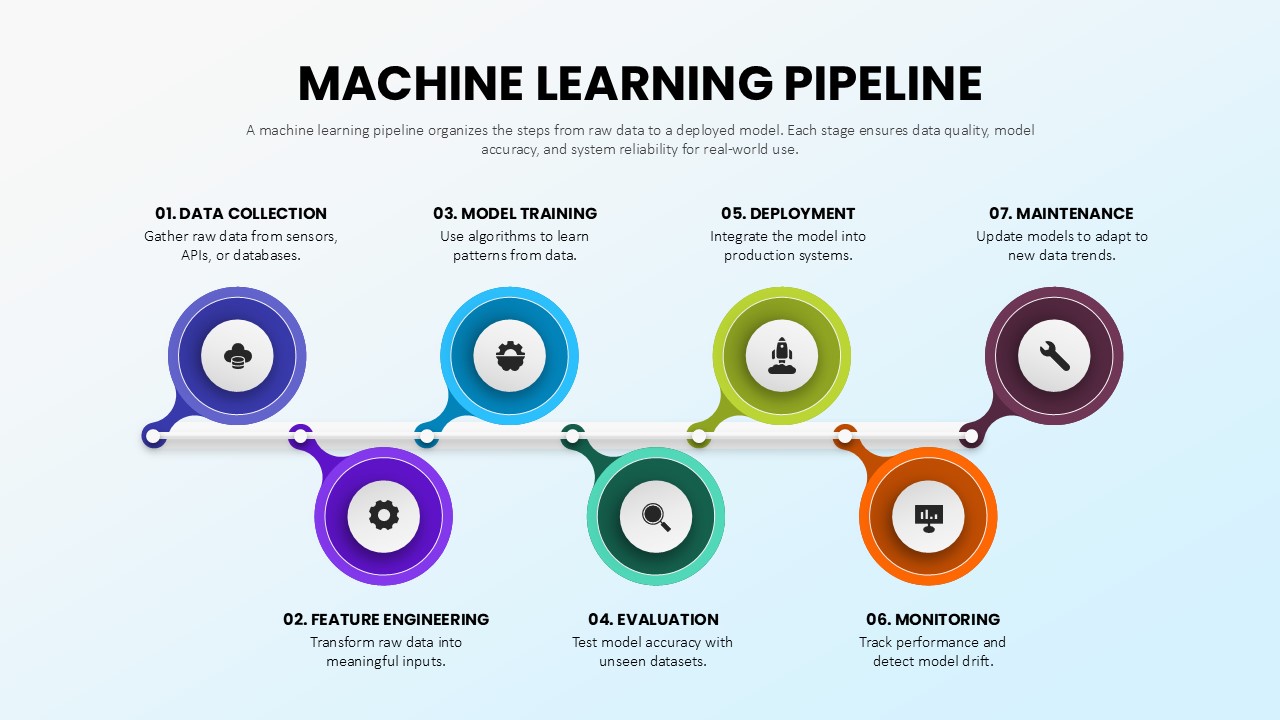
Seven Stage Machine Learning Pipeline Template for PowerPoint & Google Slides
Machine Learning
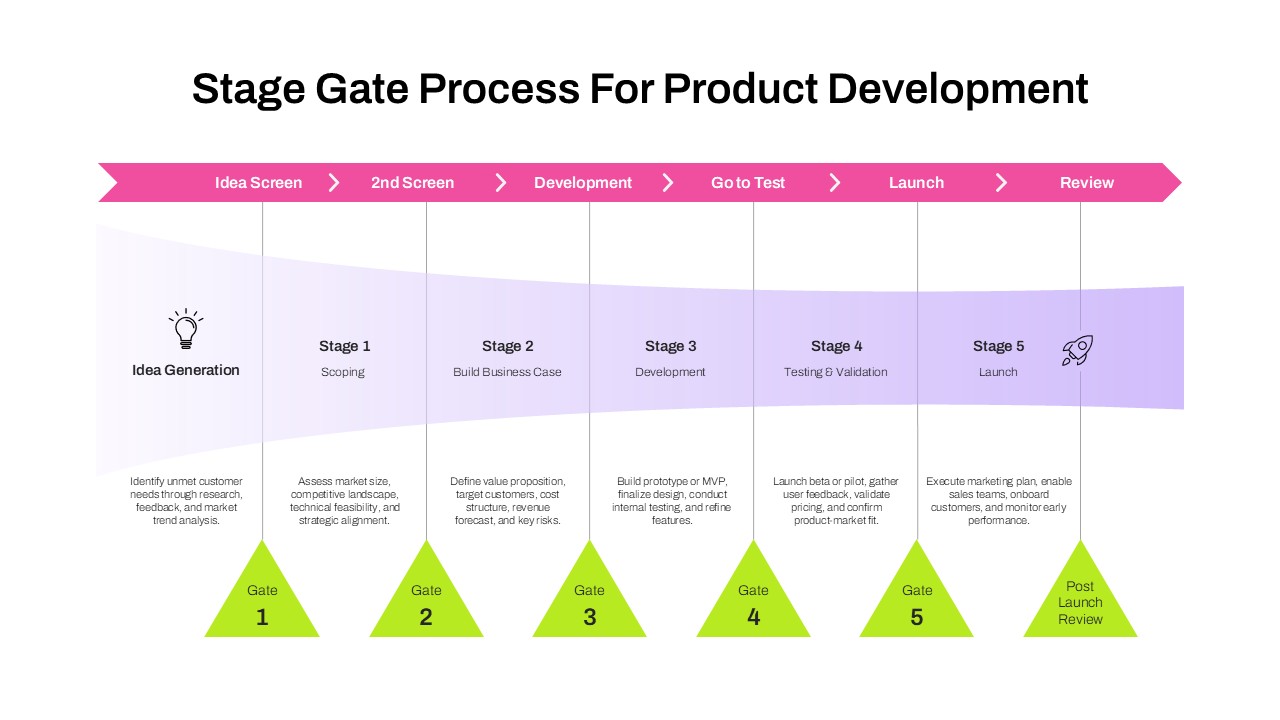
Stage Gate Process for Product Development Template for PowerPoint & Google Slides
Process