6 Steps Clockwise Circular Diagram Template for PowerPoint


Description
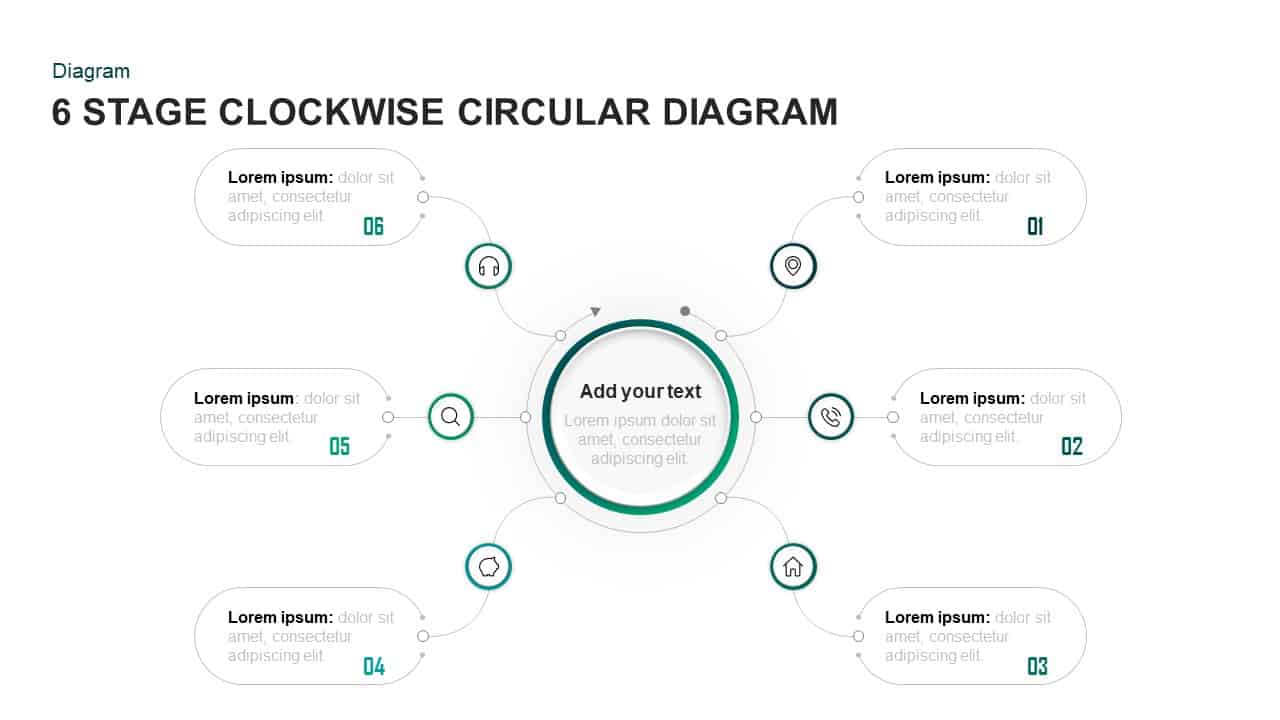
Leverage this six-stage clockwise circular diagram slide to present processes, workflows, or cyclical sequences with clarity and visual balance. At its center, an editable hub contains headings and subtext; six spokes radiate outward, each connecting to labeled rounded callouts paired with custom icons and numbered in a clockwise order. The ring around the hub uses gradient teal and green accents to guide viewers through stages 1 to 6. Each callout includes a clean icon—such as a location pin, phone, home, gear, search, and headset—paired with placeholder text that’s easy to replace. The thin curved connectors ensure a seamless flow while maintaining a minimalist aesthetic. Vector shapes and editable lines offer full customization: adjust colors, swap icons, resize elements, or modify text to align with brand guidelines.
Built on master slides, this design delivers consistency across presentations. Placeholders support drag-and-drop functionality in PowerPoint and Google Slides, ensuring resolution independence and smooth collaboration. The symmetrical layout adapts to different themes; recolor the ring or background to match corporate palettes, or change icon styles for industry-specific narratives.
Use the central hub to summarize the cycle’s theme, milestone, or overarching objective. Customize node labels to represent departments, tasks, metrics, or timeline periods. Employ color-coded numbering to emphasize progress or priority, or apply thematic icons to reinforce conceptual coherence. The slide supports additional annotations: include connectors with arrowheads to suggest directionality or animate individual spokes to reveal steps sequentially during presentations. Whether illustrating customer journeys, product development phases, operational workflows, or service lifecycles, this template translates complex sequences into approachable visuals.
Optimized for both virtual and in-person settings, the clean typography and generous white space improve legibility on any screen size. With this diagram in your toolkit, streamline storytelling, foster data-driven discussions, and maintain consistent branding across stakeholder communications effortlessly.
Who is it for
Project managers, business analysts, operations leads, and strategy consultants will benefit from this slide when outlining sequential steps, phase-based roadmaps, or process optimizations. Marketing teams, trainers, and executive stakeholders can leverage the visual flow to engage audiences and reinforce narrative clarity.
Other Uses
Repurpose this diagram for customer journey maps, product launch timelines, risk assessment frameworks, or service lifecycle overviews. Swap icons and adjust labels to illustrate funding stages, recruitment processes, OKR tracking, or performance dashboards across departments.
Login to download this file


