SIPOC Powerpoint and Keynote Template


Description
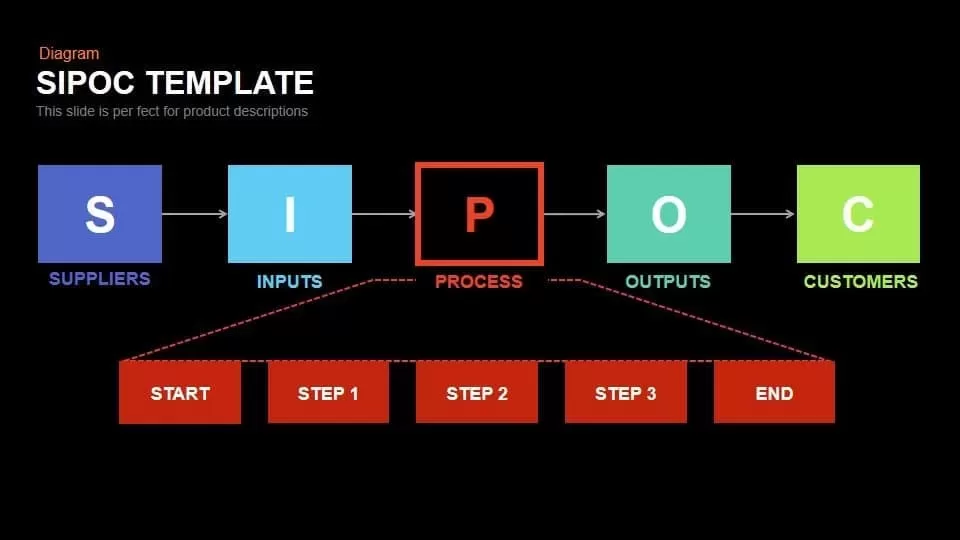
Leverage this versatile SIPOC diagram slide to illustrate your end-to-end process mapping with precision and clarity. The horizontal layout presents Suppliers, Inputs, Process, Outputs, and Customers in distinct, color-coded shapes—squares or circles—connected by directional arrows to guide your audience through each phase of the value stream. A detailed process breakdown section appears below, containing Start, Step 1, Step 2, Step 3, and End blocks that expand on the central P component, allowing presenters to dive deeper into workflow activities without cluttering the primary diagram. The clean typography, balanced white space, and vibrant palette ensure that key elements pop on both light and dark backgrounds, supported by master slides and editable placeholders for rapid customization.
Optimize your narrative flow by swapping shape styles, adjusting color assignments, or renaming labels to suit your industry context. The template’s modular structure makes it easy to duplicate or remove sections, reorganize steps, and maintain consistent alignment across slides. Whether you need to document manufacturing lines, software deployment cycles, or service delivery chains, this SIPOC slide adapts to your requirements while upholding a polished corporate aesthetic.
Designed for seamless integration into any corporate or startup presentation, this fully editable template leverages master layouts, vector icons, and customizable color palettes to ensure brand consistency and high-resolution output across devices. With placeholder text and shape libraries readily available, you can swap in logos, adjust typography, and modify connectors in seconds. Compatible with both PowerPoint and Google Slides, this asset removes formatting headaches and accelerates preparation time, enabling you to focus on strategic insights rather than slide mechanics.
Who is it for
Process engineers, project managers, quality assurance specialists, and operations leaders will benefit from this SIPOC diagram when defining scope, identifying value-added steps, and aligning cross-functional teams. Consultants, trainers, and supply chain professionals can leverage the clear visual sequence to streamline stakeholder workshops, root cause analyses, or continuous improvement initiatives.
Other Uses
Beyond traditional SIPOC mapping, repurpose this slide to outline high-level audit frameworks, vendor selection criteria, or customer journey stages. Use the step breakdown area to illustrate milestone timelines, risk assessment checkpoints, or compliance workflows. Customize the shapes and colors to create decision trees, stakeholder maps, or executive overviews—all within a unified, professional format.
Login to download this file


