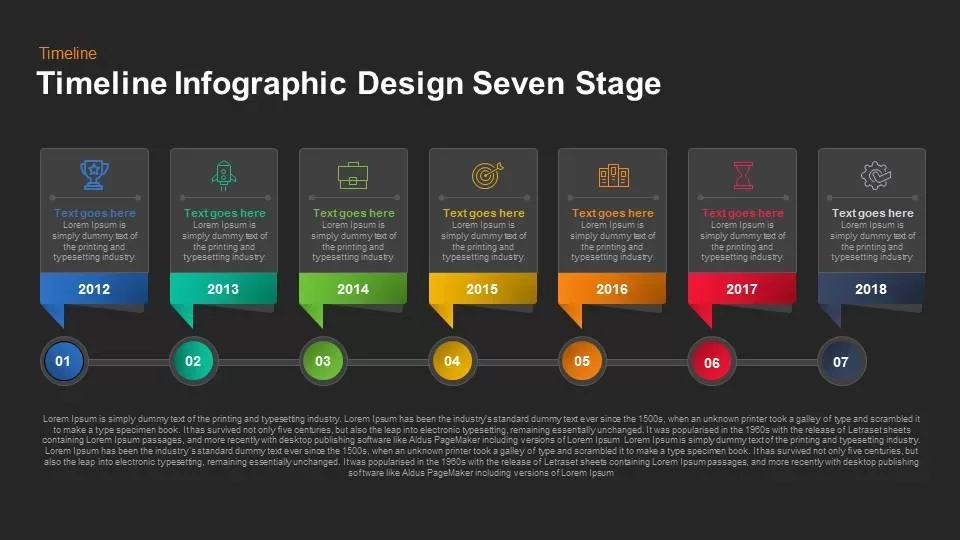
Seven-Stage Timeline Infographics Template for PowerPoint & Google Slides
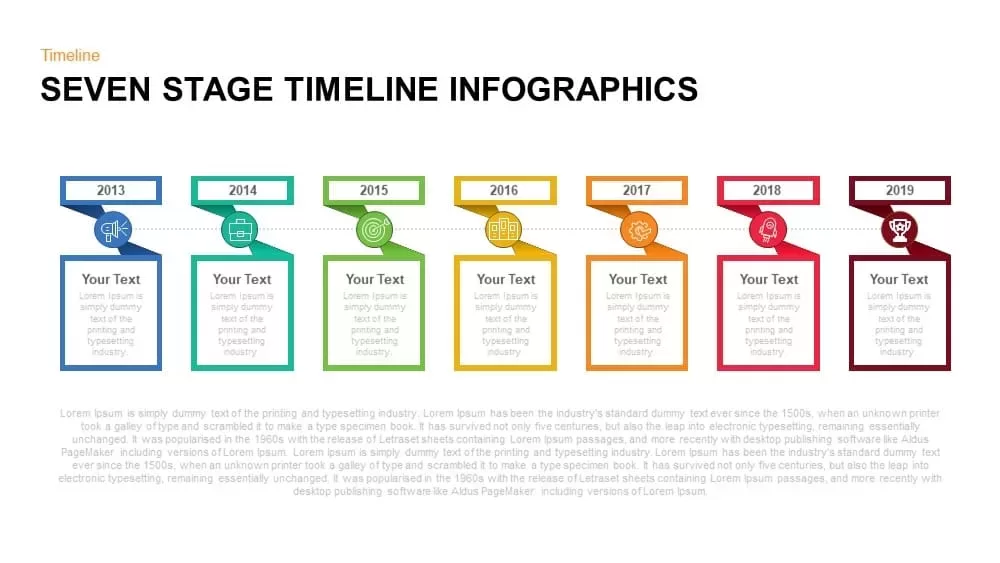
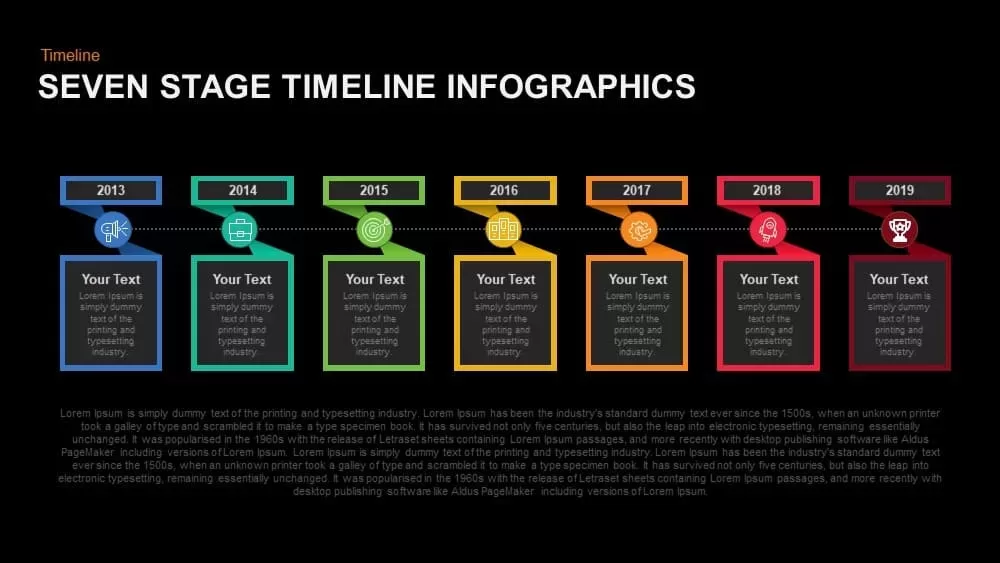
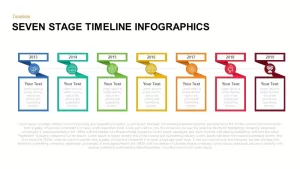
Visualize multi-year projects or organizational milestones with this dynamic seven-stage timeline infographic slide. The design features a clean white background and a subtle gray guide line connecting seven colored milestone pods, each labeled with a year (2013–2019) and a distinctive icon. Vector-based shapes ensure pixel-perfect clarity, while crisp typography and generous white space maximize readability. Built on master slides for both PowerPoint and Google Slides, every element—from header bars and icon fills to text boxes and connector styles—is fully editable. Swap icons, update years, adjust label positions, or recolor stages to match your brand palette in seconds. The intuitive horizontal layout guides audiences smoothly through sequential phases, making it perfect for roadmaps, process flows, historical overviews, or product development timelines.
This slide’s modular structure lets you extend or shorten the timeline by duplicating milestone pods or reshaping the guide line. Placeholder text areas accelerate content entry, and vector icons can be replaced with custom visuals without loss of quality. Whether presenting on large conference screens or printing handouts, the slide maintains full resolution clarity.
Who is it for
Project managers, product teams, and marketing strategists can leverage this infographic to map out launch schedules, campaign rollouts, and multi-year development plans. Consultants and executives will appreciate the clear visual sequencing when presenting strategic roadmaps or company histories.
Other Uses
Beyond traditional project timelines, repurpose this slide for career progression mapping, event scheduling, or process life-cycle overviews. Adapt the milestone icons to showcase financial targets, training modules, or audit checkpoints, and integrate the slide into broader status reports, investor briefings, or training decks.
Login to download this file

Item ID
SB00872
Related Templates

Timeline Infographic Design Seven Stage template for PowerPoint & Google Slides
Timeline

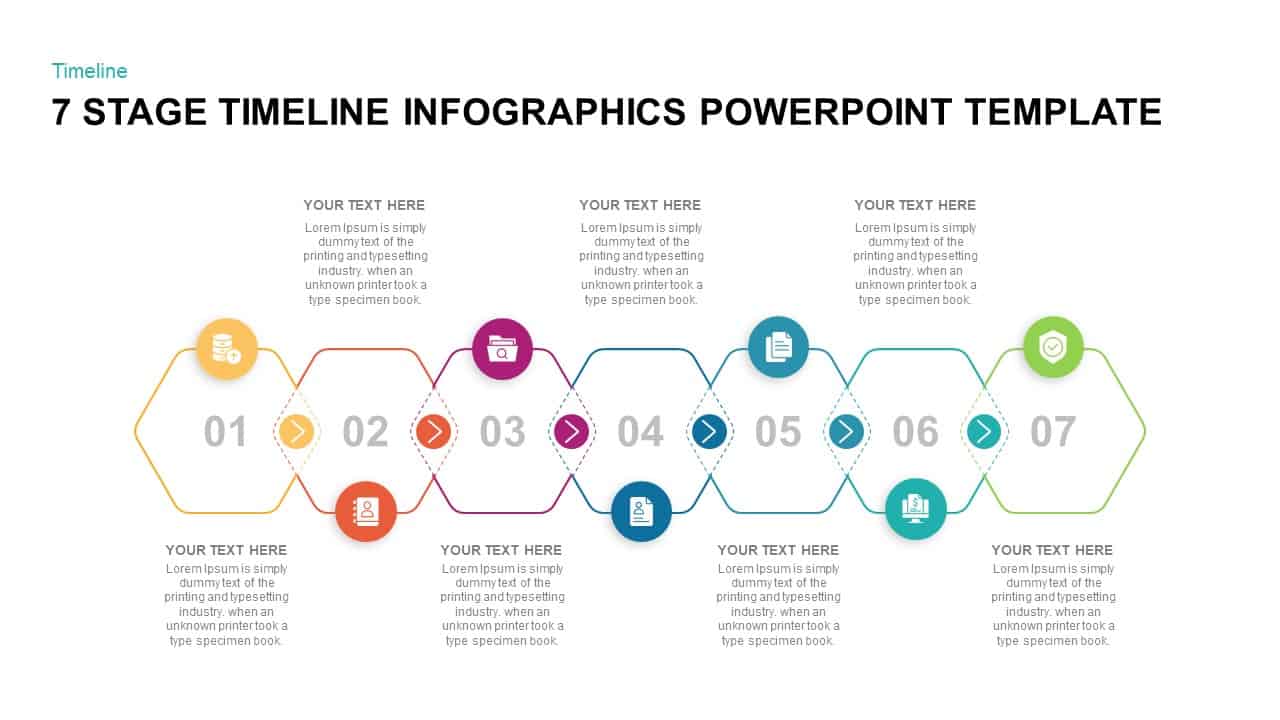
Seven-Stage Hexagon Timeline Infographic Template for PowerPoint & Google Slides
Timeline
Seven-Stage Arrow Process Diagram Template for PowerPoint & Google Slides
Process
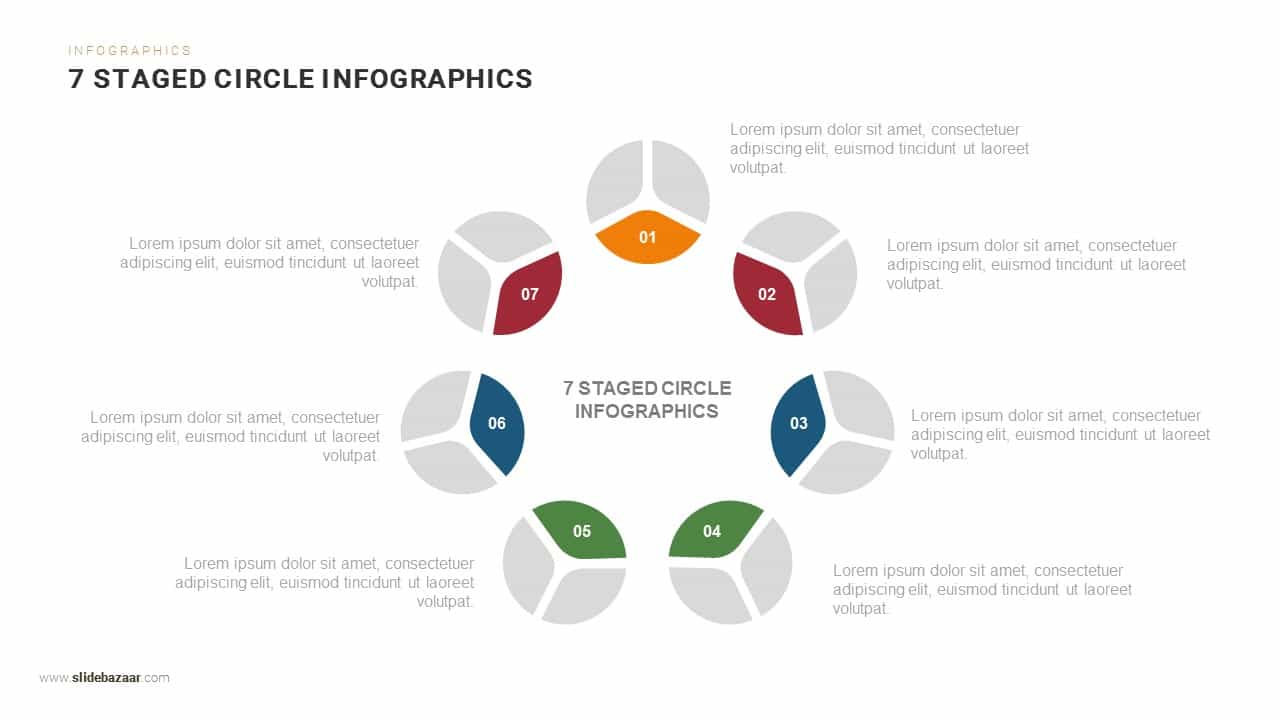
Seven-Stage Circular Infographic Template for PowerPoint & Google Slides
Circular
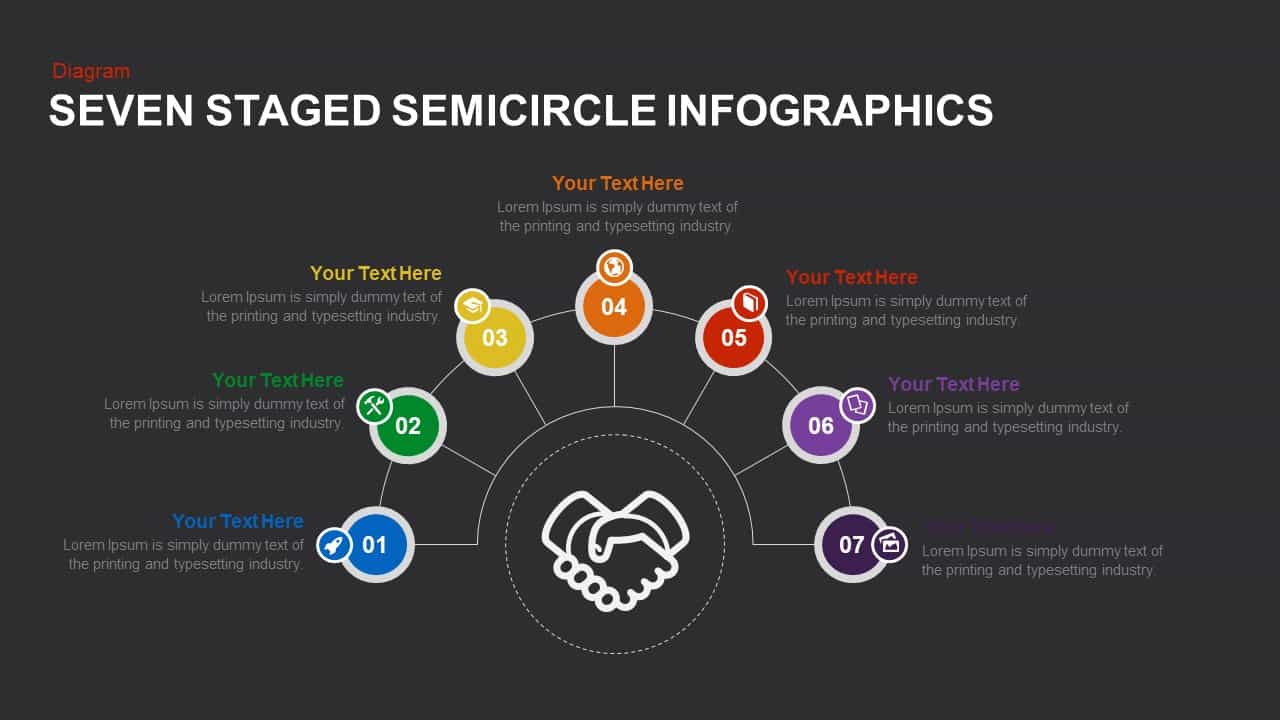
Seven Stage Semicircle Infographic Template for PowerPoint & Google Slides
Process
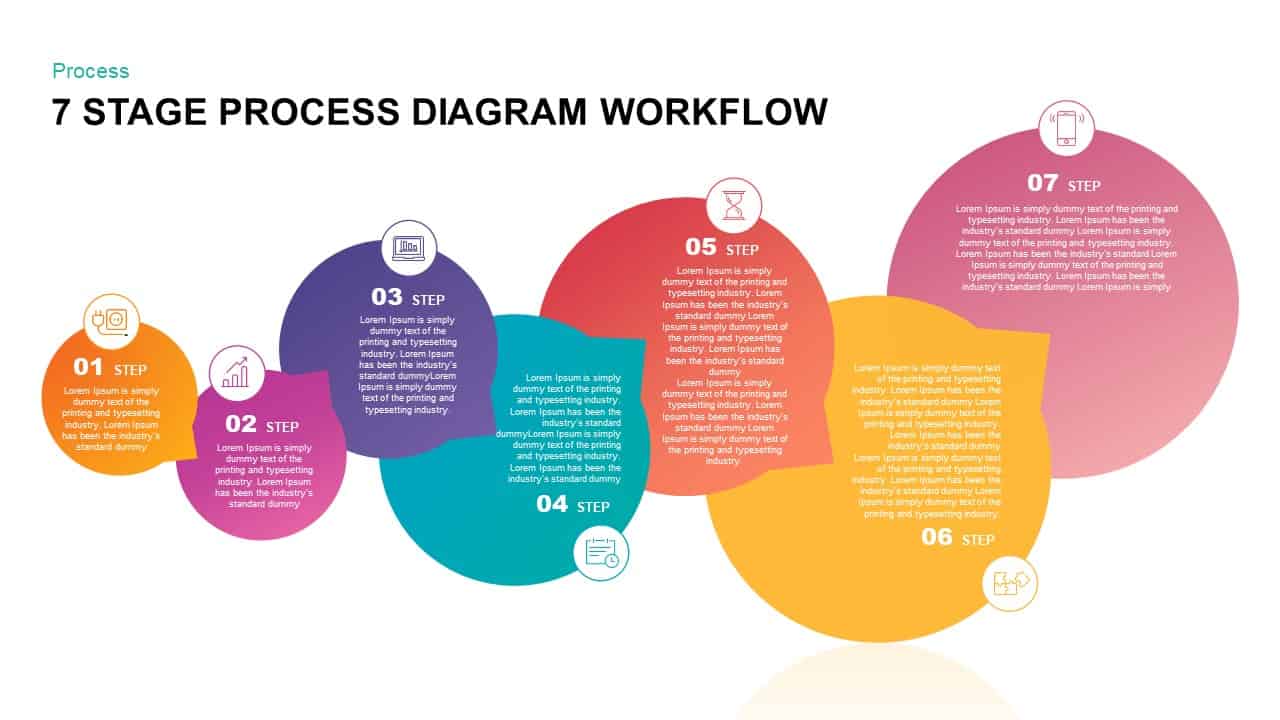
Gradient Seven-Stage Bubble Workflow Template for PowerPoint & Google Slides
Process
3D Seven-Stage Process Flow Diagram Template for PowerPoint & Google Slides
Process
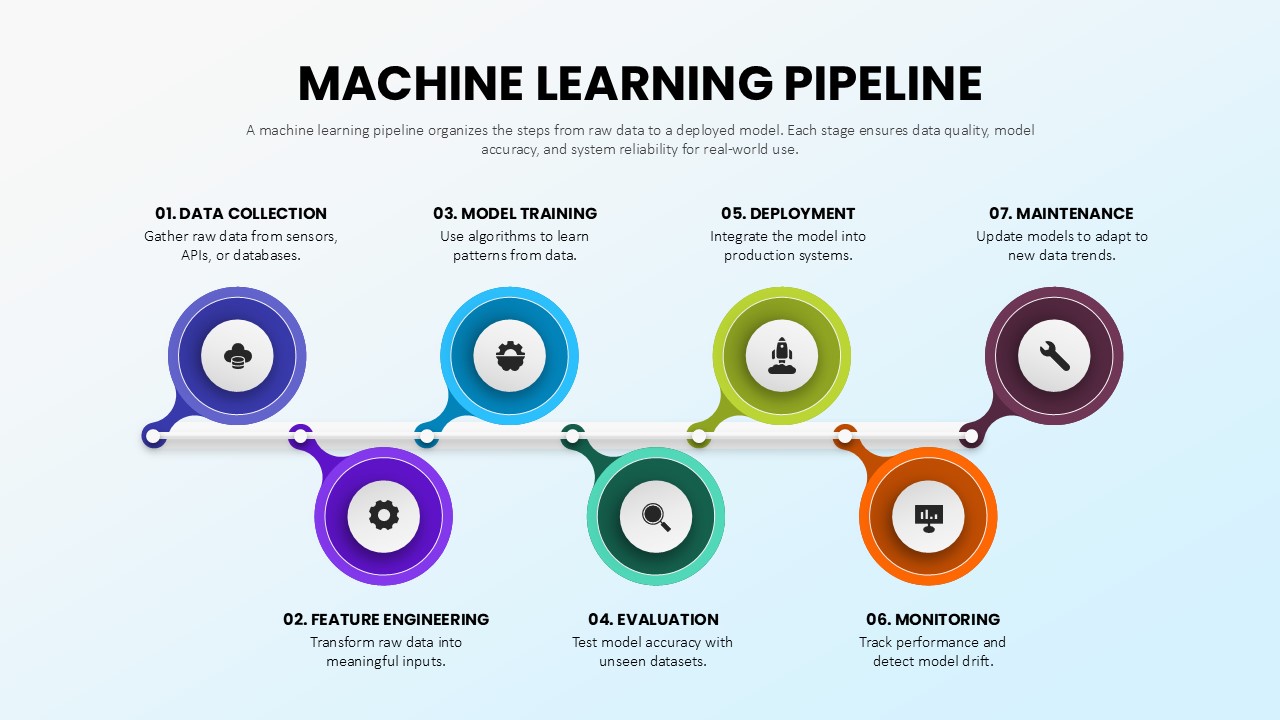
Seven Stage Machine Learning Pipeline Template for PowerPoint & Google Slides
Machine Learning
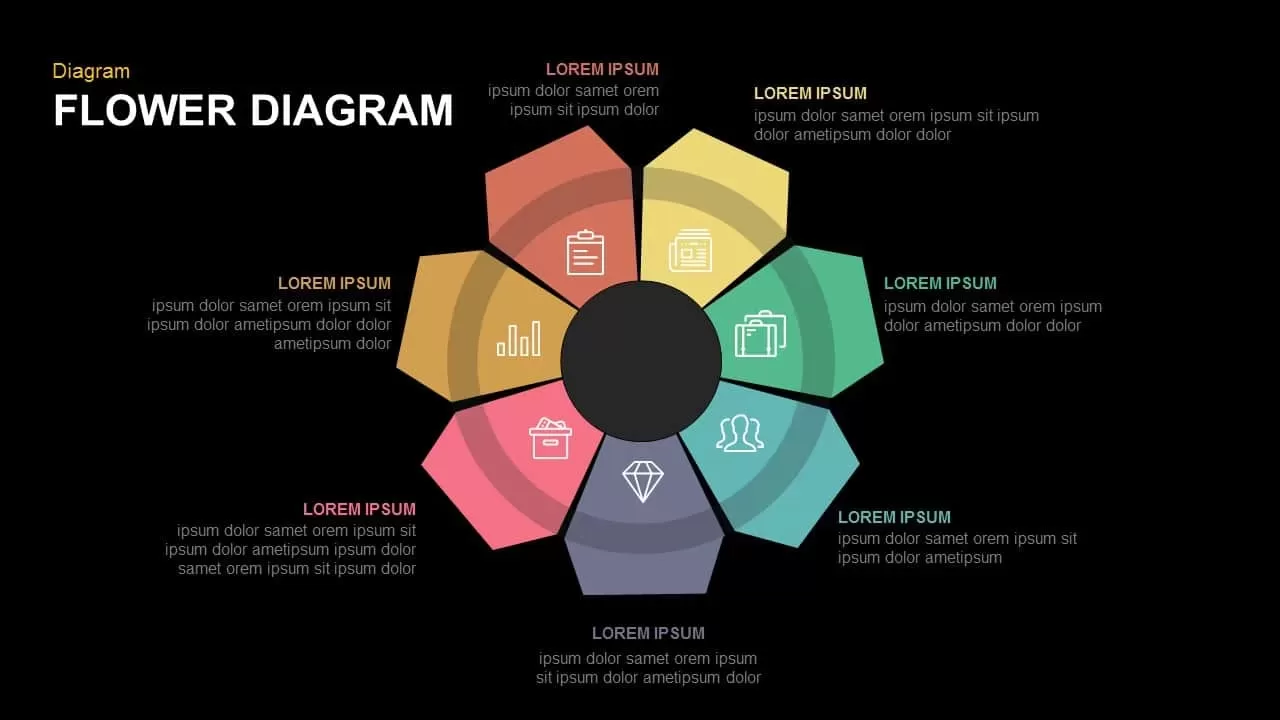
Seven-Step Flower Diagram Template for PowerPoint & Google Slides
Circular
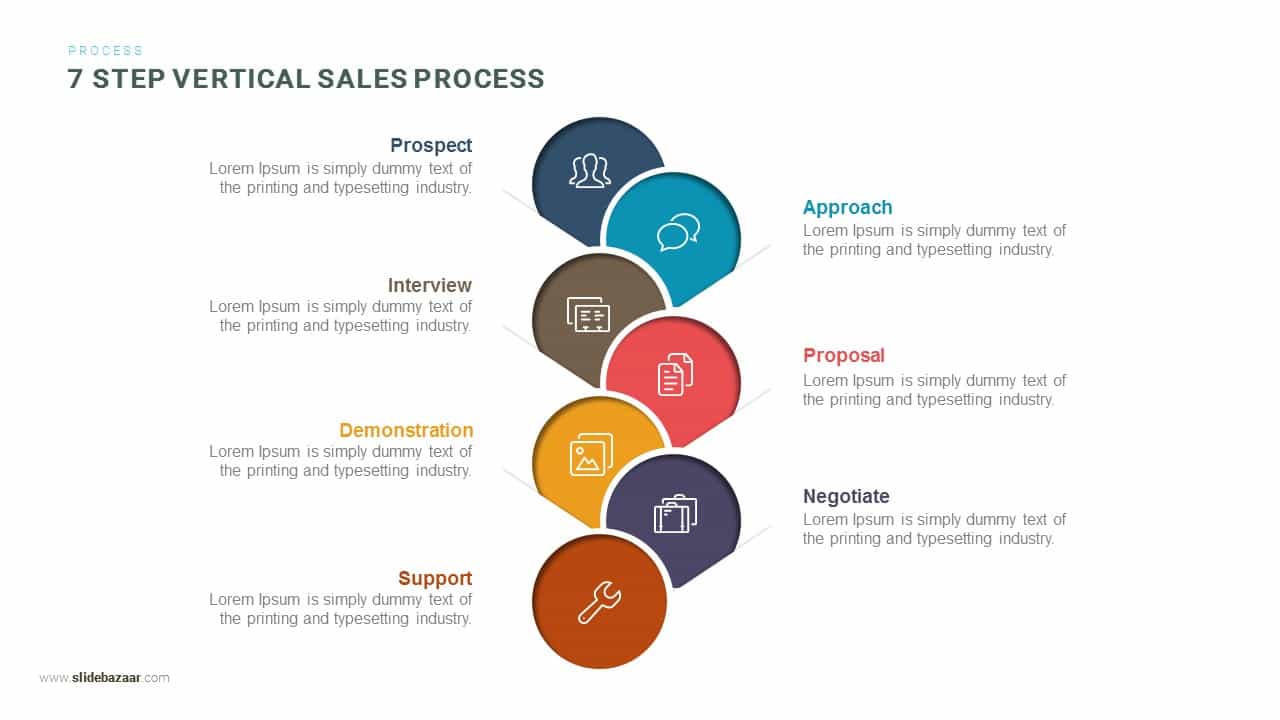
Seven-Step Vertical Sales Process Template for PowerPoint & Google Slides
Process
Seven-Segment Circular Arrow Diagram Template for PowerPoint & Google Slides
Arrow
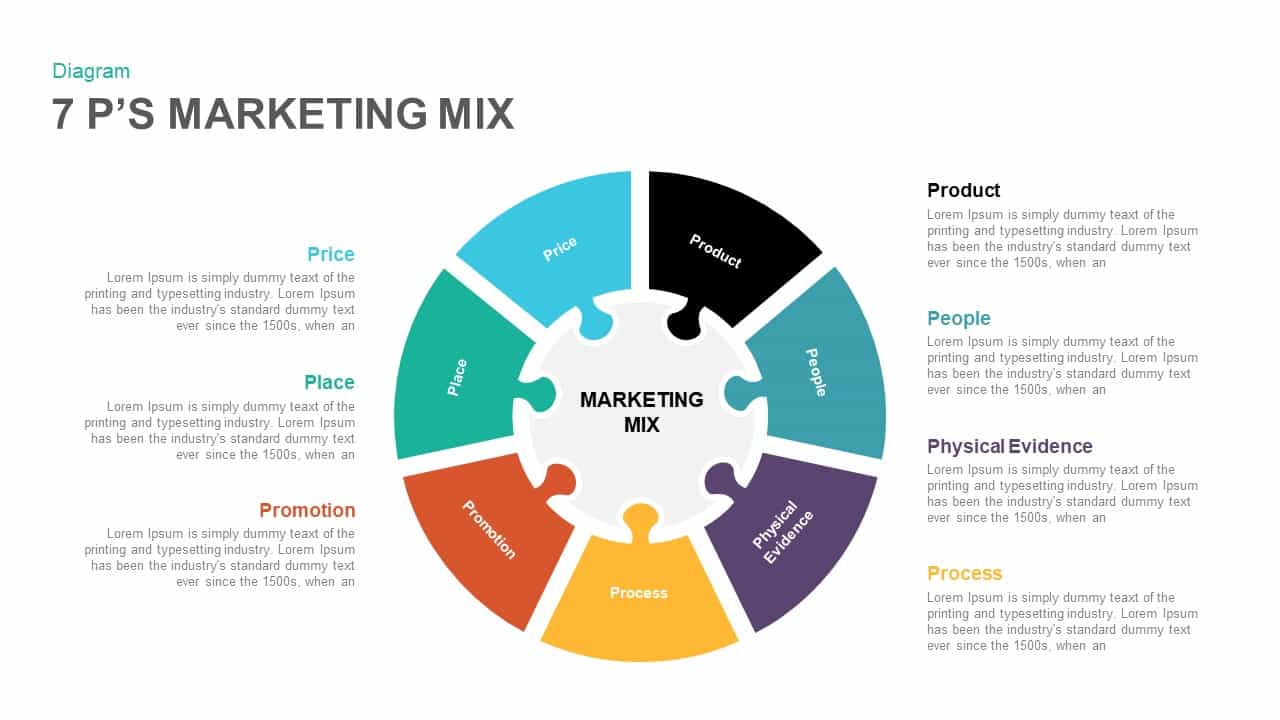
Seven-Part Marketing Mix Diagram Template for PowerPoint & Google Slides
Marketing
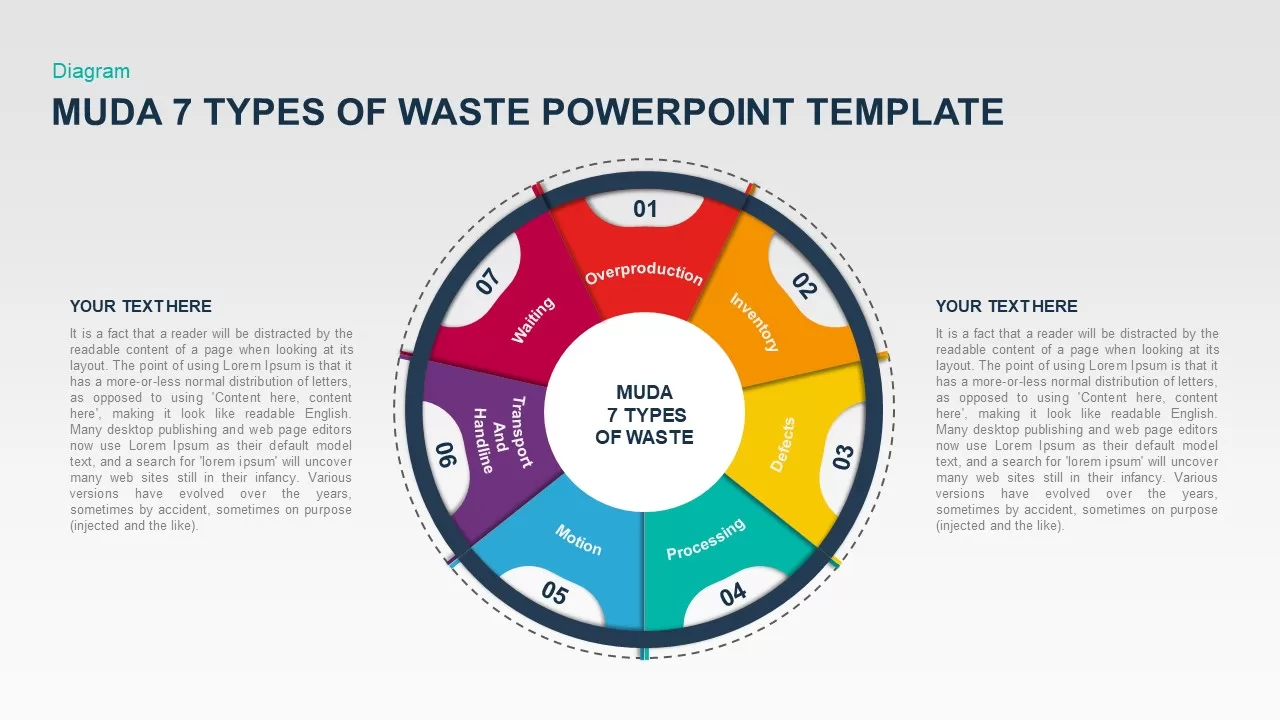
MUDA Seven Types of Waste Diagram Template for PowerPoint & Google Slides
Circular
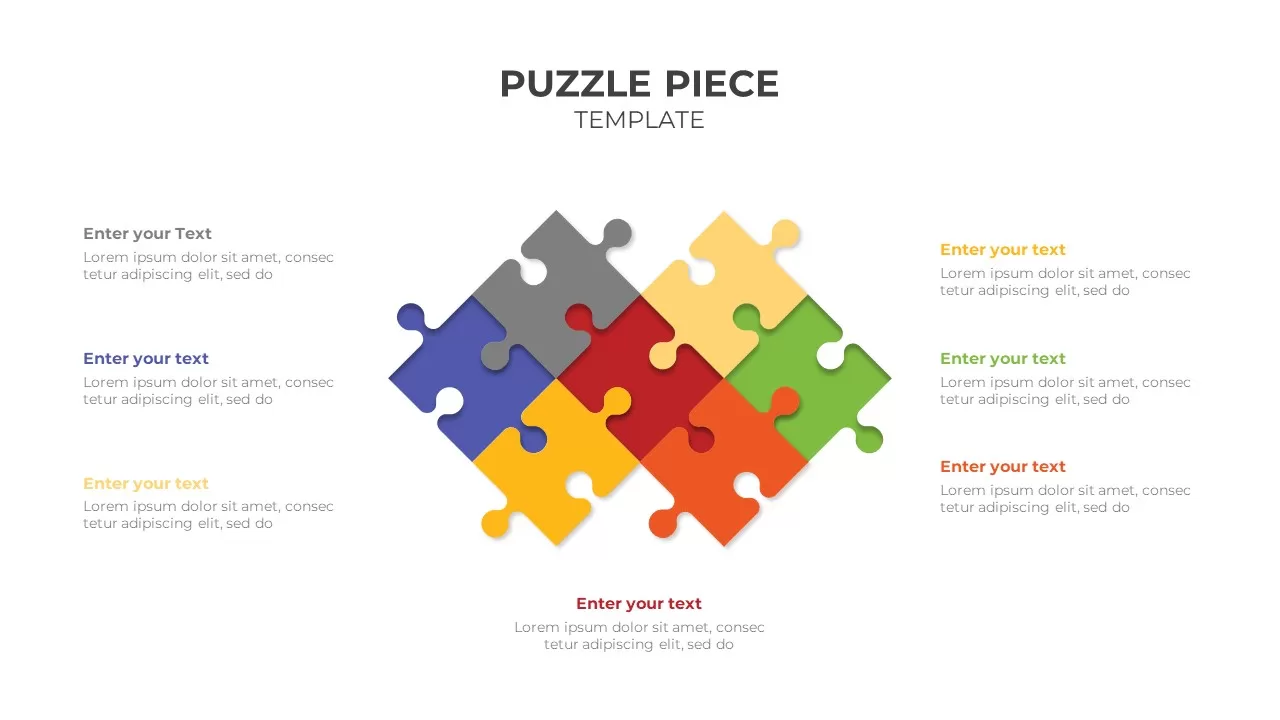
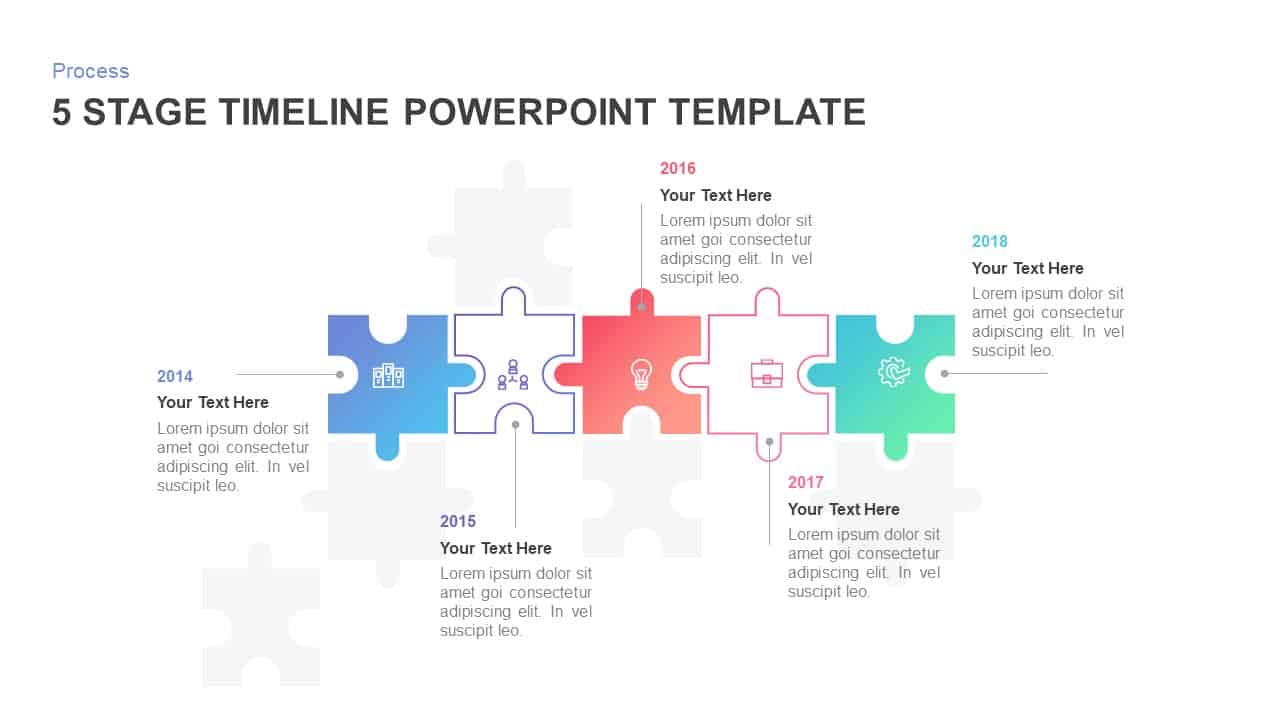
Colorful Seven-Piece Puzzle Diagram Template for PowerPoint & Google Slides
Process
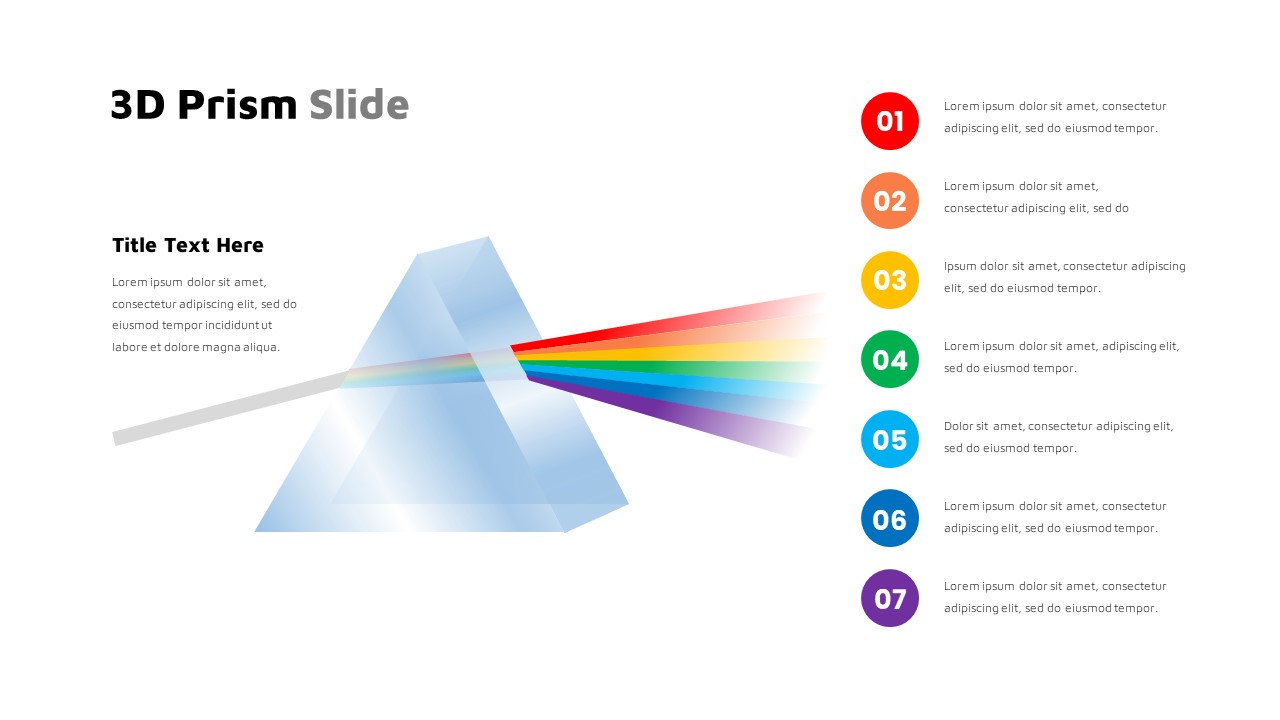
Modern Seven-Step 3D Prism Diagram Template for PowerPoint & Google Slides
Process
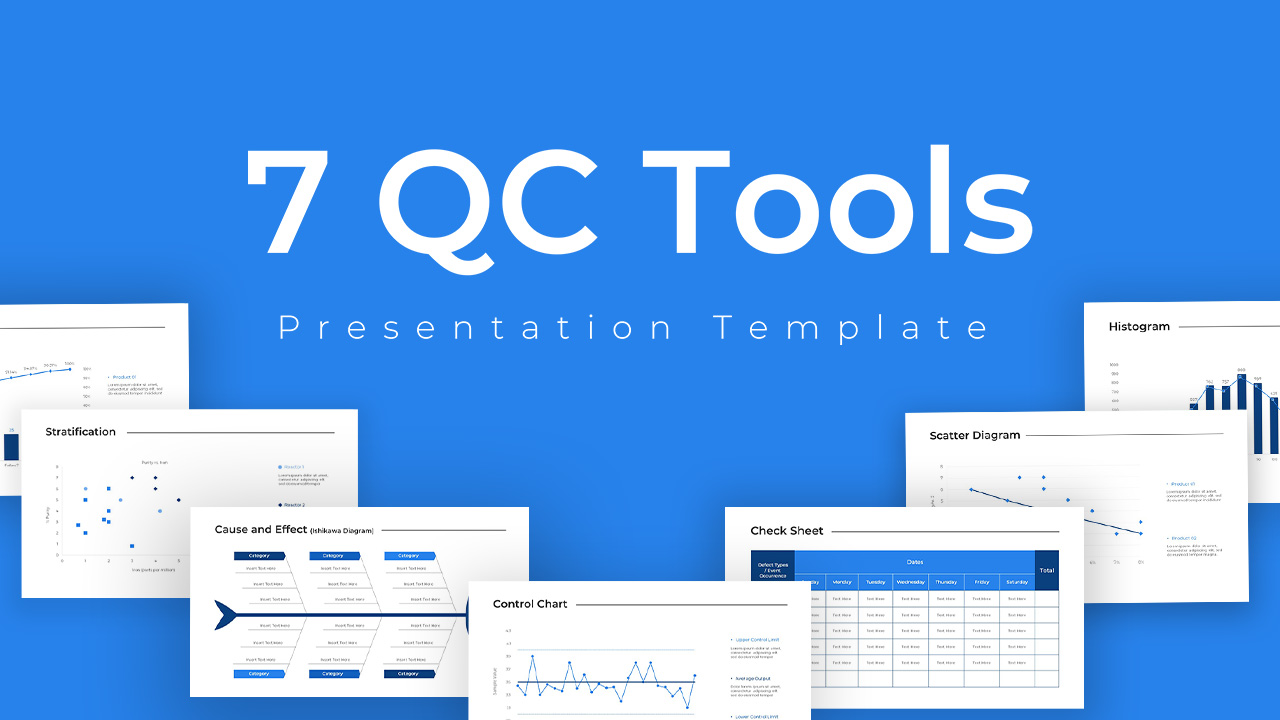
Seven Quality Control Tools Diagram Template for PowerPoint & Google Slides
Decks
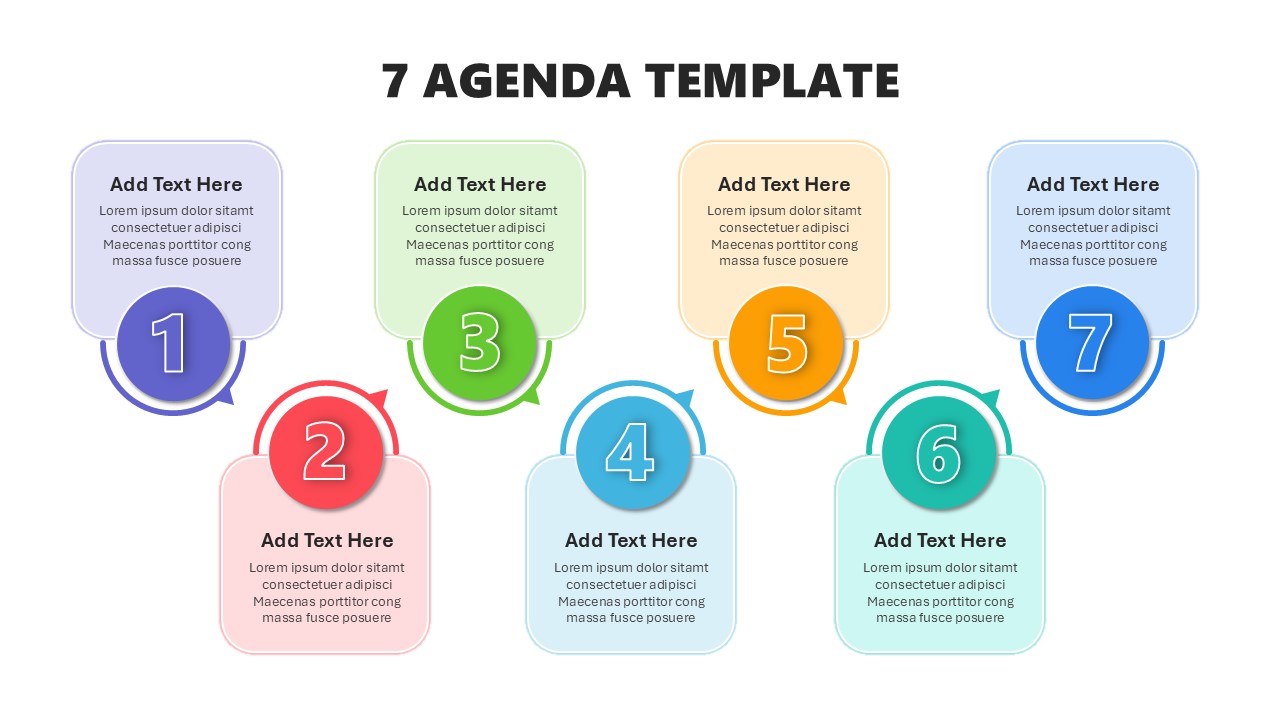
Colorful Seven-Item Agenda Slide Template for PowerPoint & Google Slides
Agenda
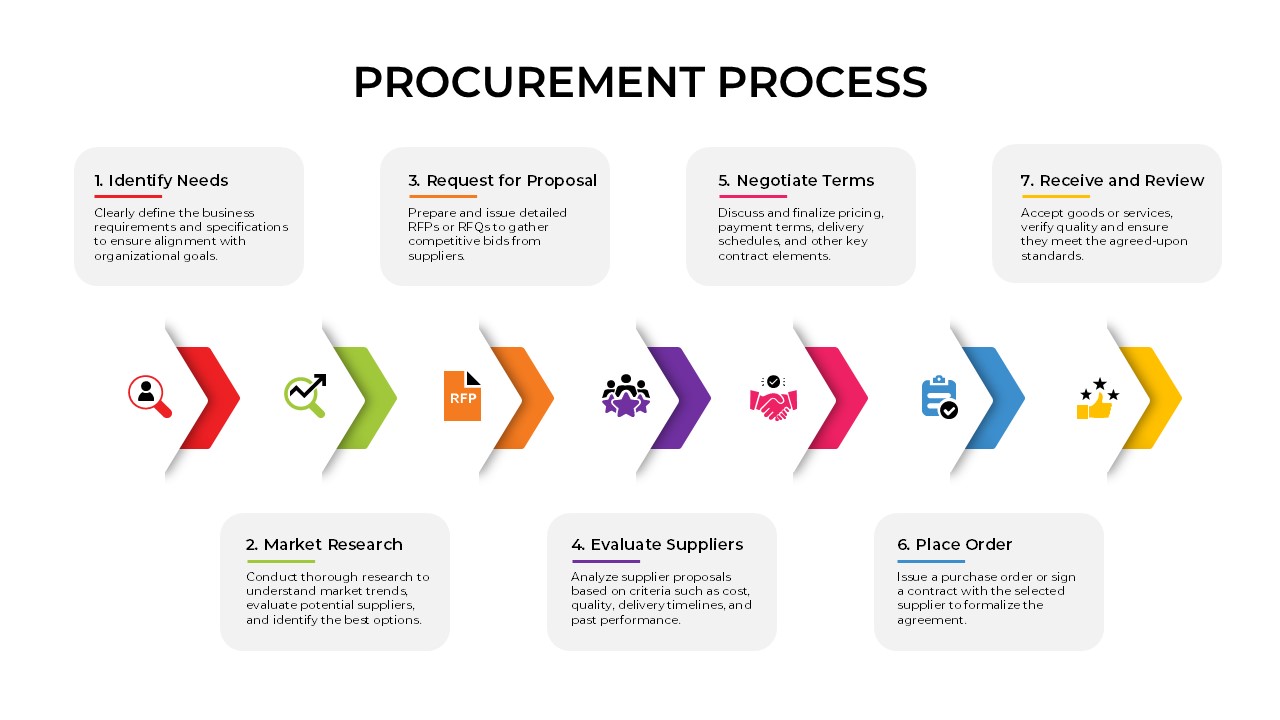
Seven-Step Procurement Process Diagram Template for PowerPoint & Google Slides
Process
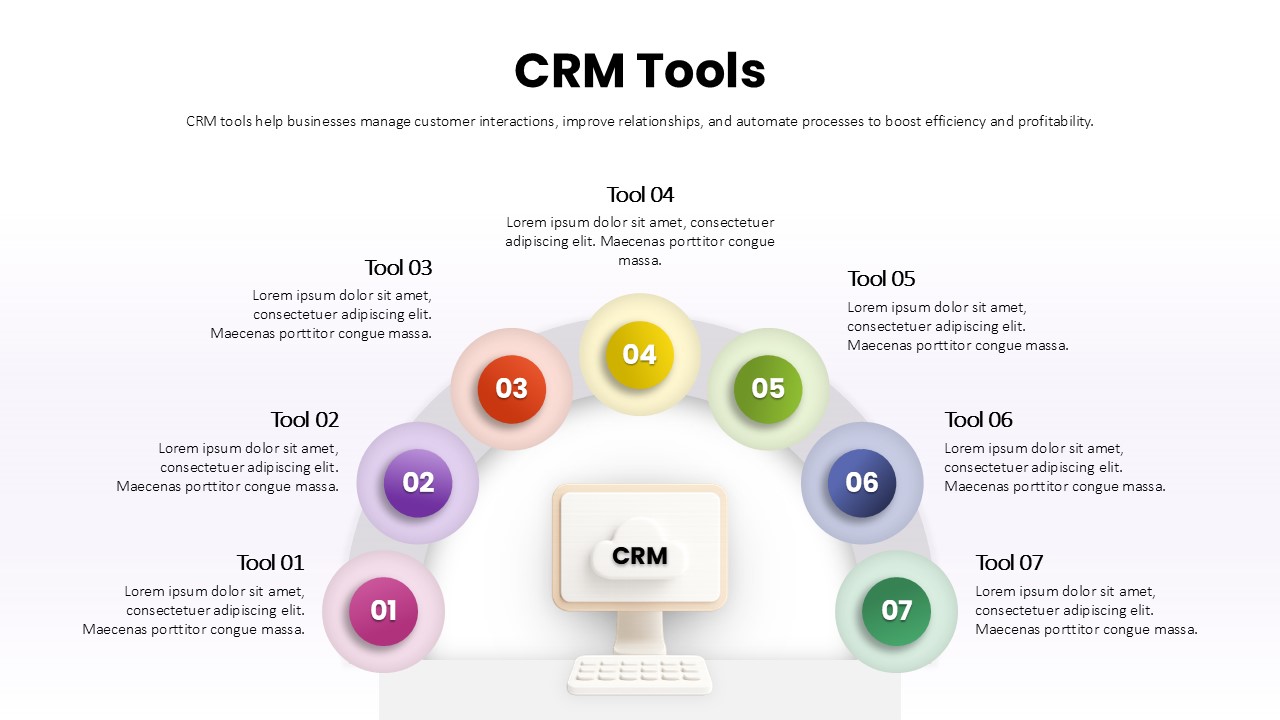
Seven-Part CRM Tools Arc Diagram Template for PowerPoint & Google Slides
Digital Marketing
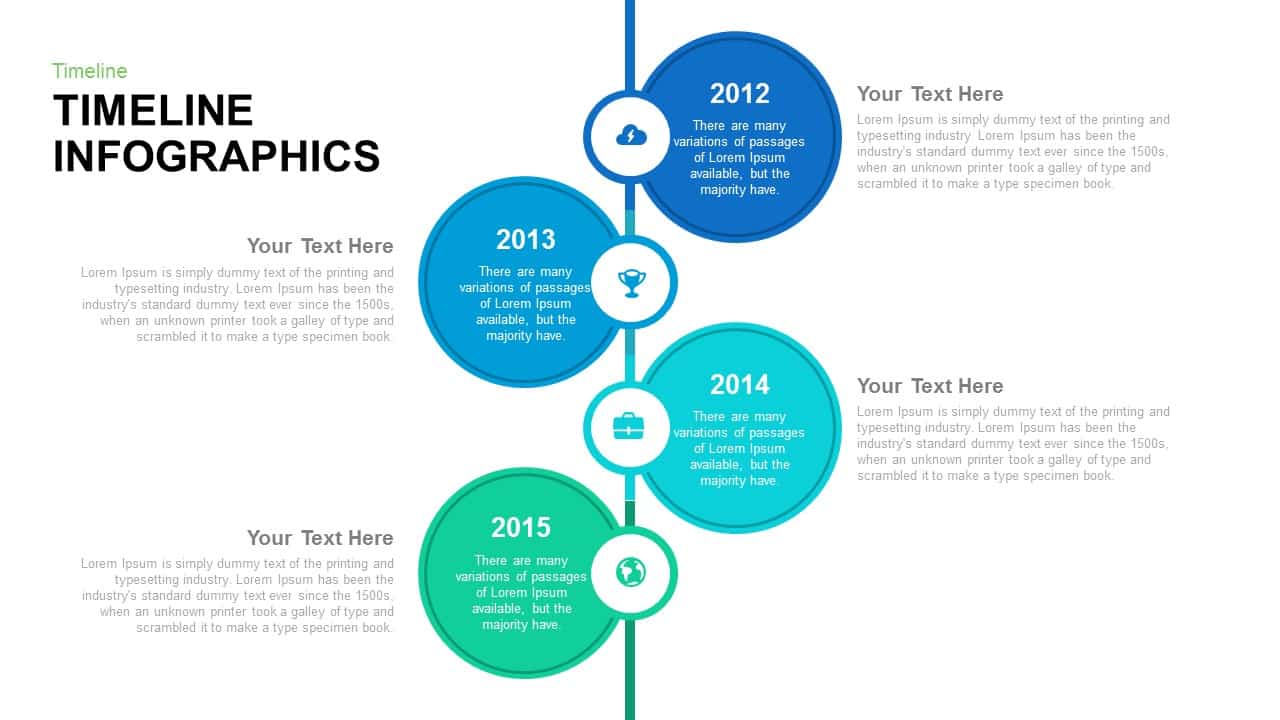
Multi-Stage Timeline Infographics Template for PowerPoint & Google Slides
Timeline
Five-Stage Arrow Infographics Timeline Template for PowerPoint & Google Slides
Arrow
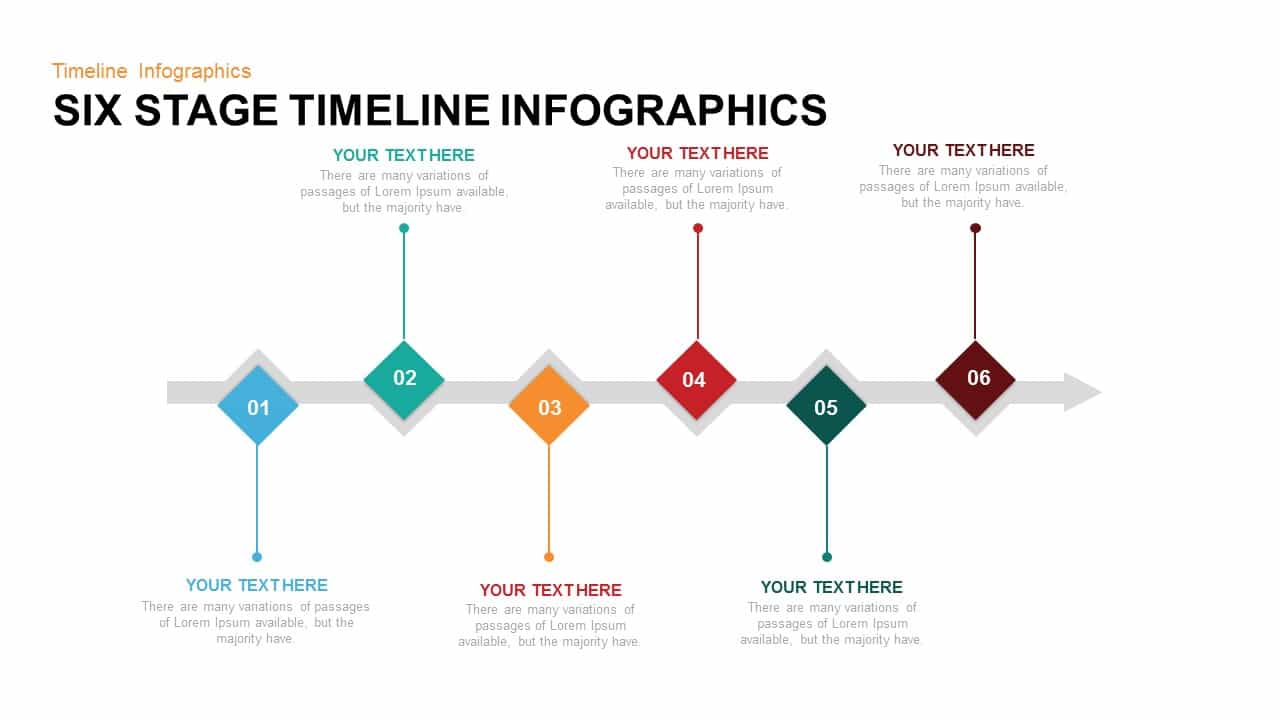
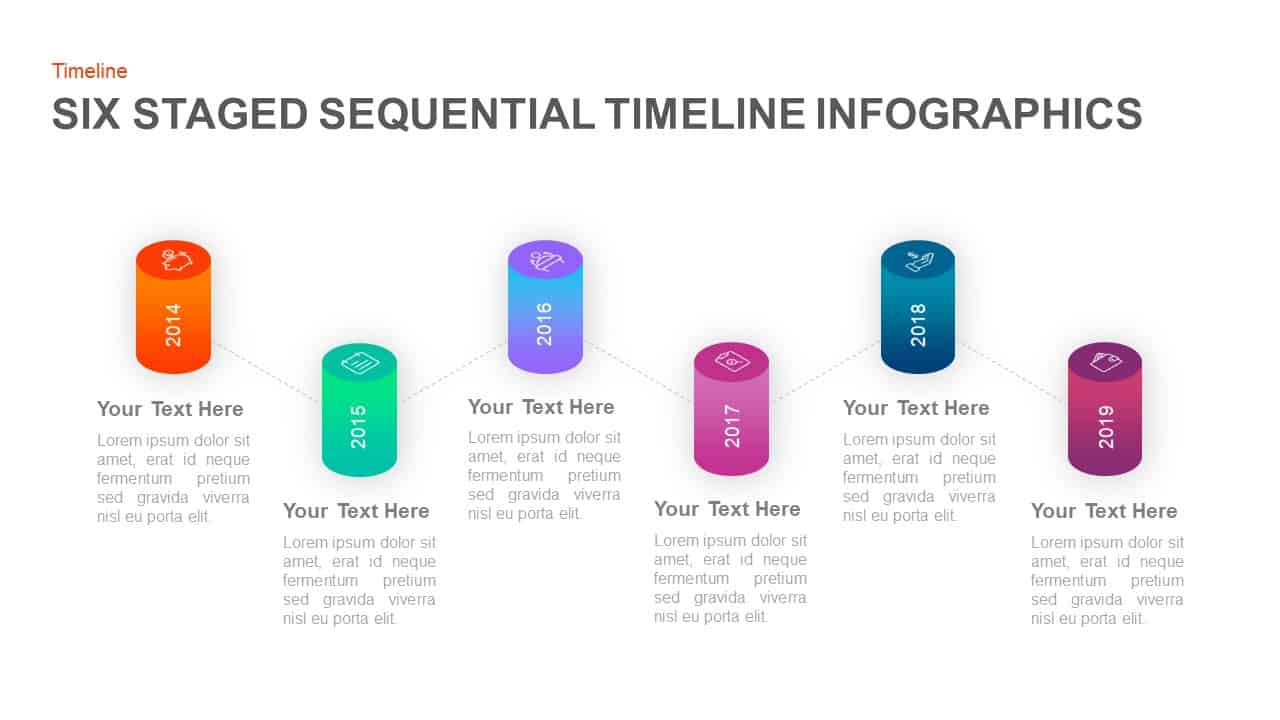
Six Stage Timeline Infographics Template for PowerPoint & Google Slides
Timeline
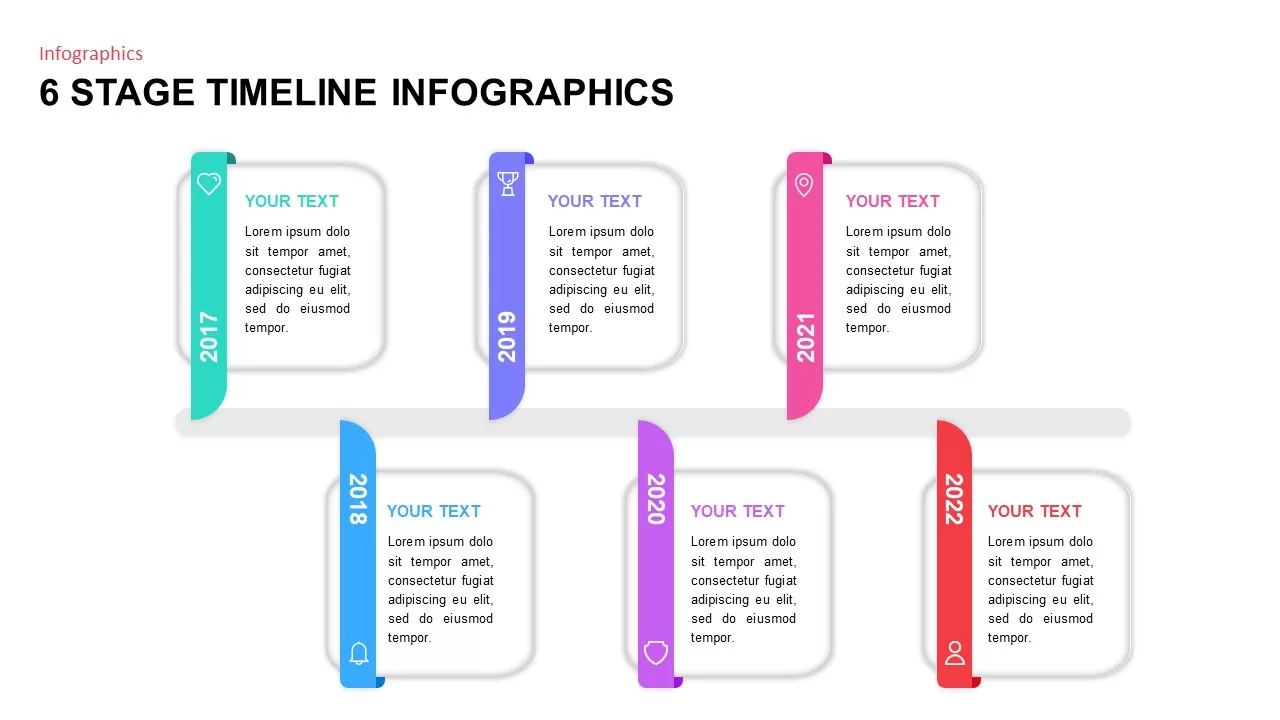
Six-Stage Timeline Infographics Slide Template for PowerPoint & Google Slides
Timeline
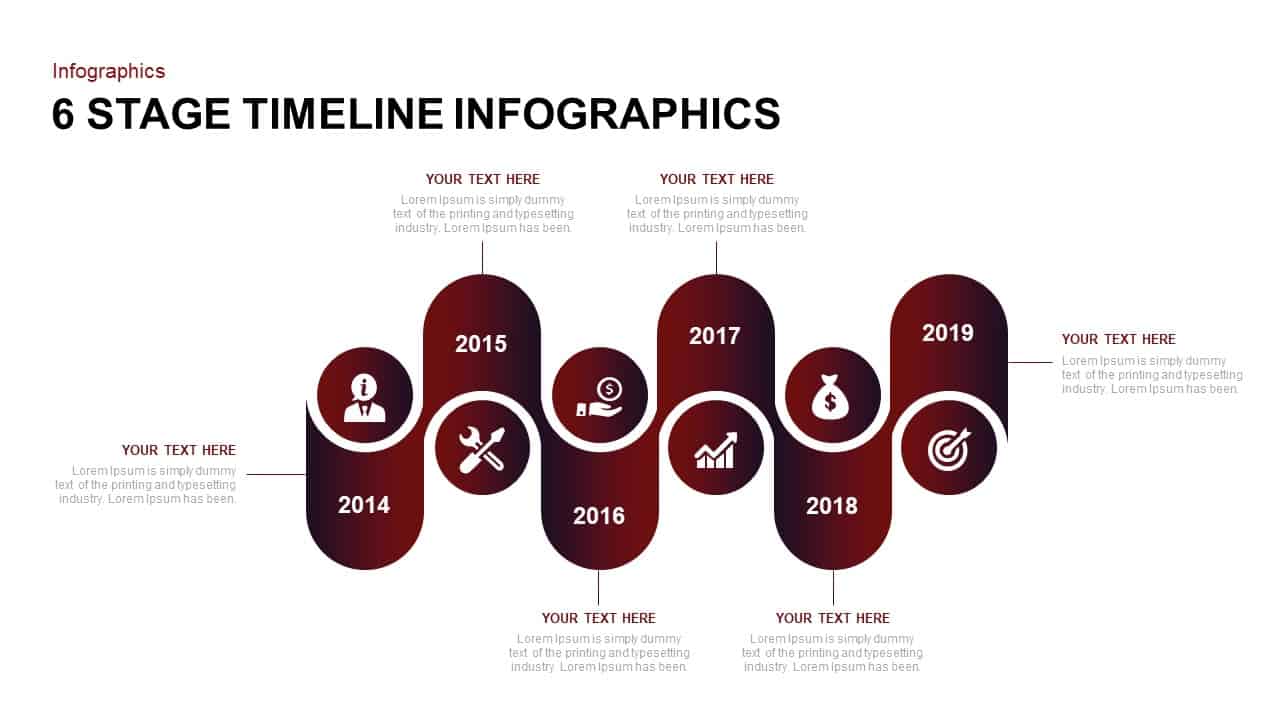
6 Stage Timeline Infographics template for PowerPoint & Google Slides
Timeline
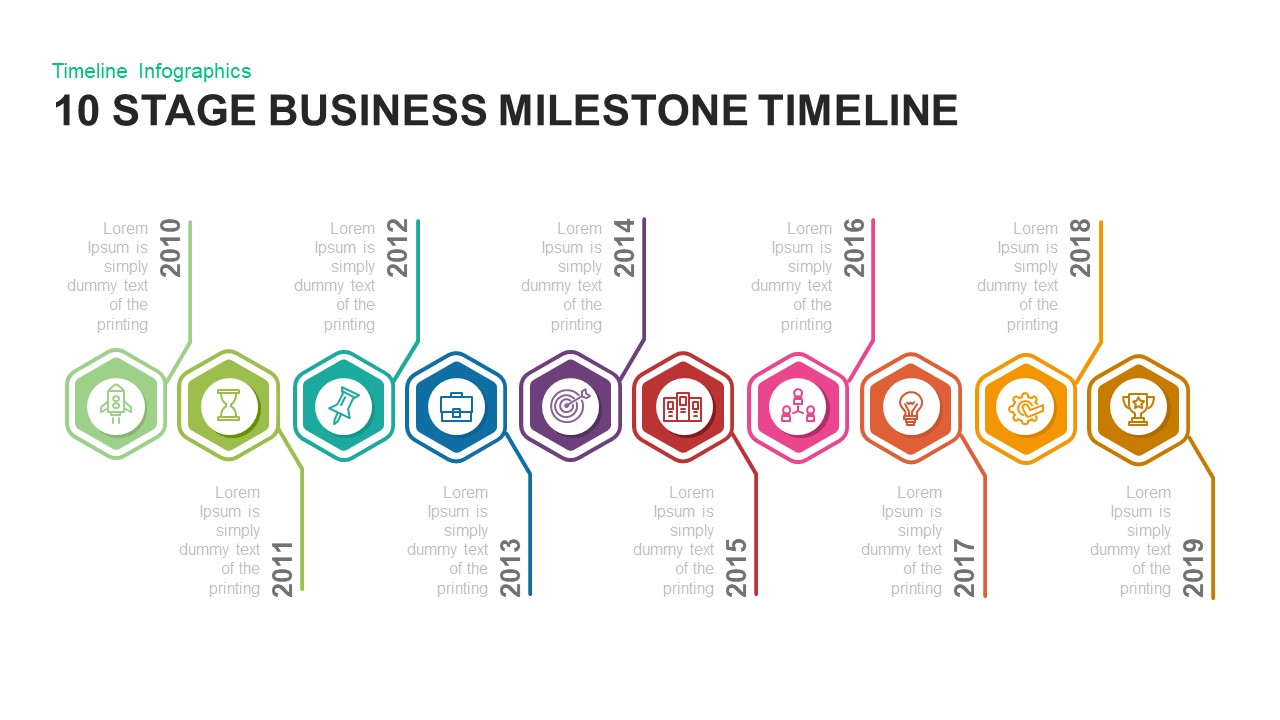
10 Stage Business Milestone Timeline PowerPoint Template for PowerPoint & Google Slides
Timeline
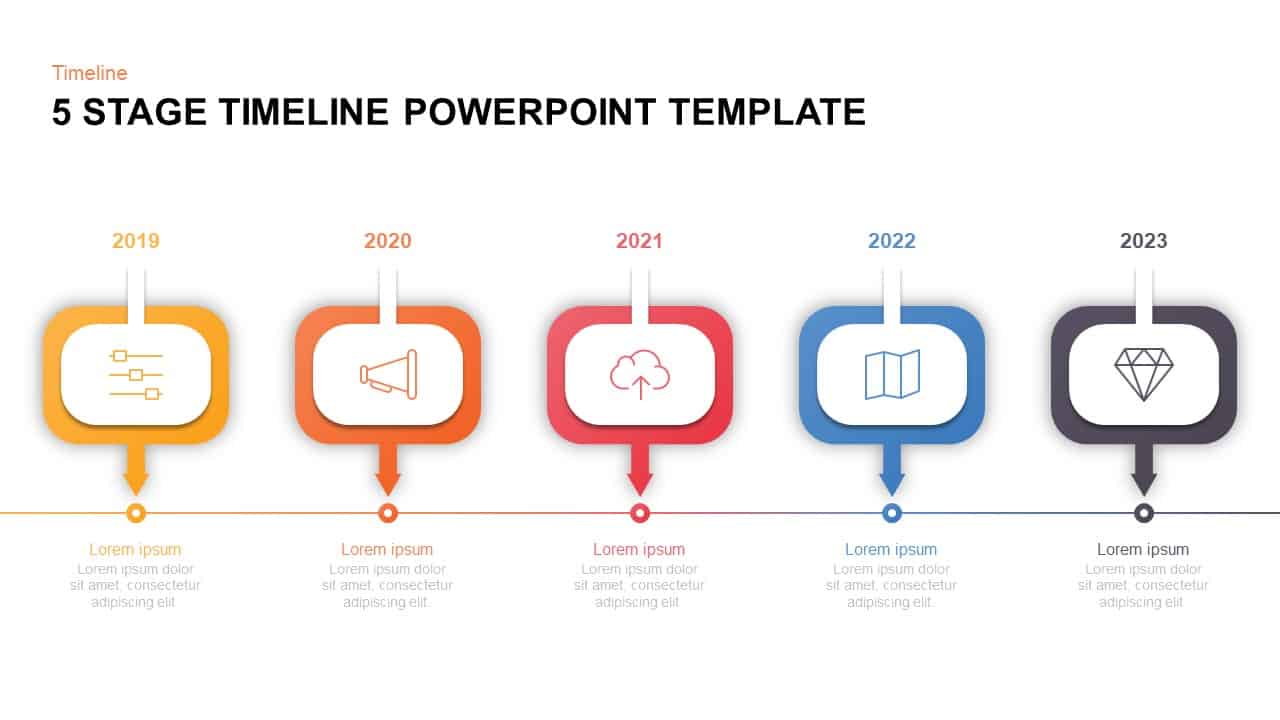
7-Stage Colorful Timeline Infographic Template for PowerPoint & Google Slides
Timeline
Three Four Five Stage Timeline Infographic Template for PowerPoint & Google Slides
Timeline
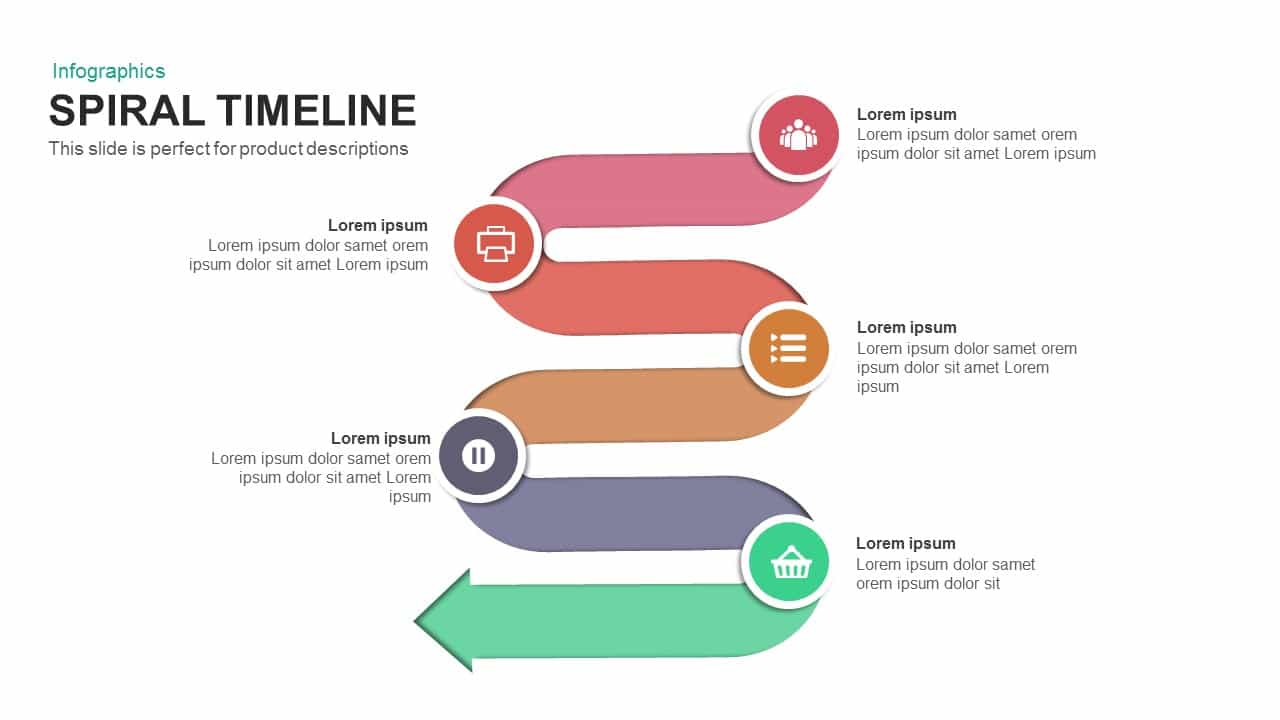
Six-Stage Colorful Spiral Timeline Template for PowerPoint & Google Slides
Timeline
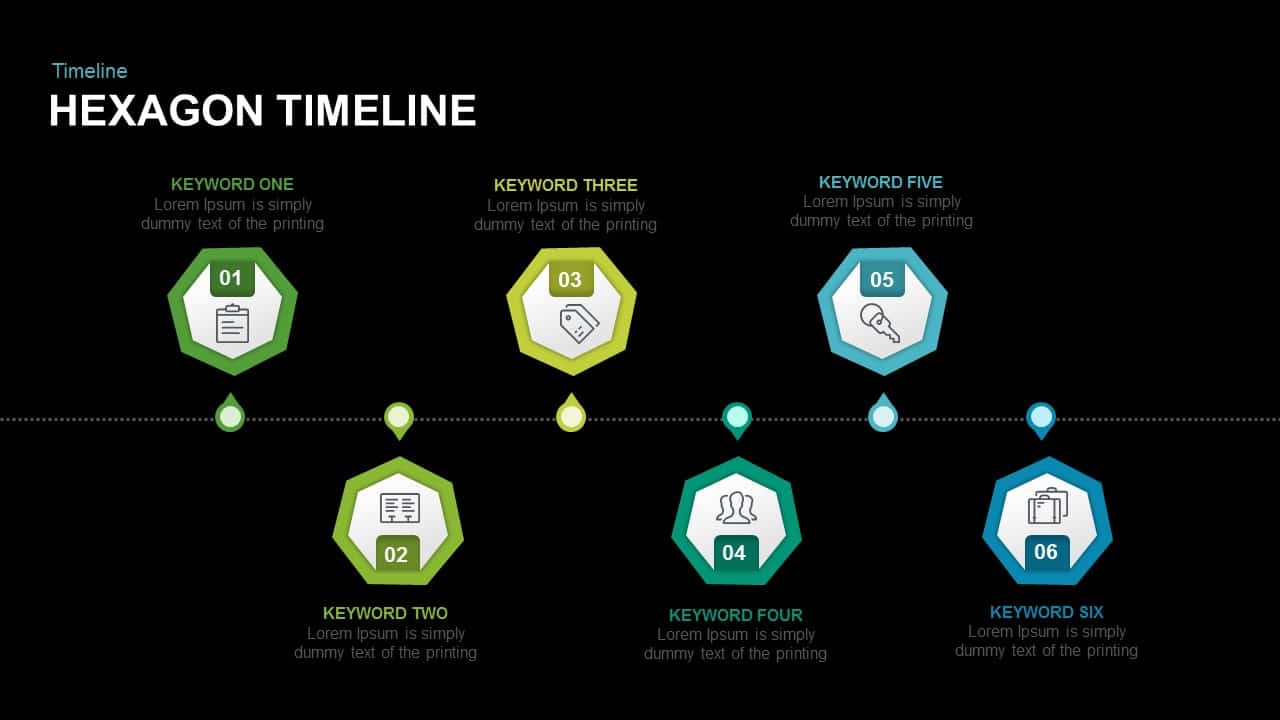
Six-Stage Hexagon Timeline Infographic Template for PowerPoint & Google Slides
Timeline
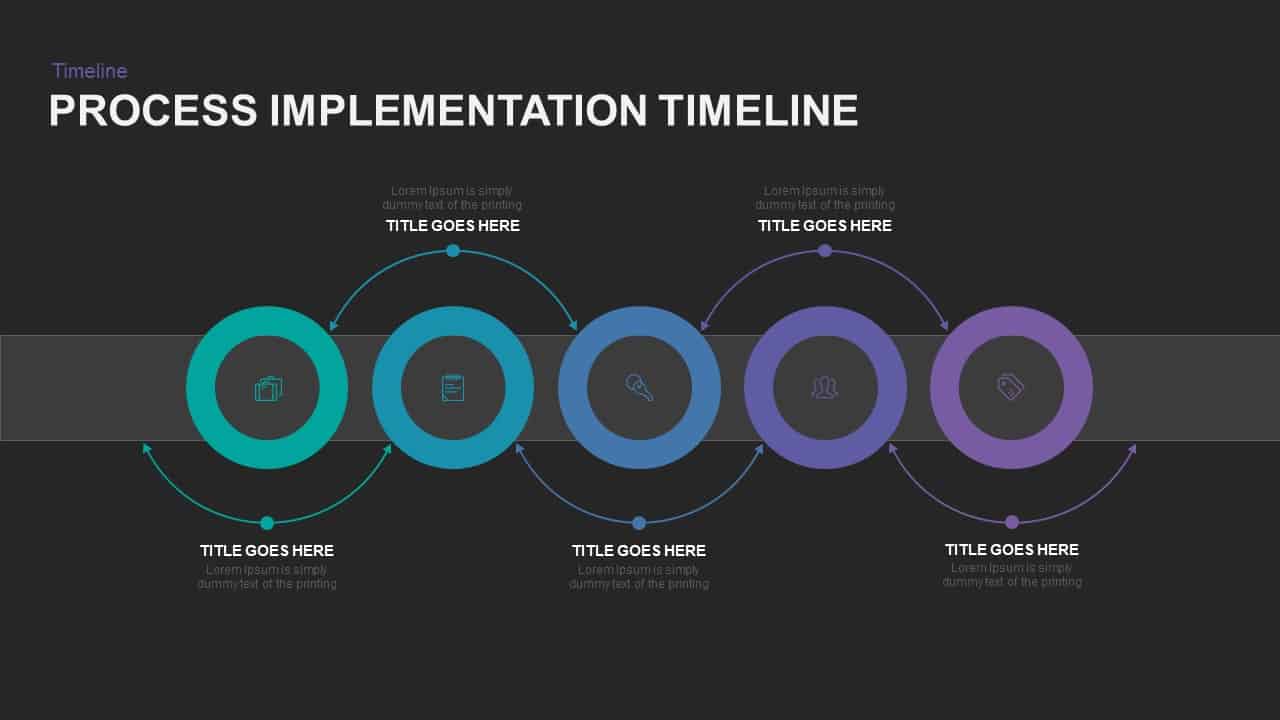
5-Stage Process Implementation Timeline Template for PowerPoint & Google Slides
Timeline
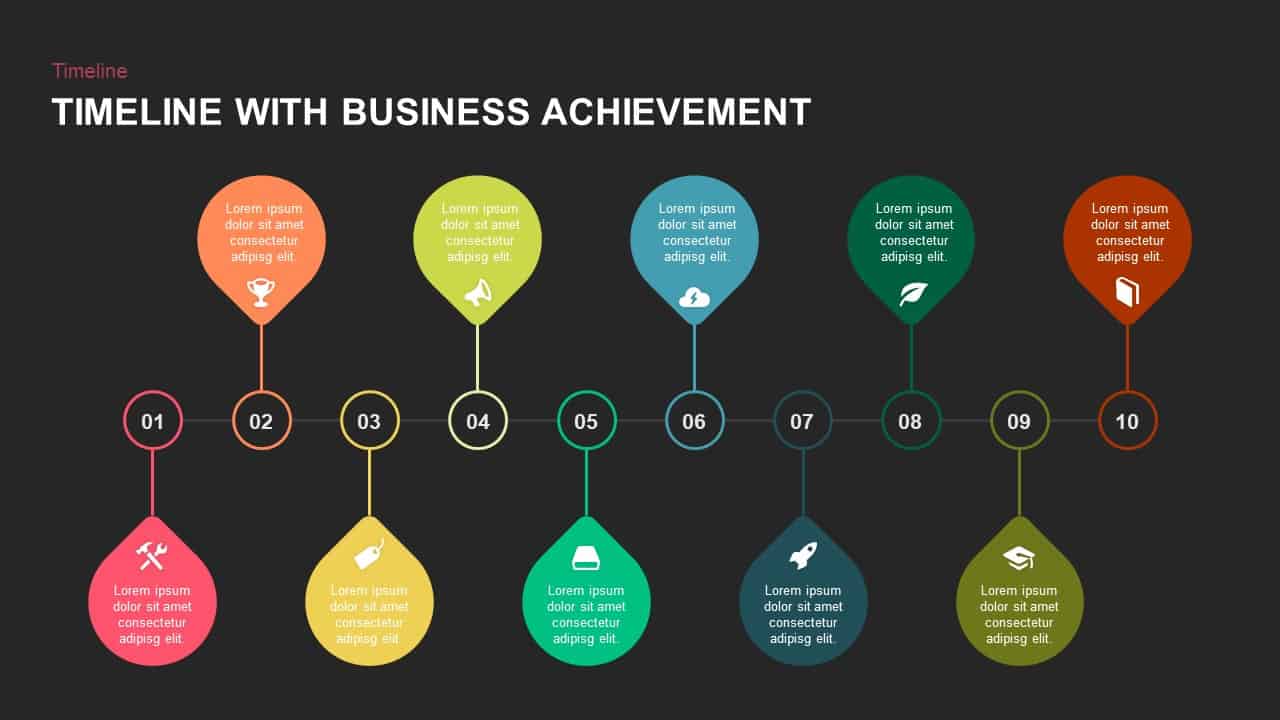
10-Stage Timeline with Business Achievements Template for PowerPoint & Google Slides
Timeline
Animated 5-Stage Puzzle Timeline Infographic Template for PowerPoint & Google Slides
Timeline
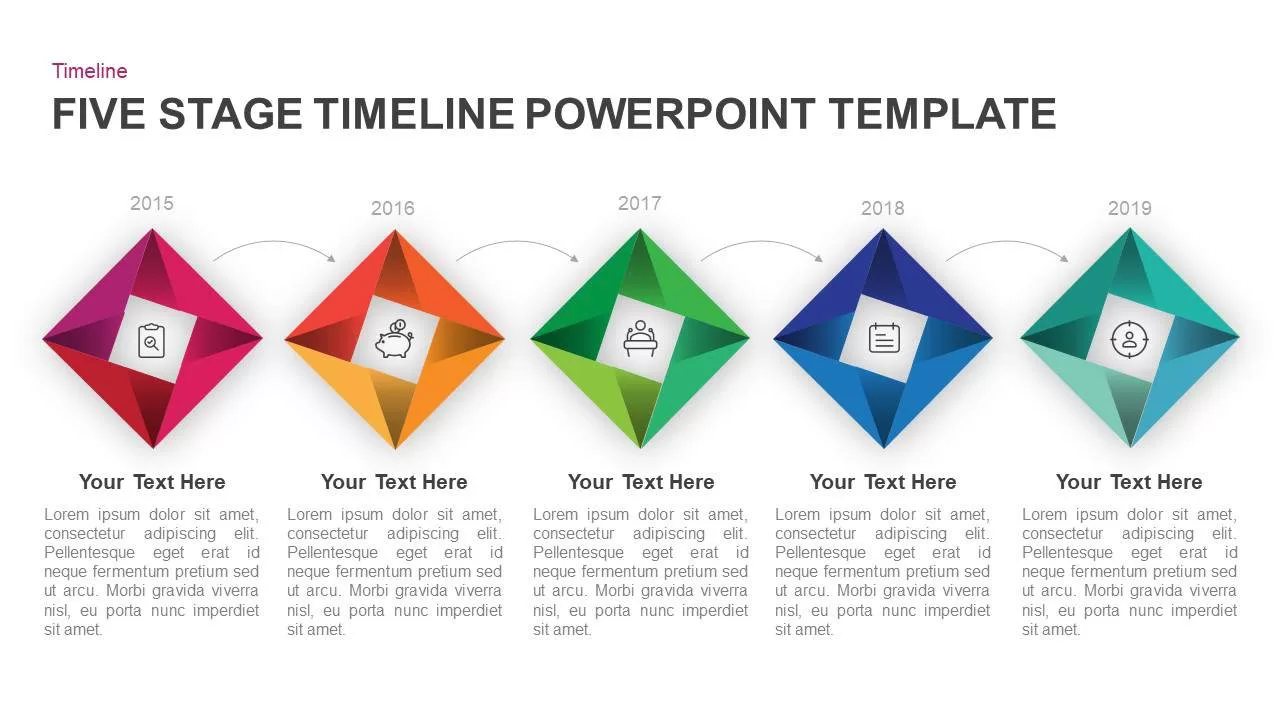
Five-Stage Diamond Timeline Chart Template for PowerPoint & Google Slides
Timeline
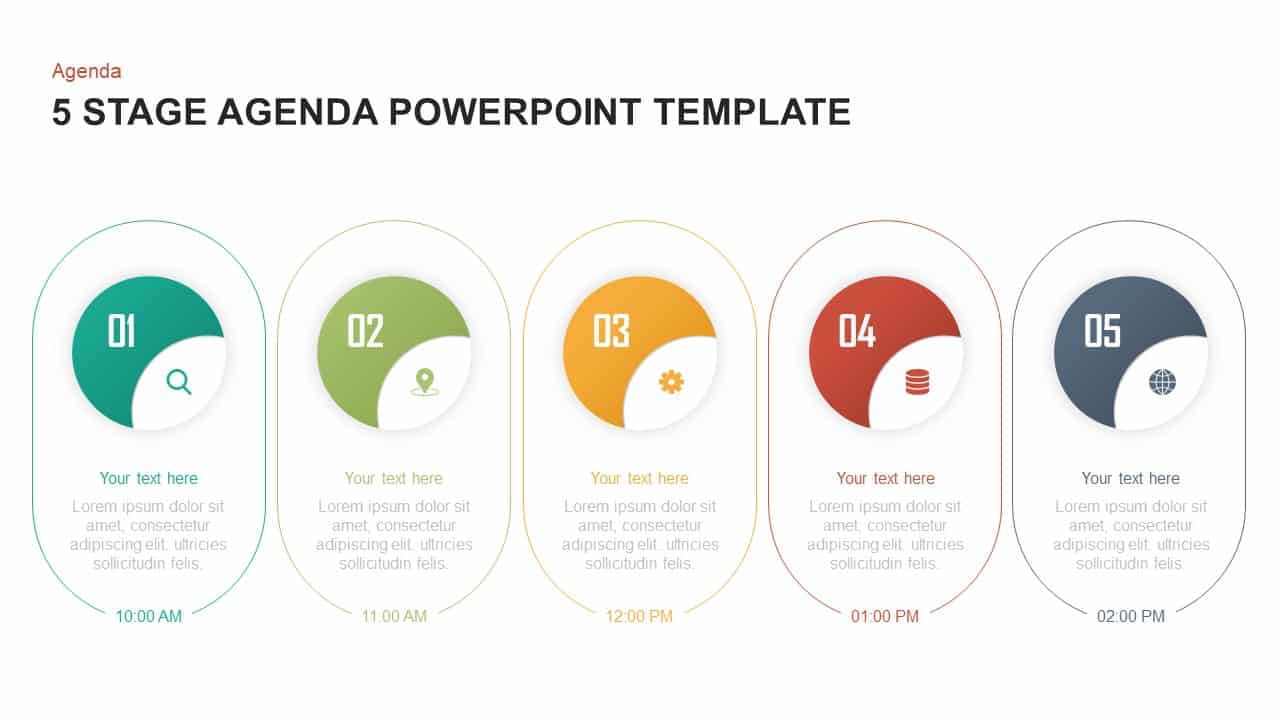
5 Stage Agenda Timeline Carousel Template for PowerPoint & Google Slides
Agenda
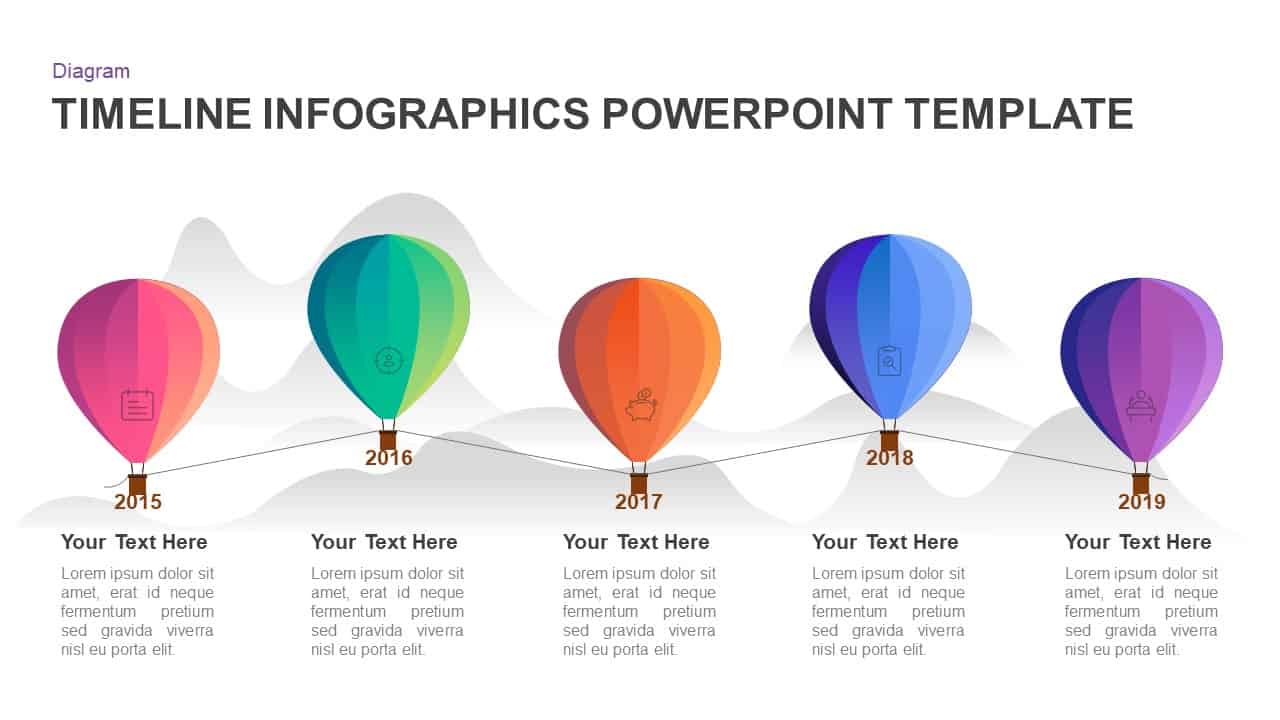
5-Stage Hot-Air Balloon Timeline Template for PowerPoint & Google Slides
Timeline
5 Stage Circular Timeline Infographic Template for PowerPoint & Google Slides
Timeline
Six-Stage Arrow Timeline Diagram Template for PowerPoint & Google Slides
Timeline
Five-Stage Slanted Timeline Diagram Template for PowerPoint & Google Slides
Timeline
Six-Stage Timeline Infographic Template for PowerPoint & Google Slides
Timeline
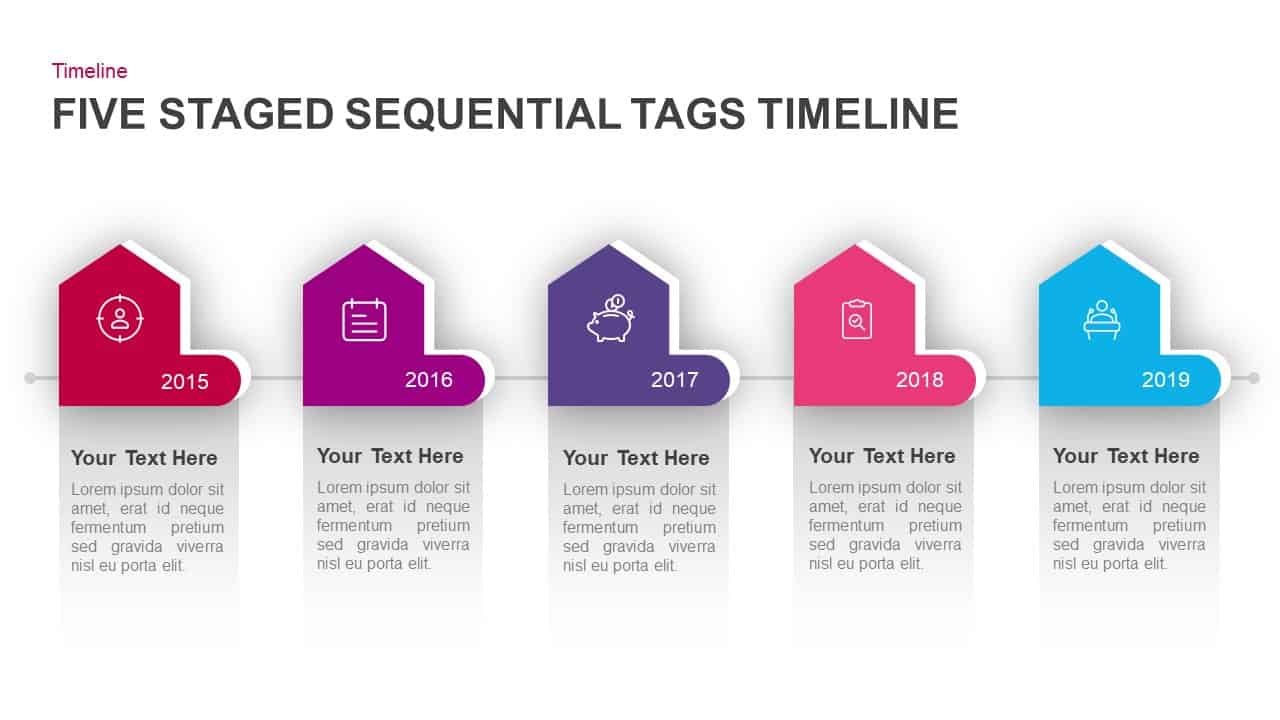
Five-Stage Sequential Tags Timeline Template for PowerPoint & Google Slides
Timeline
Six Stage Agenda Timeline Diagram template for PowerPoint & Google Slides
Agenda
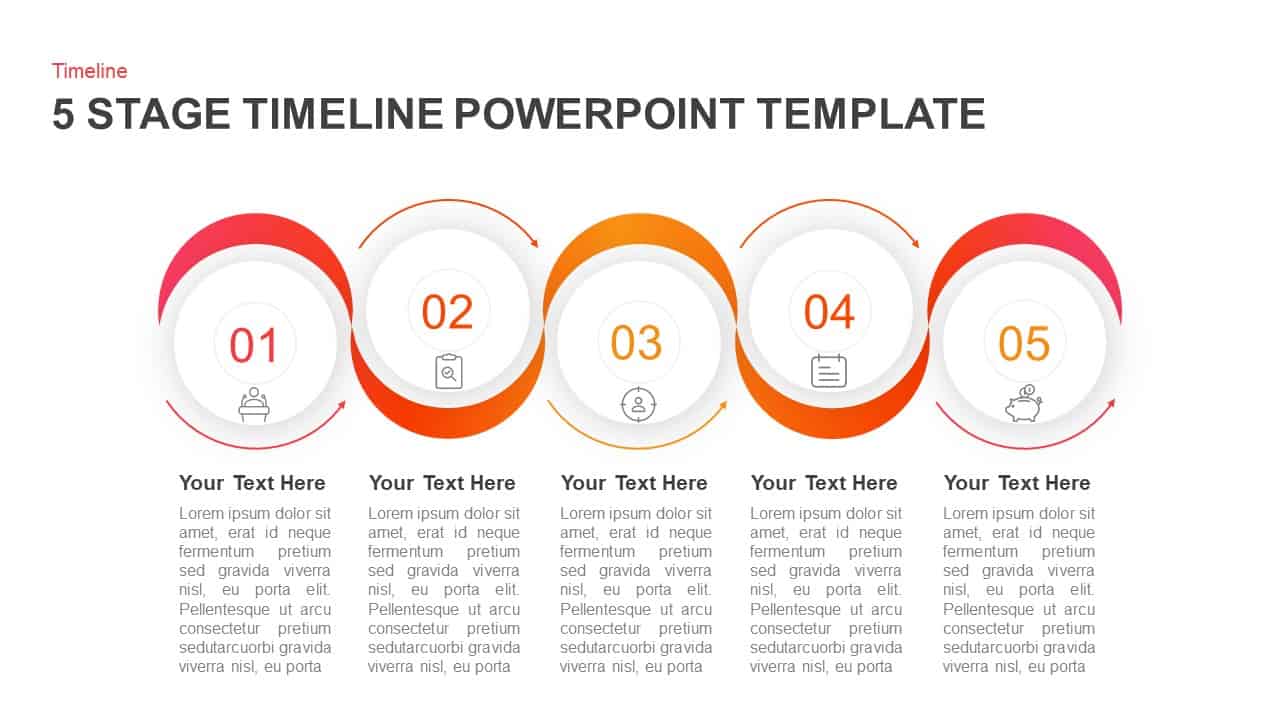
5 Stage Timeline Infographic Slide Template for PowerPoint & Google Slides
Timeline
5-Stage Financial Growth Timeline Template for PowerPoint & Google Slides
Timeline
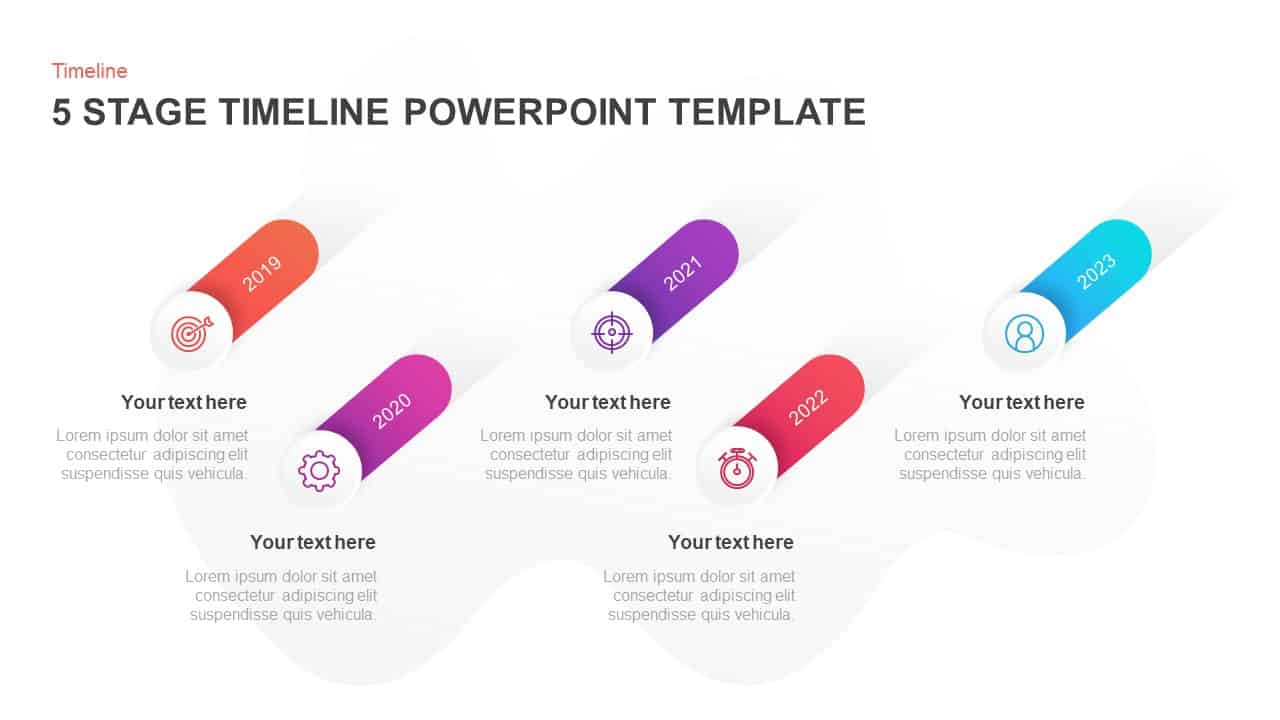
5-Stage Timeline Infographic Slide Template for PowerPoint & Google Slides
Timeline
Six-Stage Road Map Infographic Timeline Template for PowerPoint & Google Slides
Roadmap
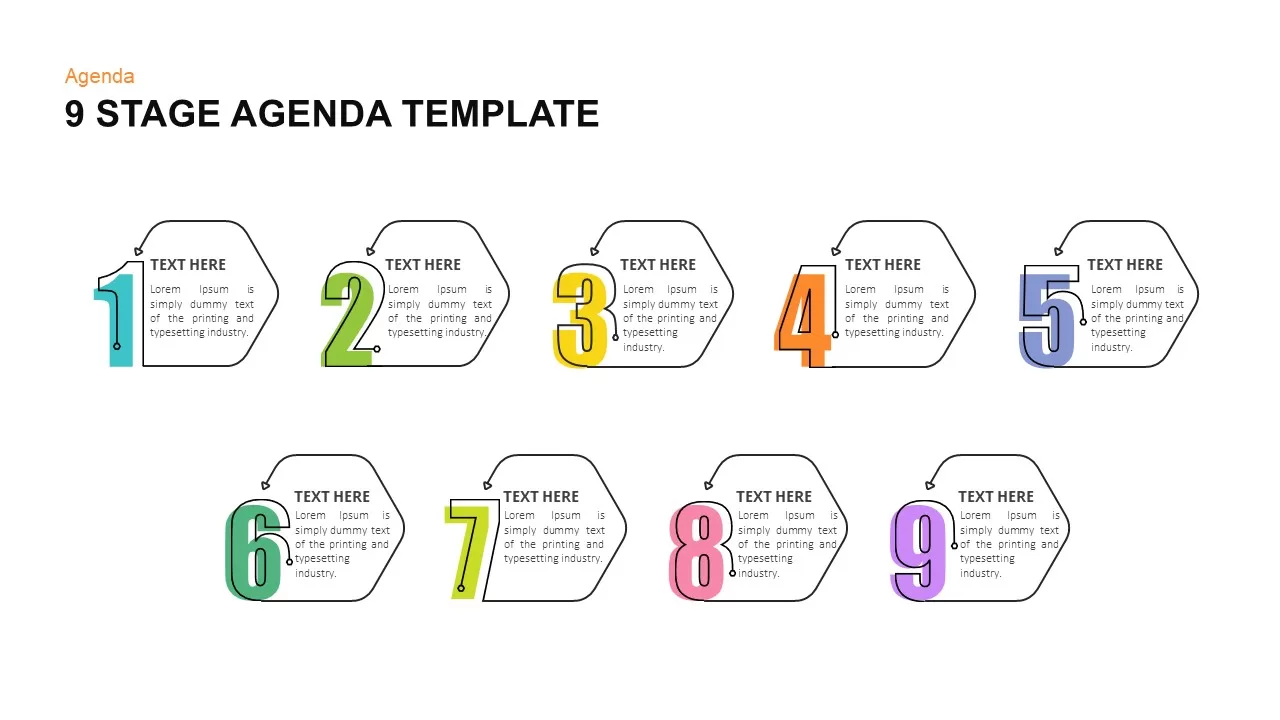
Clock-Timeline Nine-Stage Agenda Template for PowerPoint & Google Slides
Agenda
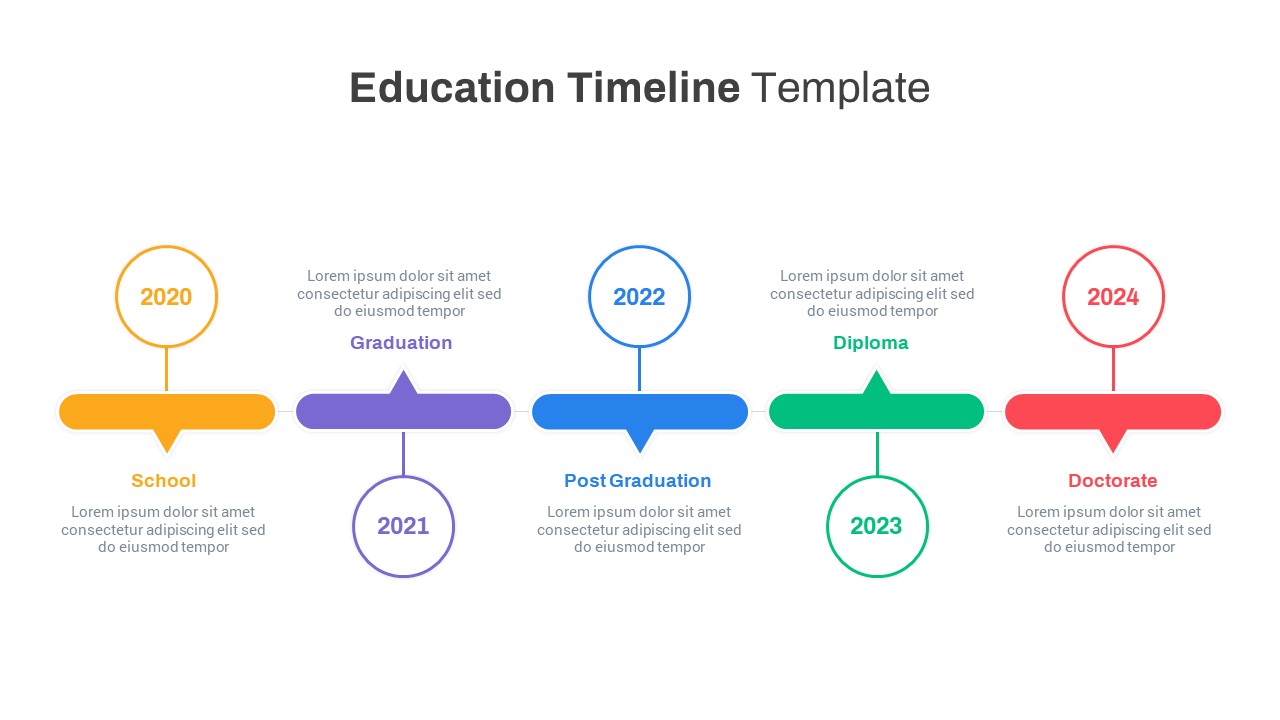
Colorful Five-Stage Education Timeline Template for PowerPoint & Google Slides
Timeline
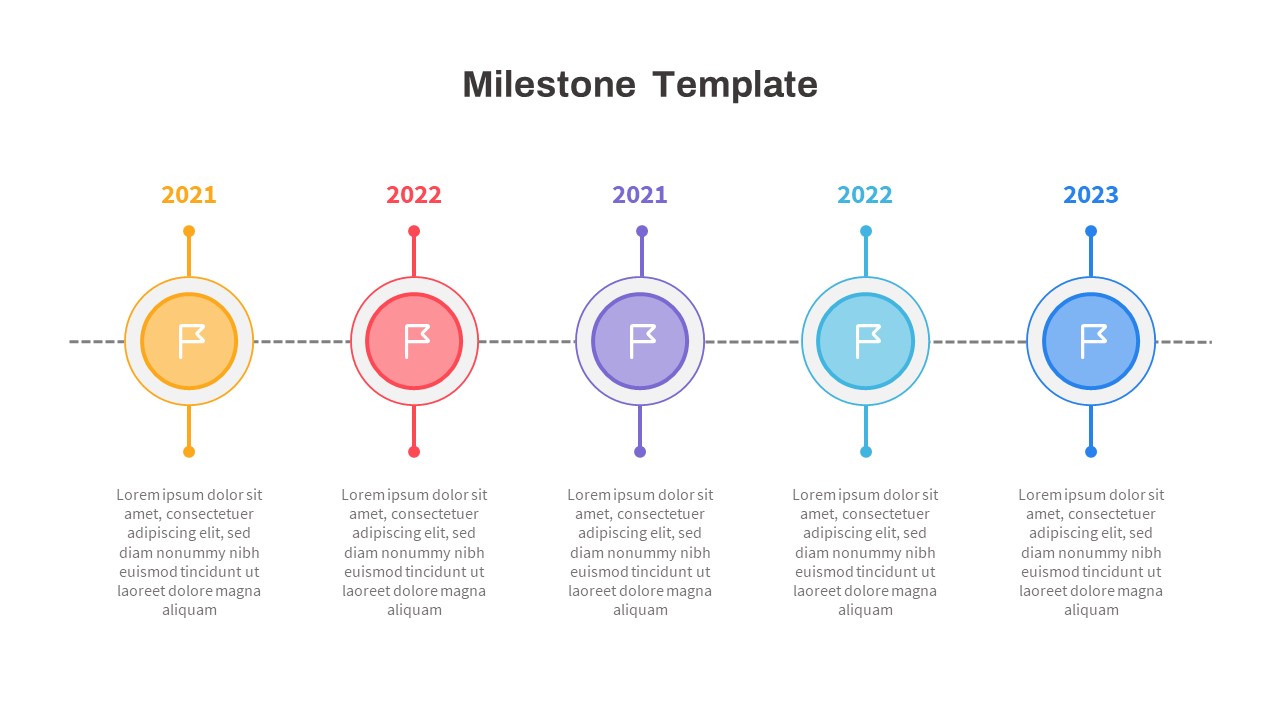
Free Multicolor Five-Stage Milestone Timeline Template for PowerPoint & Google Slides
Timeline
Free
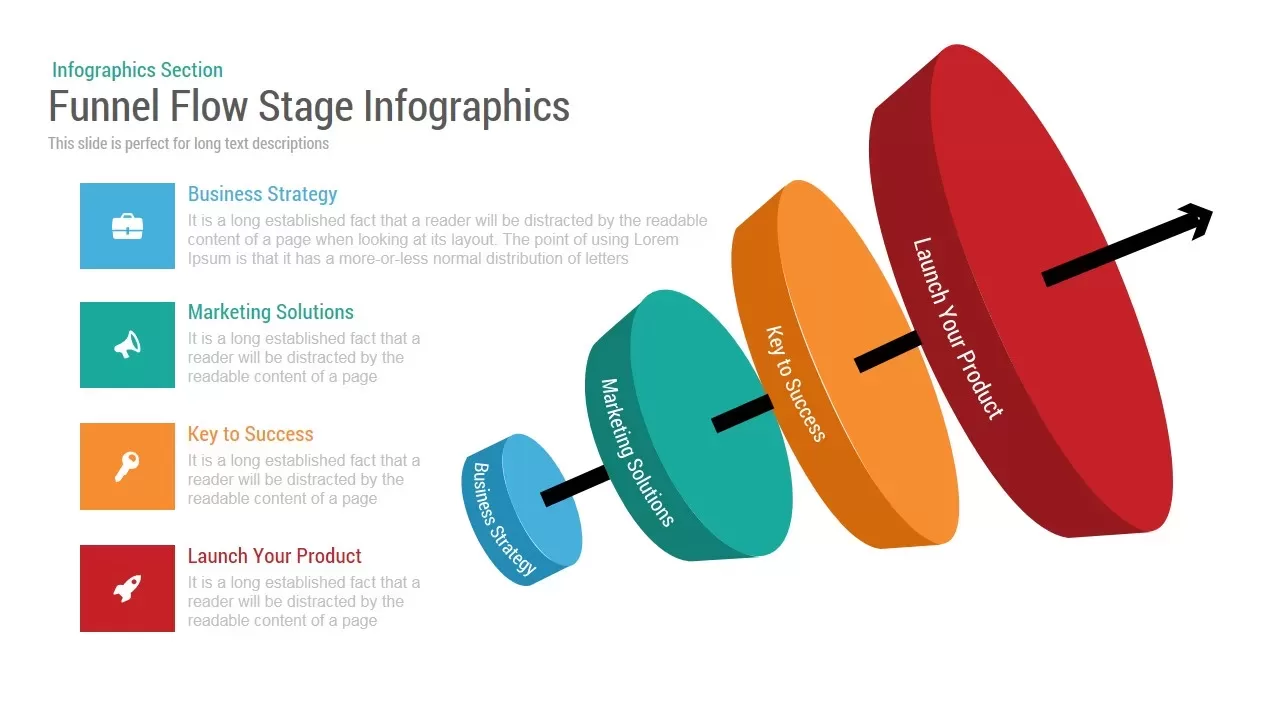
Funnel Flow Stage Infographics template for PowerPoint & Google Slides
Funnel
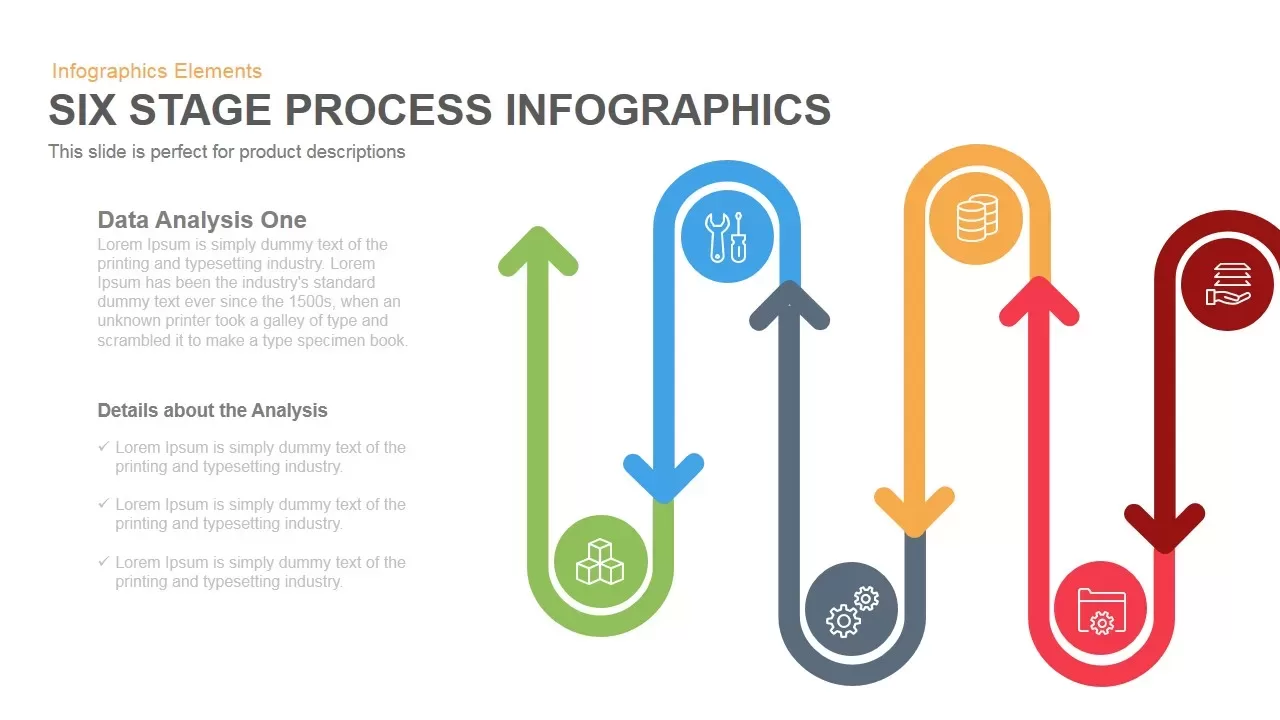
Six-Stage Process Infographics Template for PowerPoint & Google Slides
Process
5-Stage Arrow Infographics Process Flow Template for PowerPoint & Google Slides
Arrow
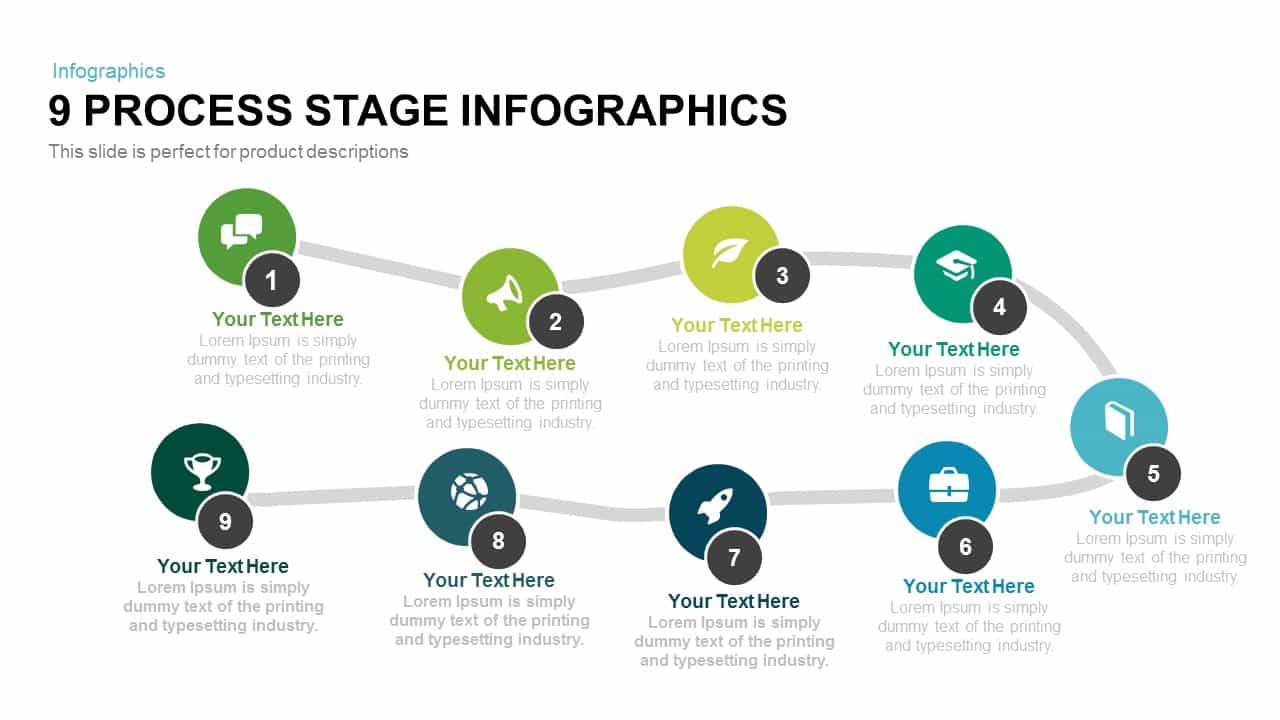
9 Process Stage Infographics template for PowerPoint & Google Slides
Process
Five-Stage Hexagon Process Infographics template for PowerPoint & Google Slides
Process
Five-Stage Pyramid Infographics Diagram Template for PowerPoint & Google Slides
Pyramid
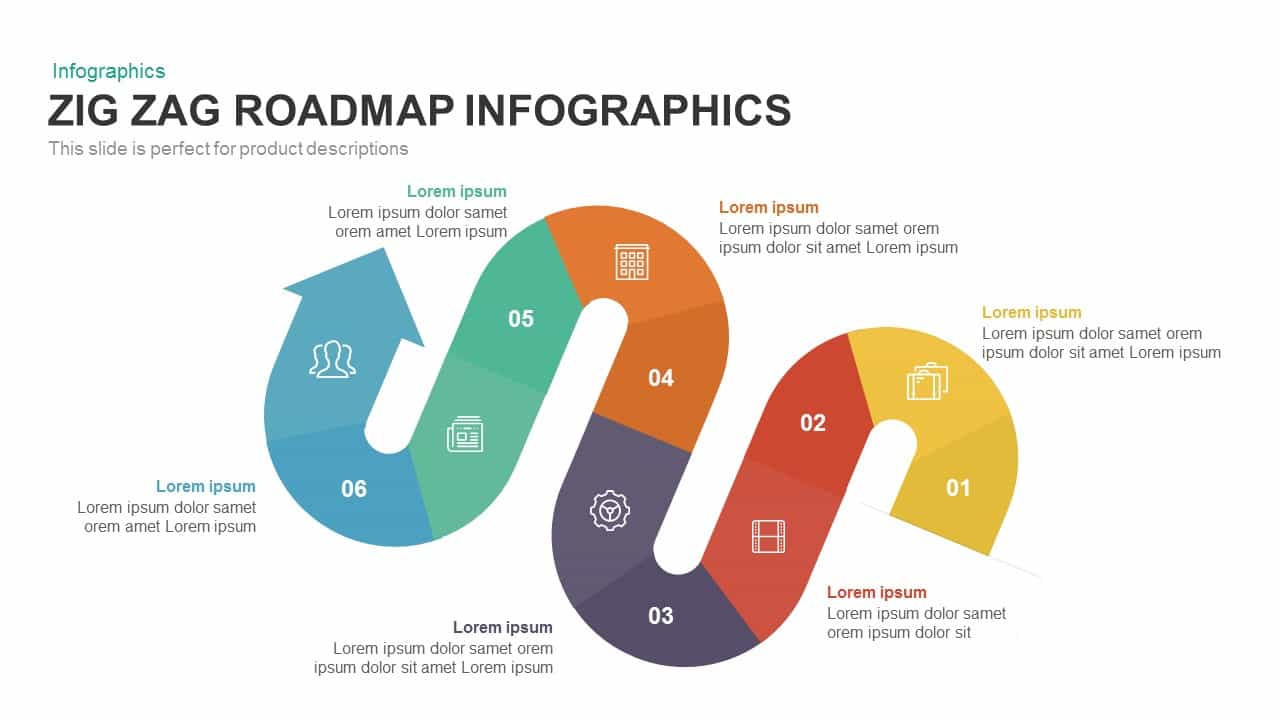
Six-Stage Zig-Zag Roadmap Infographics Template for PowerPoint & Google Slides
Roadmap
Six-Stage Time Arrow Infographics Template for PowerPoint & Google Slides
Arrow
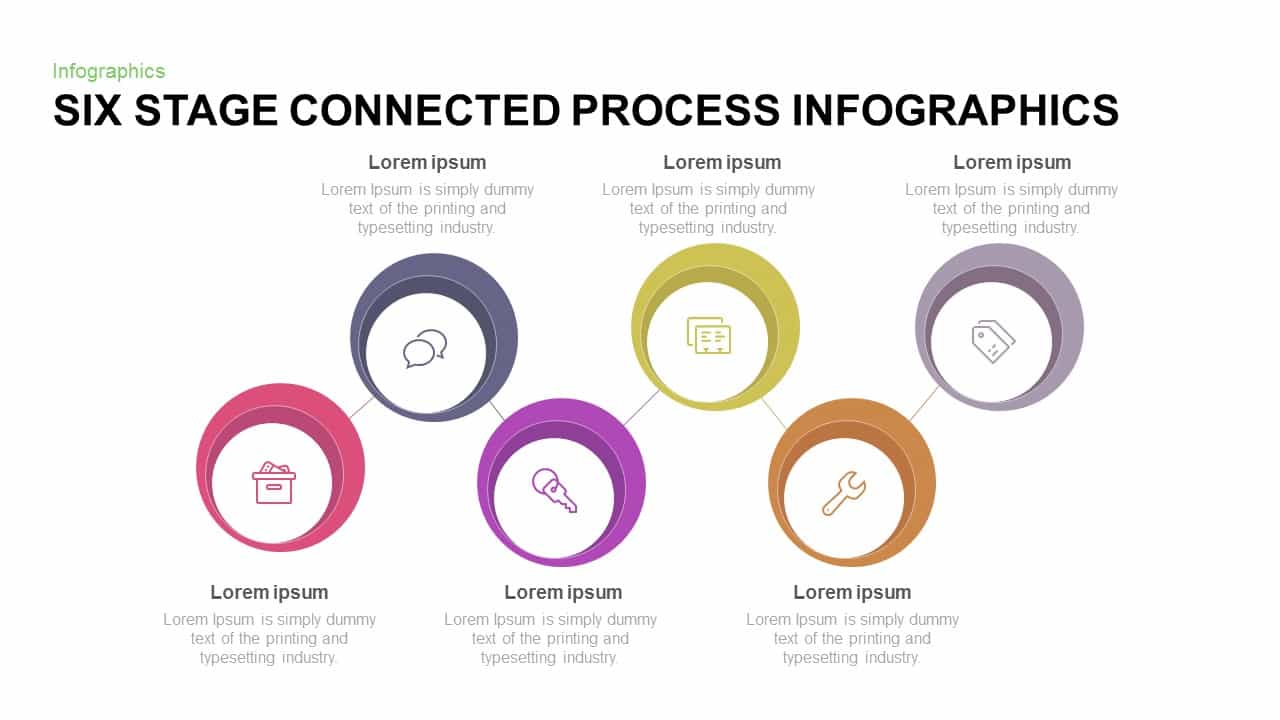
Six-Stage Connected Process Infographics Template for PowerPoint & Google Slides
Process
Five-Stage Pyramid Infographics Process Template for PowerPoint & Google Slides
Pyramid
Six Stage Timeline Diagram for PowerPoint & Google Slides
Timeline
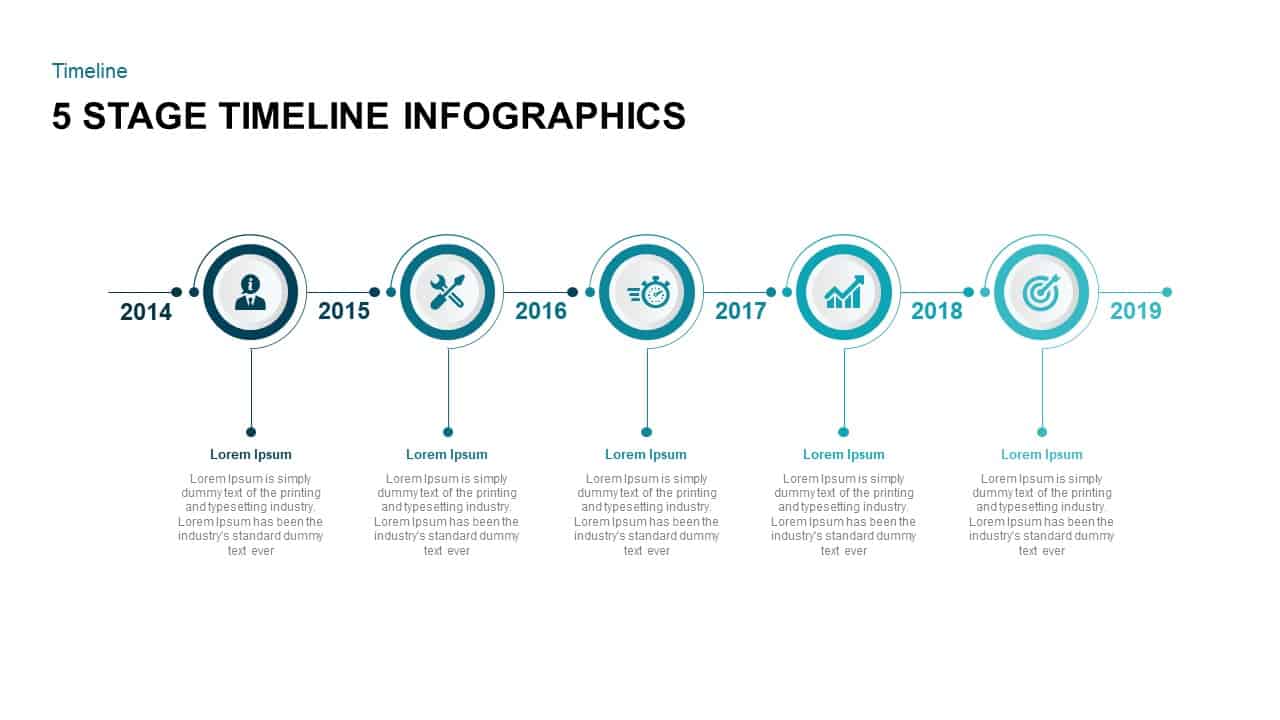
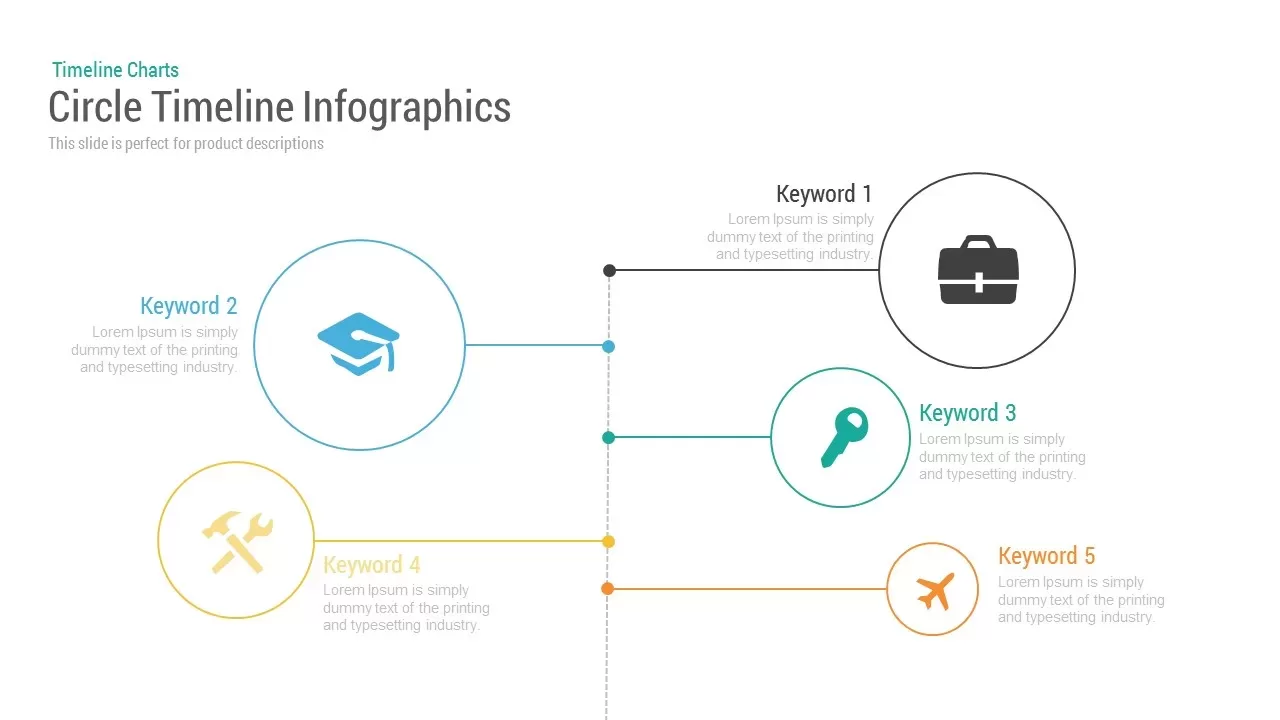
Circle Timeline Infographics template for PowerPoint & Google Slides
Timeline

Dynamic Circle Timeline Infographics template for PowerPoint & Google Slides
Timeline
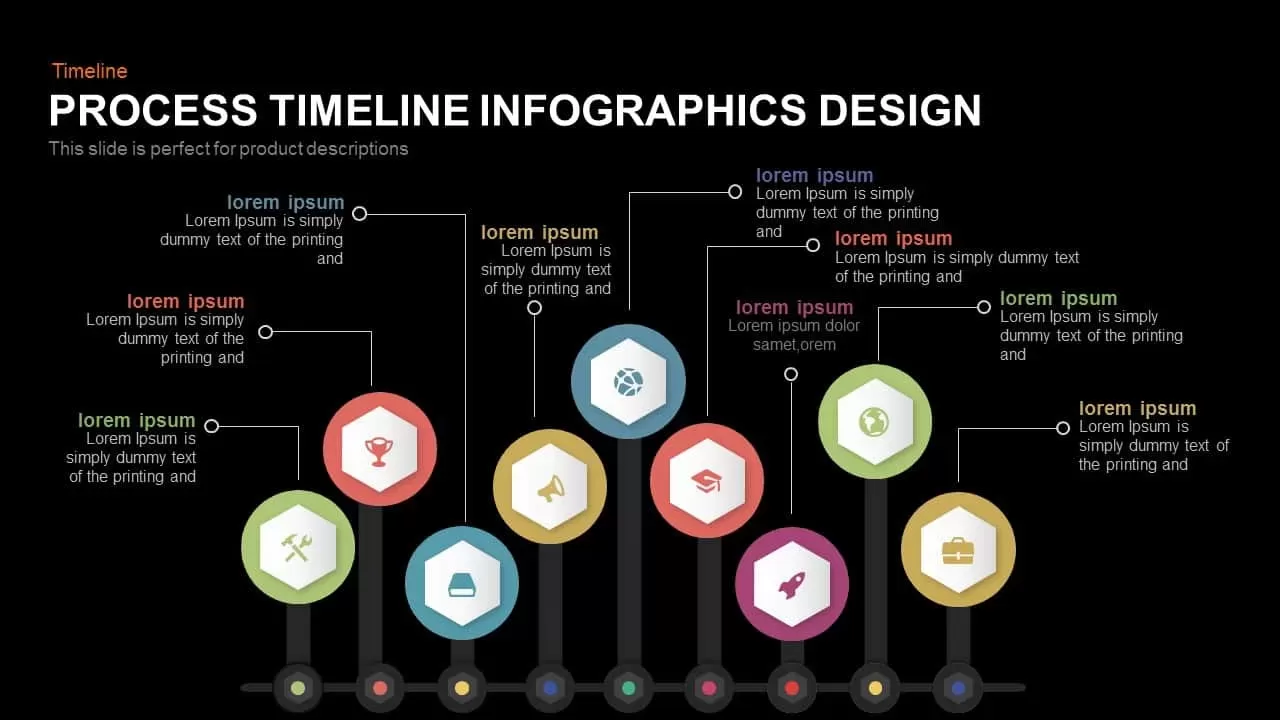
Process Timeline Infographics Design template for PowerPoint & Google Slides
Timeline
Timeline Arrow Infographics Diagram Template for PowerPoint & Google Slides
Timeline
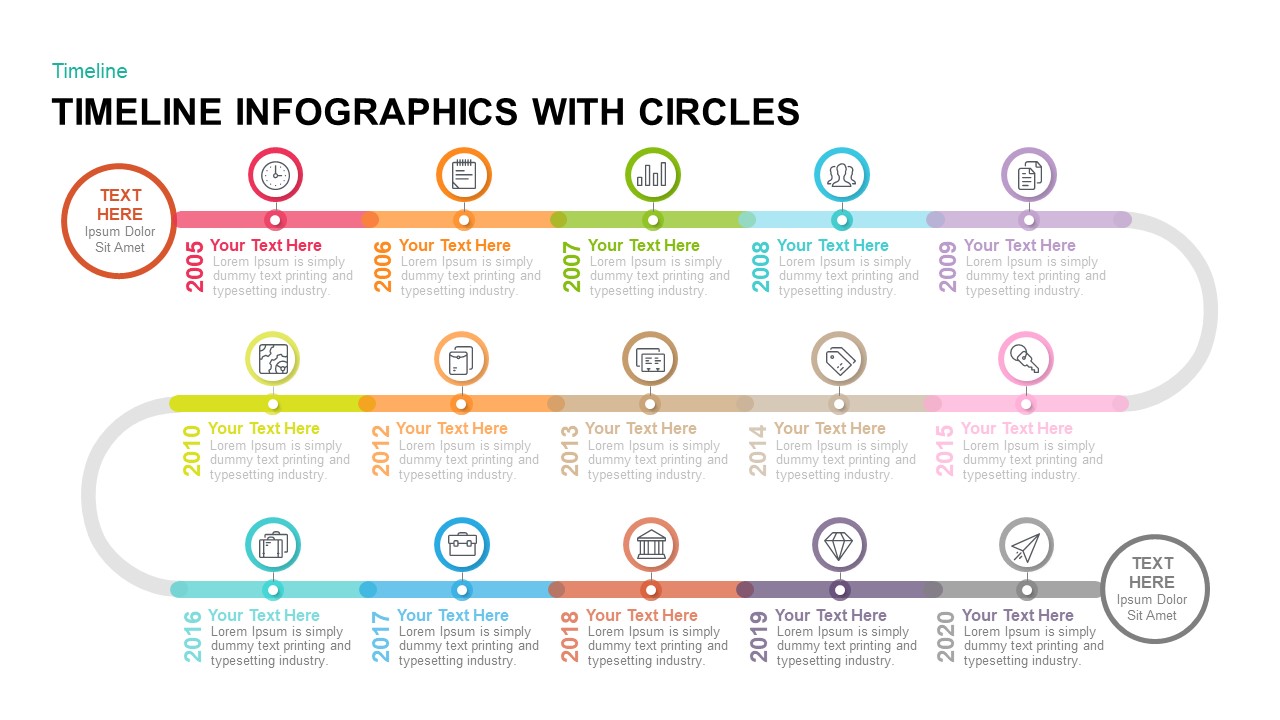
Circular Timeline Infographics Template for PowerPoint & Google Slides
Timeline
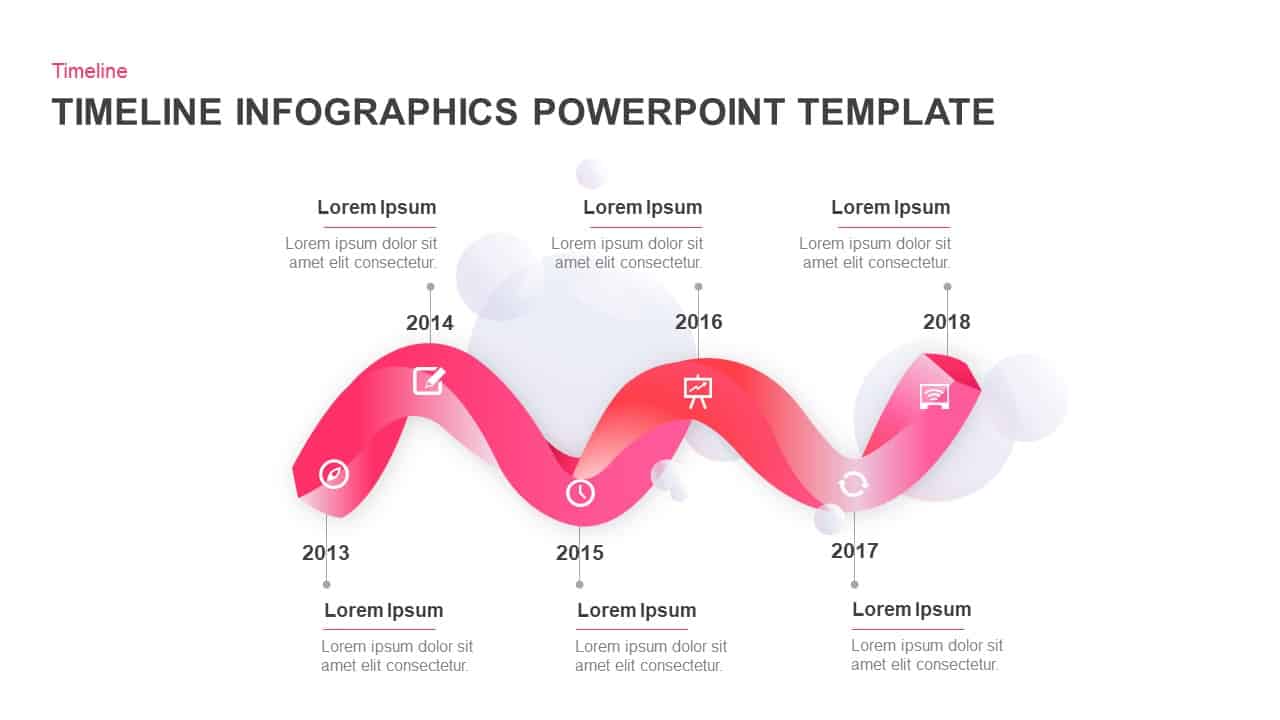
Wavy Ribbon Timeline Infographics Template for PowerPoint & Google Slides
Timeline
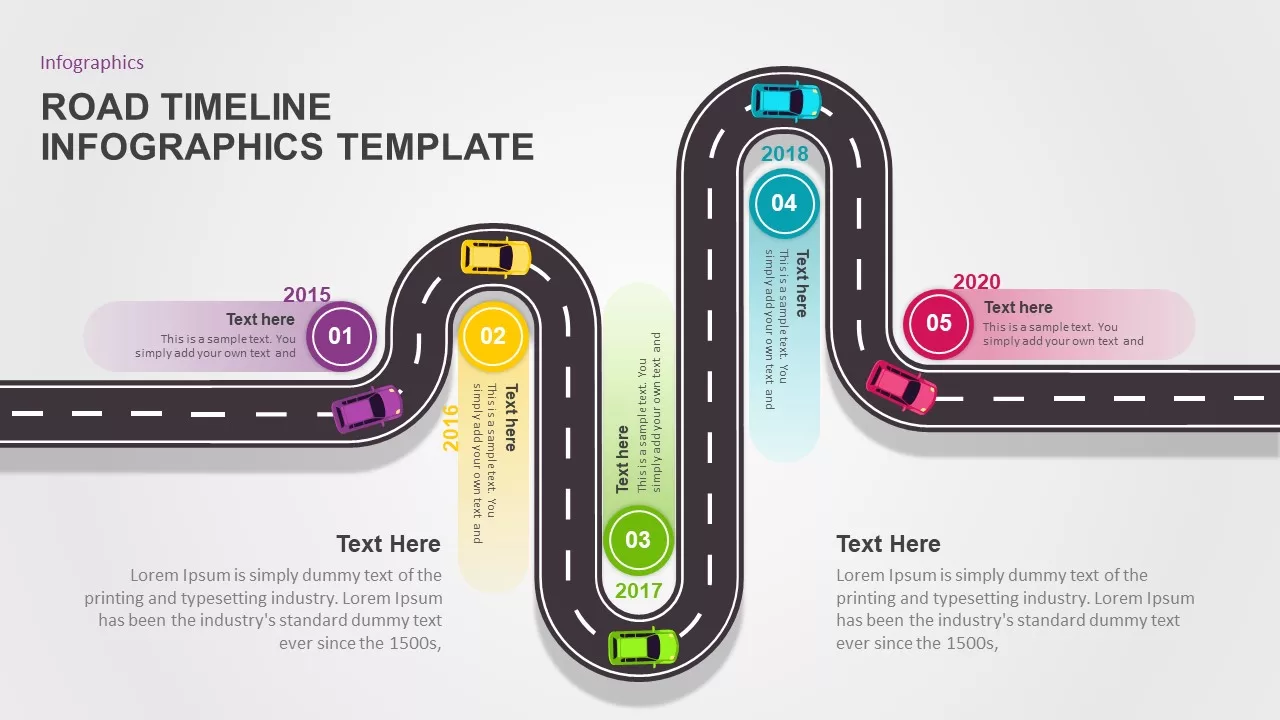
Road Timeline Infographics Template for PowerPoint & Google Slides
Timeline
Animated Timeline Infographics template for PowerPoint & Google Slides
Timeline
Timeline Infographics template for PowerPoint & Google Slides
Timeline
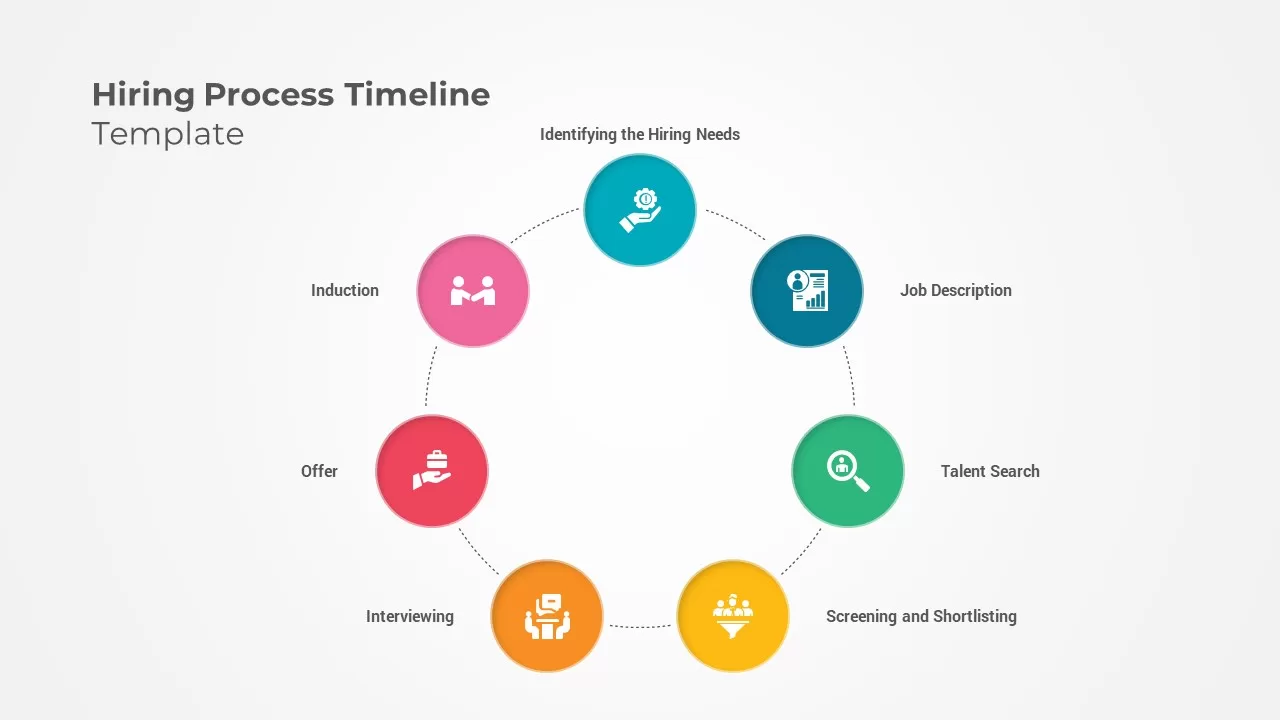
Hiring Process Timeline Infographics Template for PowerPoint & Google Slides
Recruitment

Free Colorful Timeline Infographics Template for PowerPoint & Google Slides
Timeline
Free
Timeline Infographics for PowerPoint & Google Slides
Timeline
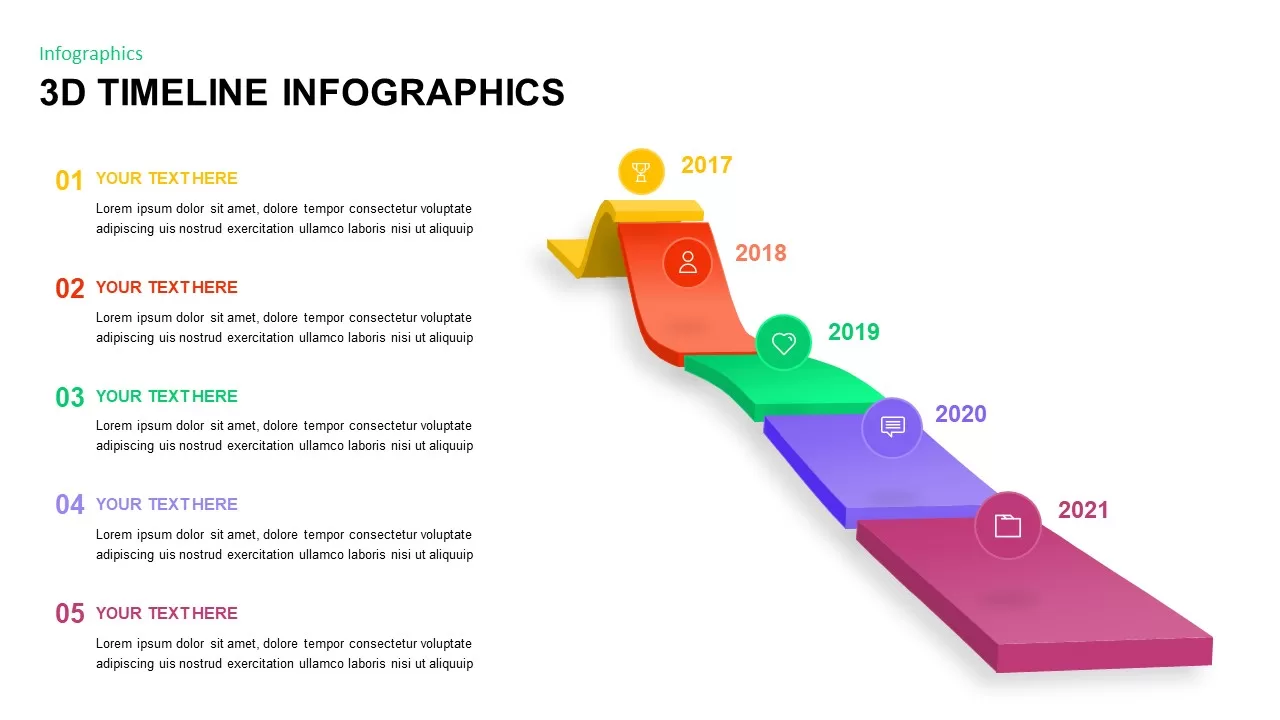
3D Timeline Infographics for PowerPoint & Google Slides
Project Status
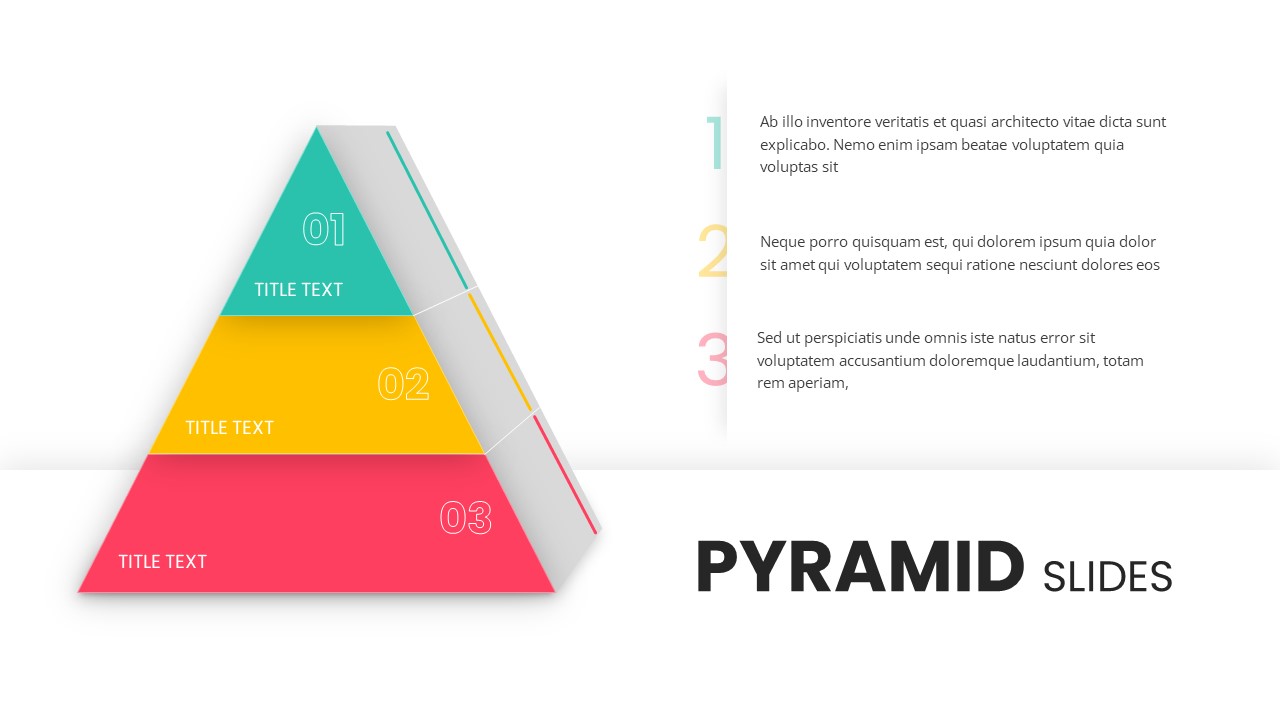
3 Stage Pyramid Slides for PowerPoint & Google Slides
Pyramid
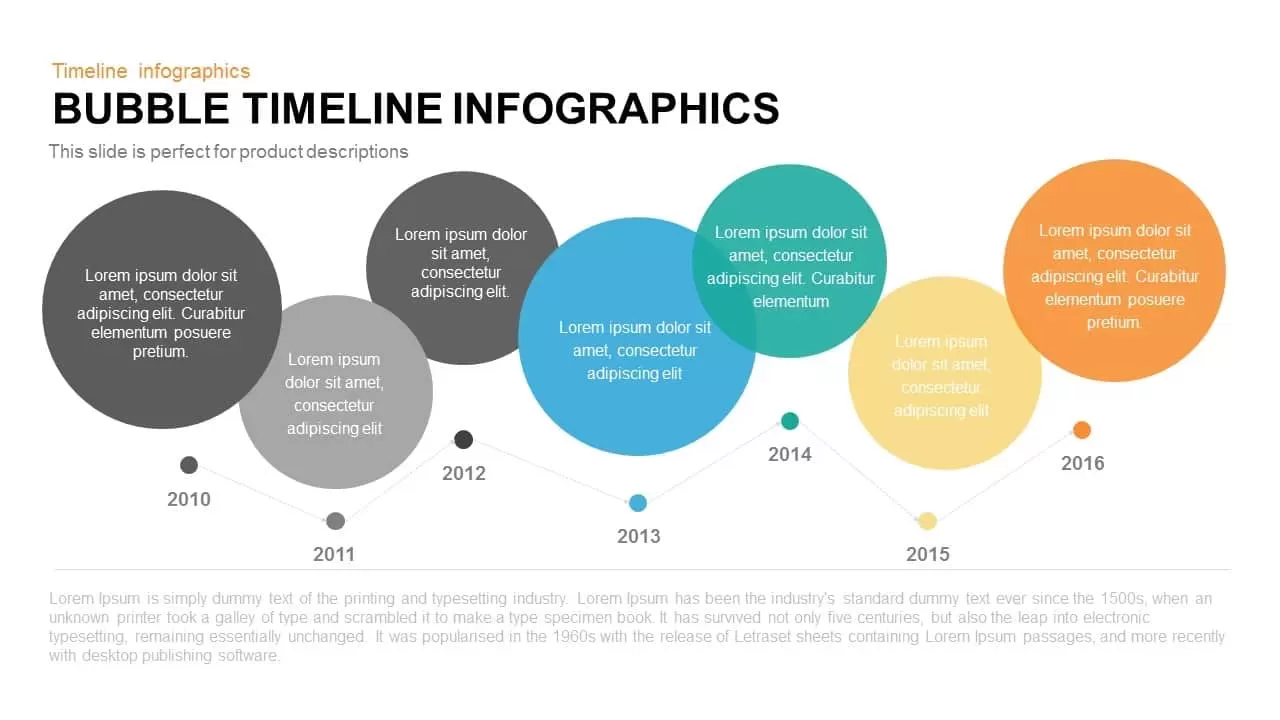
Bubble Timeline Infographics PowerPoint Template and Keynote
Business
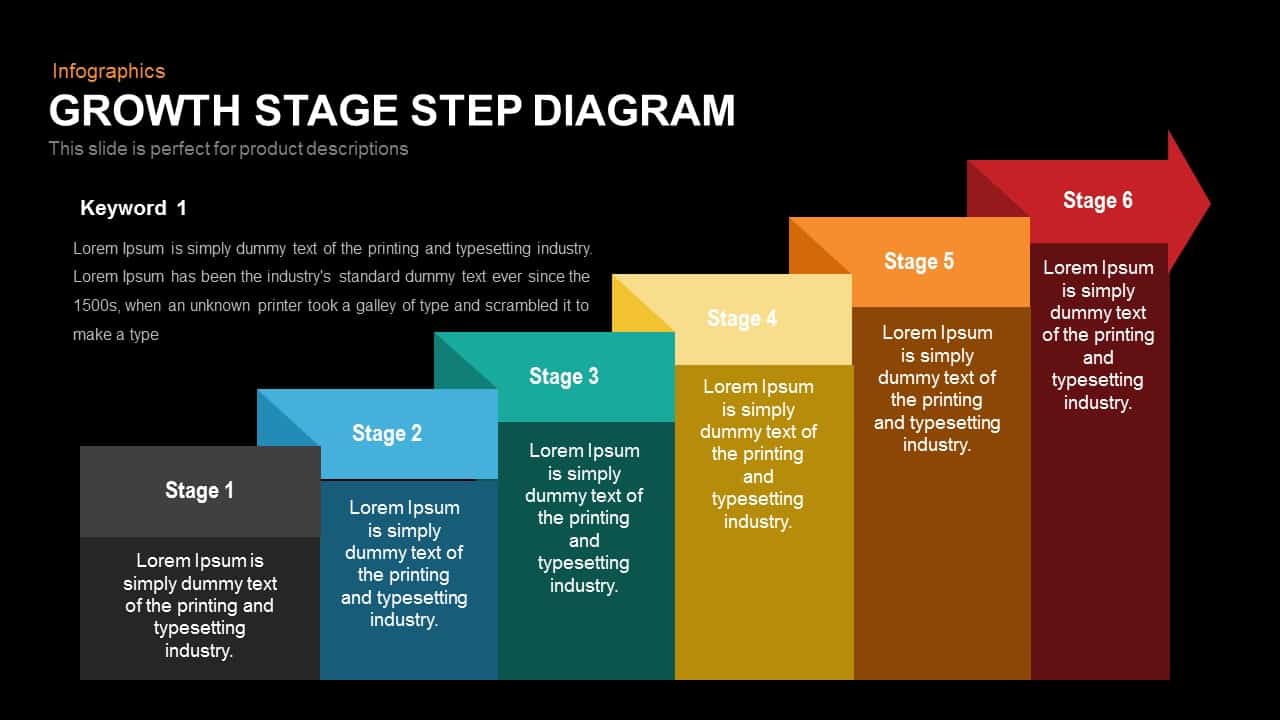
Growth Stage Diagram template for PowerPoint & Google Slides
Process
Three Stage 3D Arrow Process Diagram Template for PowerPoint & Google Slides
Process
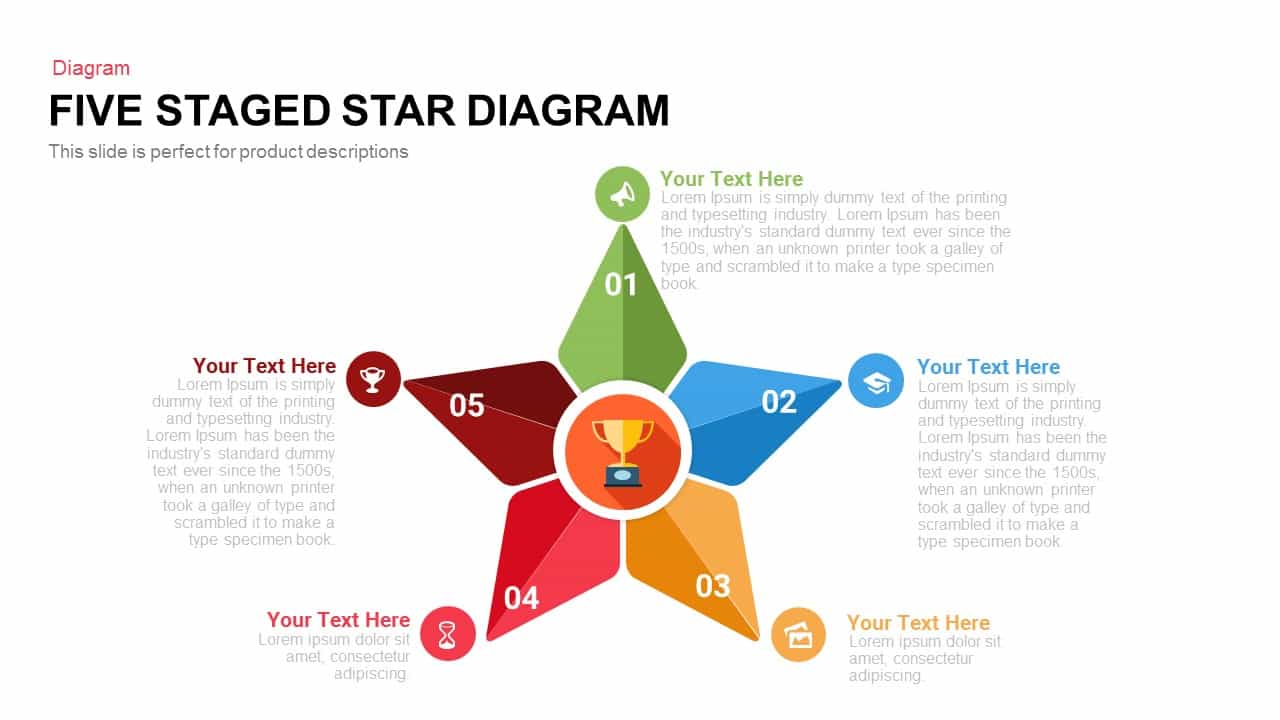
Five-Stage Star Diagram for Milestones Template for PowerPoint & Google Slides
Process
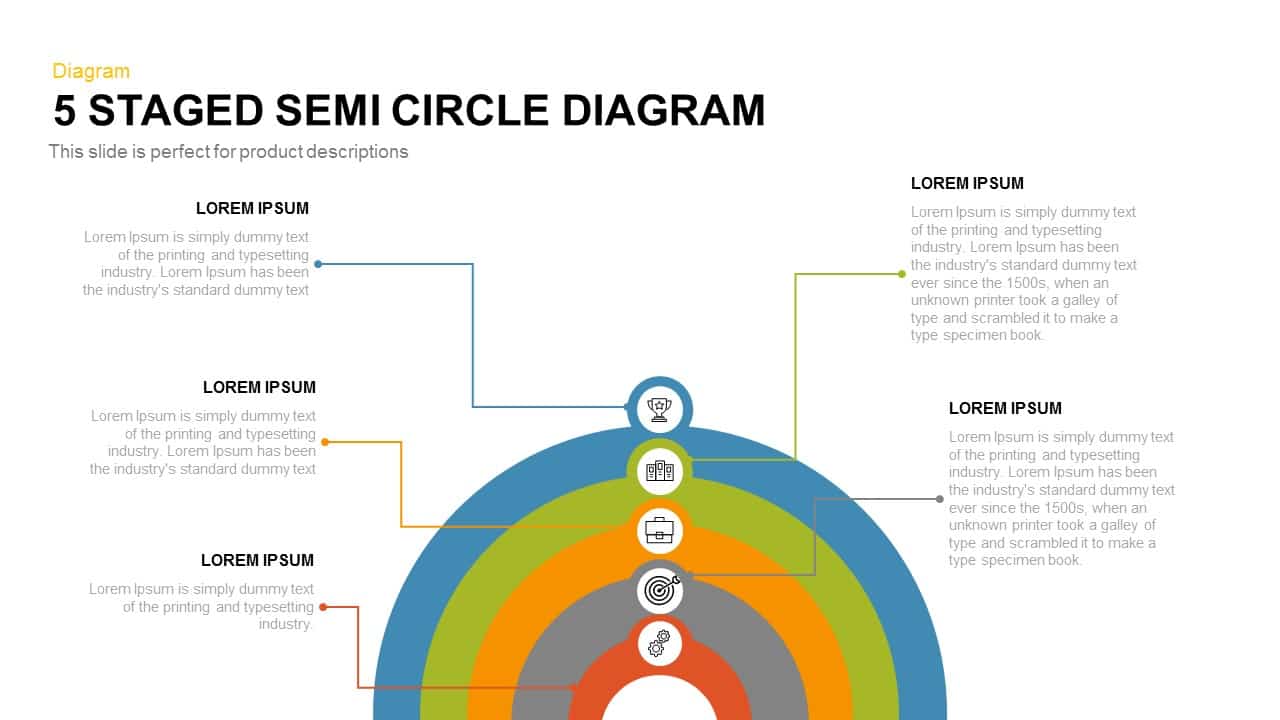
Five-Stage Semi-Circle Diagram Template for PowerPoint & Google Slides
Process
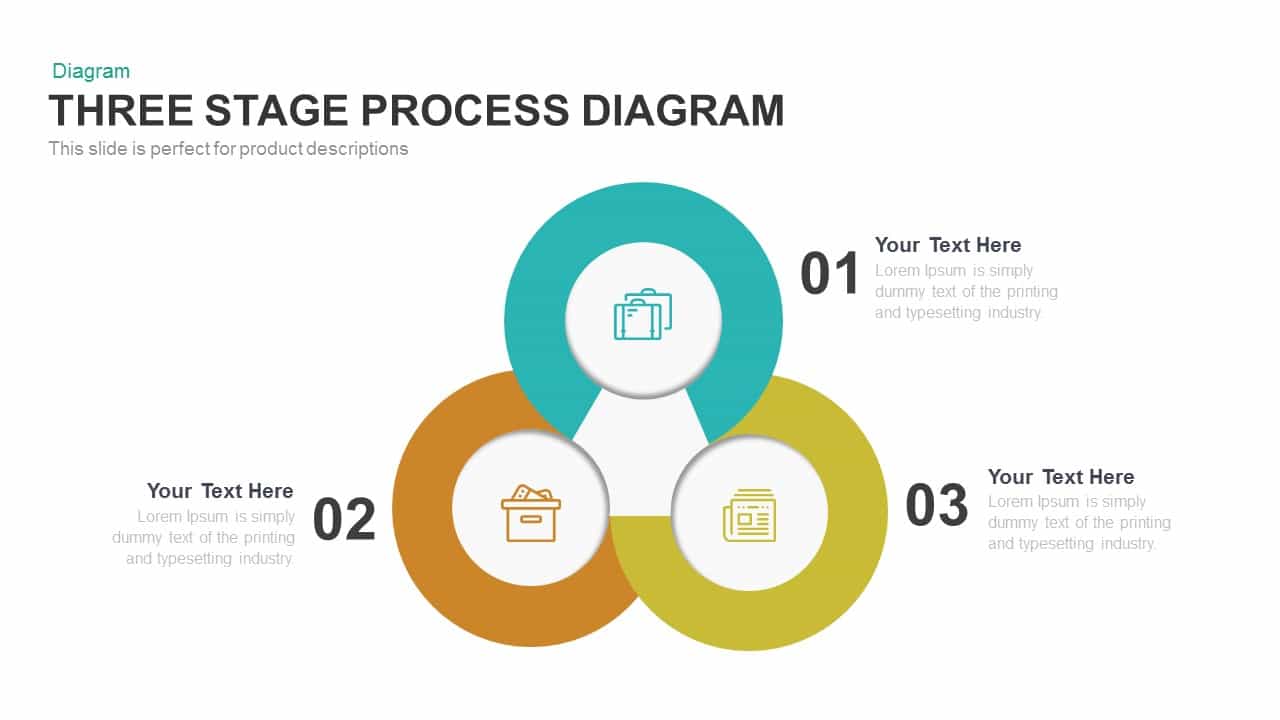
Engaging Three-Stage Process Diagram Template for PowerPoint & Google Slides
Process
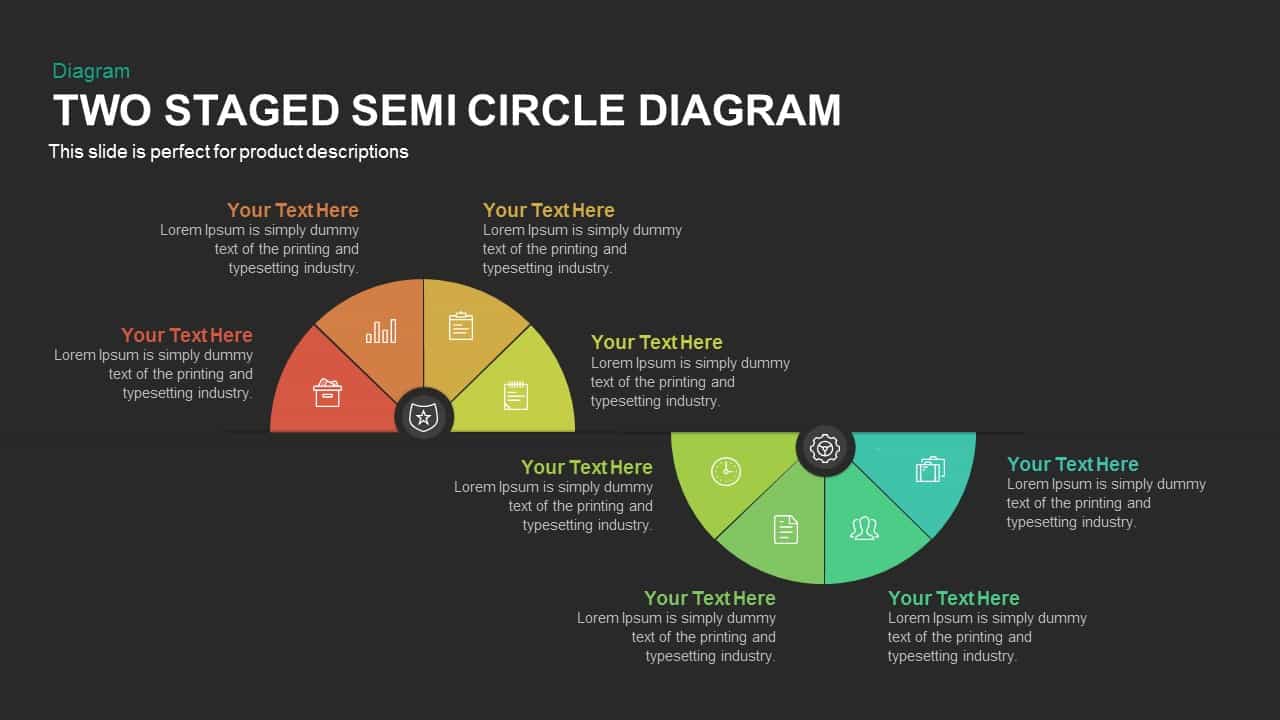
Two-Stage Semi-Circle Diagram Overview Template for PowerPoint & Google Slides
Circular
Six-Stage Semi-Circle Diagram with Icons Template for PowerPoint & Google Slides
Circular
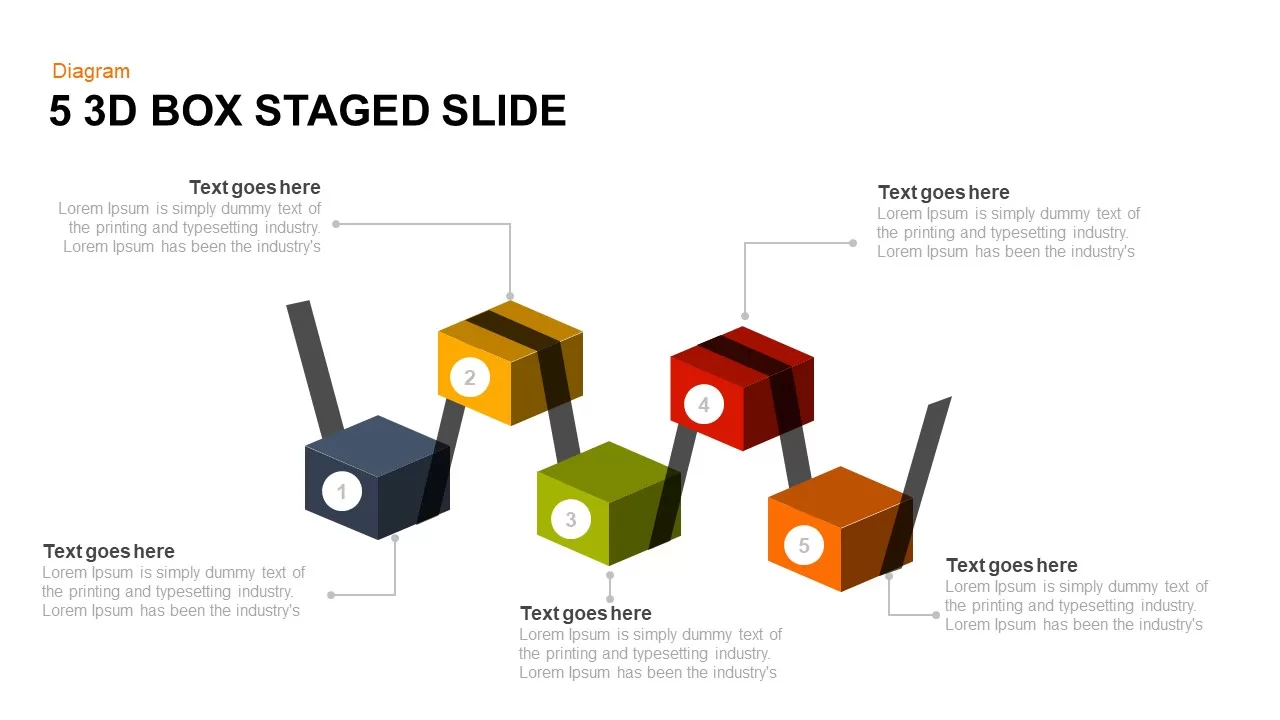
Five-Stage 3D Box Flow Diagram Template for PowerPoint & Google Slides
Process
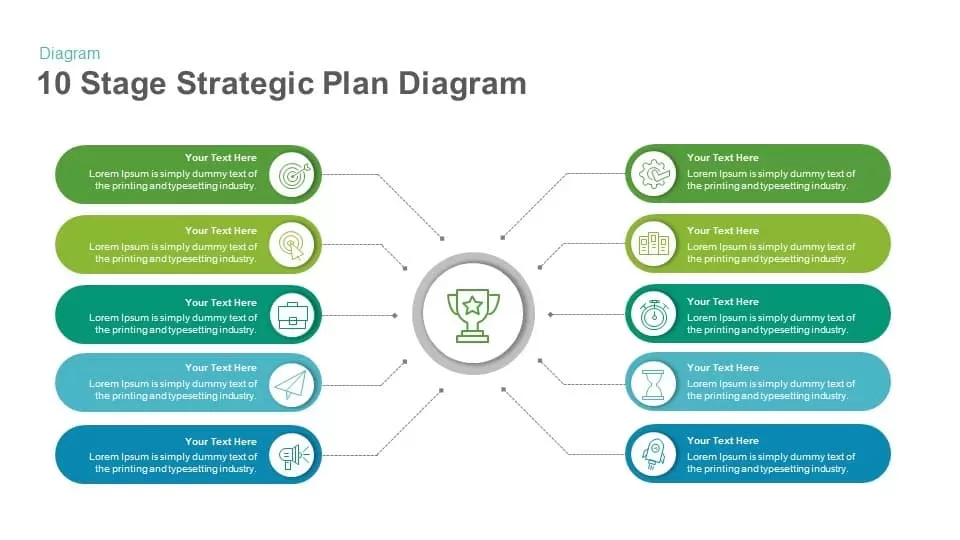
10 Stage Strategic Plan Diagram template for PowerPoint & Google Slides
Process
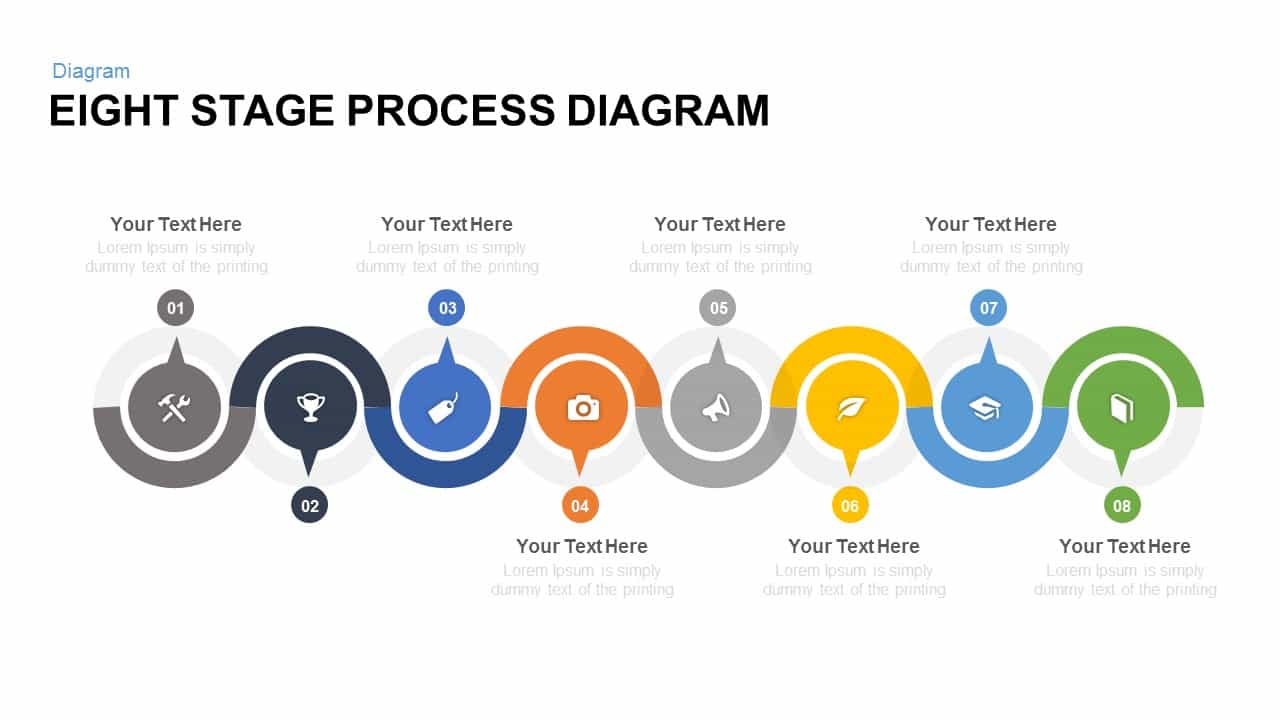
Eight Stage Process Diagram template for PowerPoint & Google Slides
Process
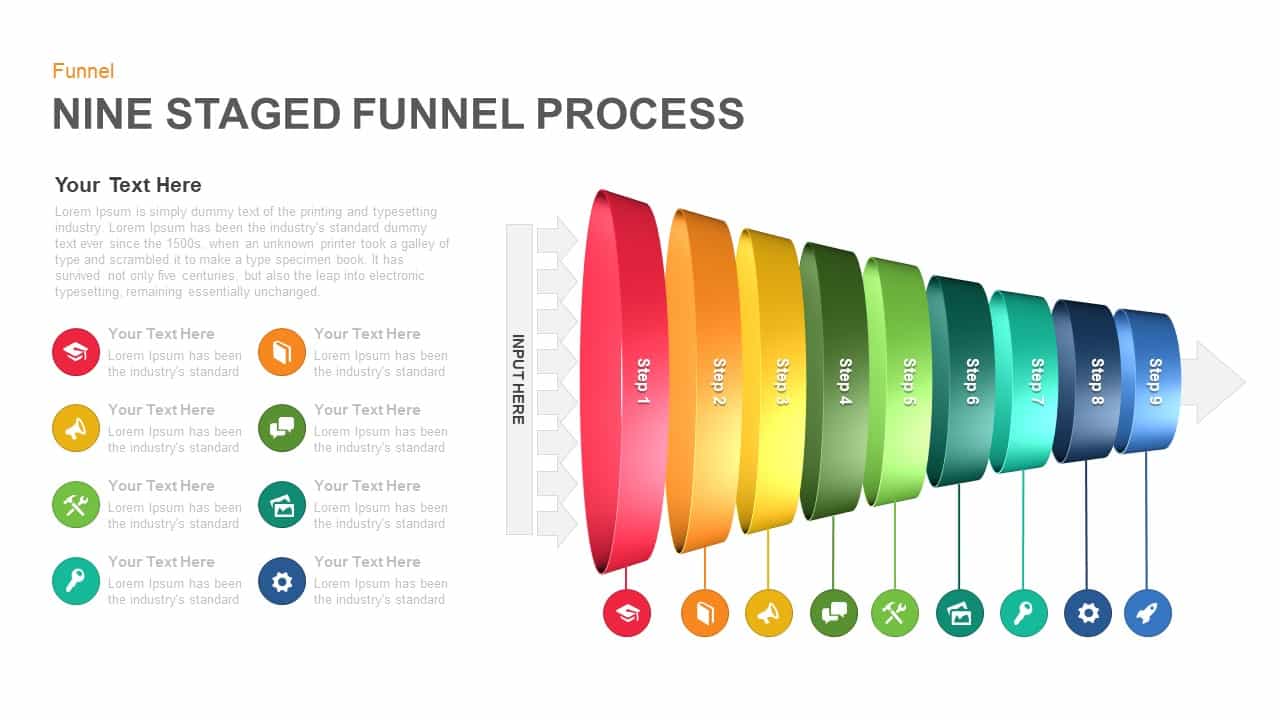
Nine-Stage 3D Funnel Process Diagram Template for PowerPoint & Google Slides
Funnel
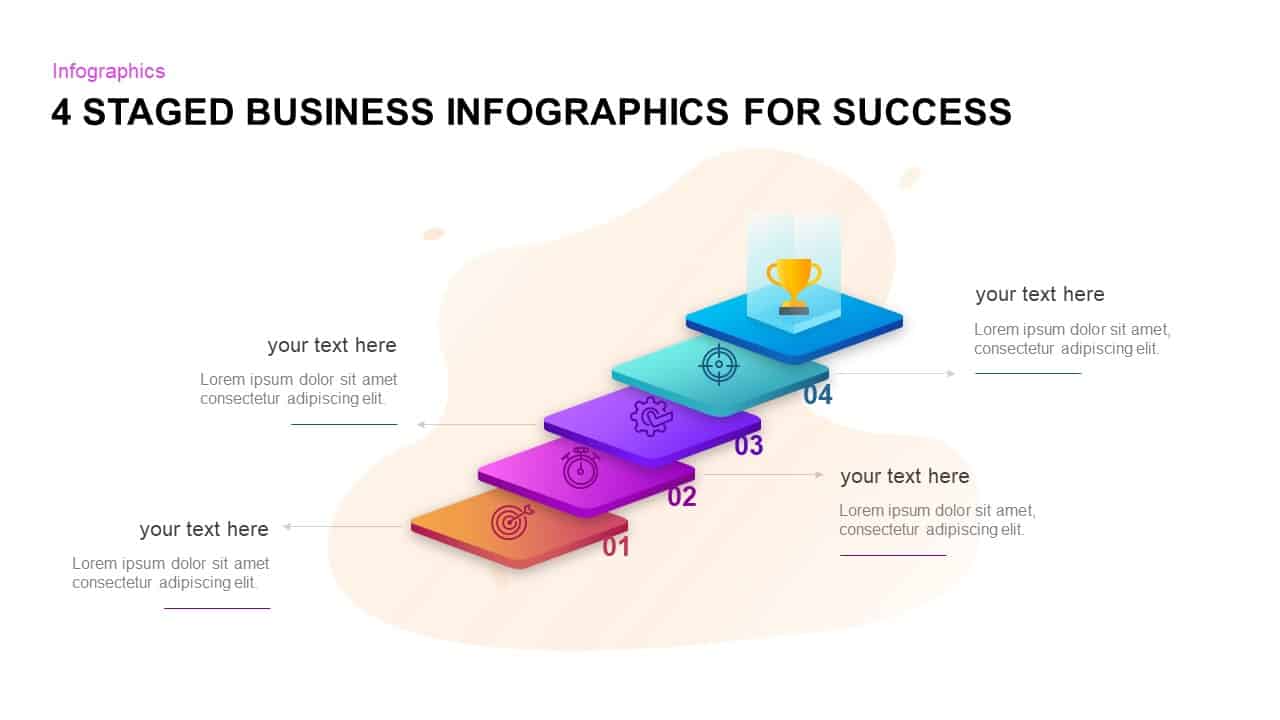
Four-Stage Business Success Infographic Template for PowerPoint & Google Slides
Process
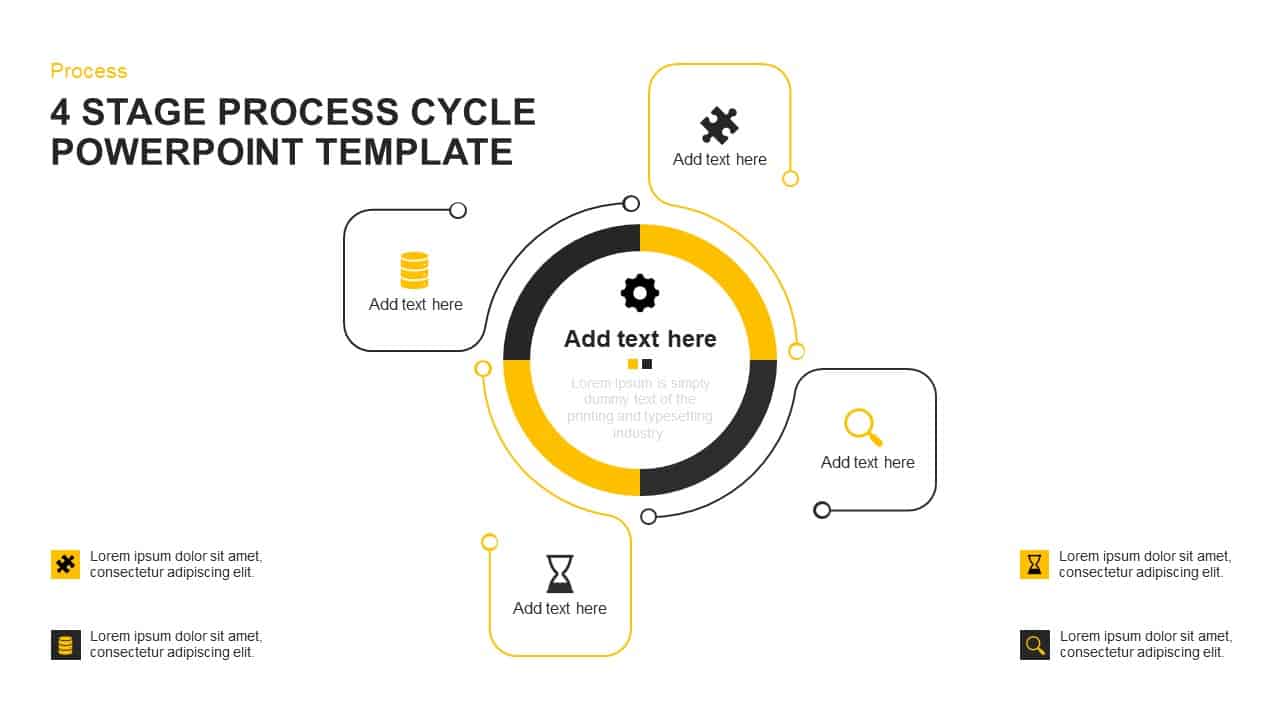
Four-Stage Process Cycle Variations Pack Template for PowerPoint & Google Slides
Process
Five-Stage Circular Flow Diagram Template for PowerPoint & Google Slides
Circular
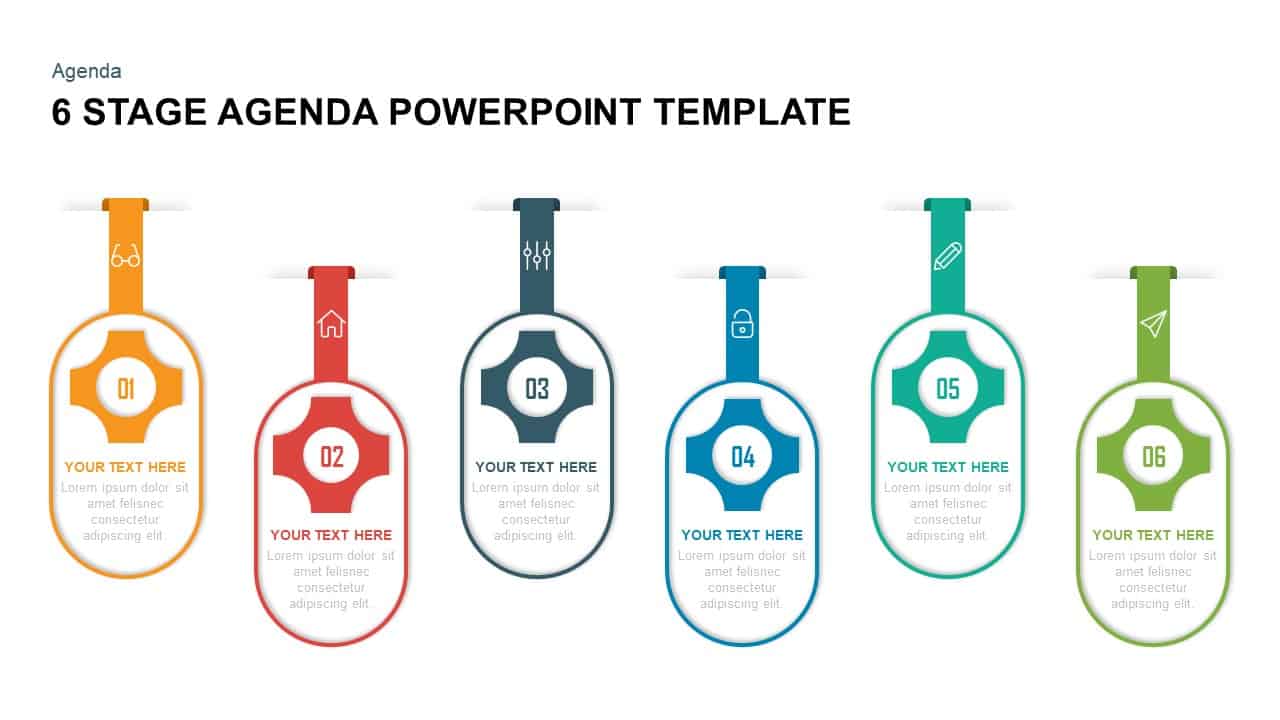
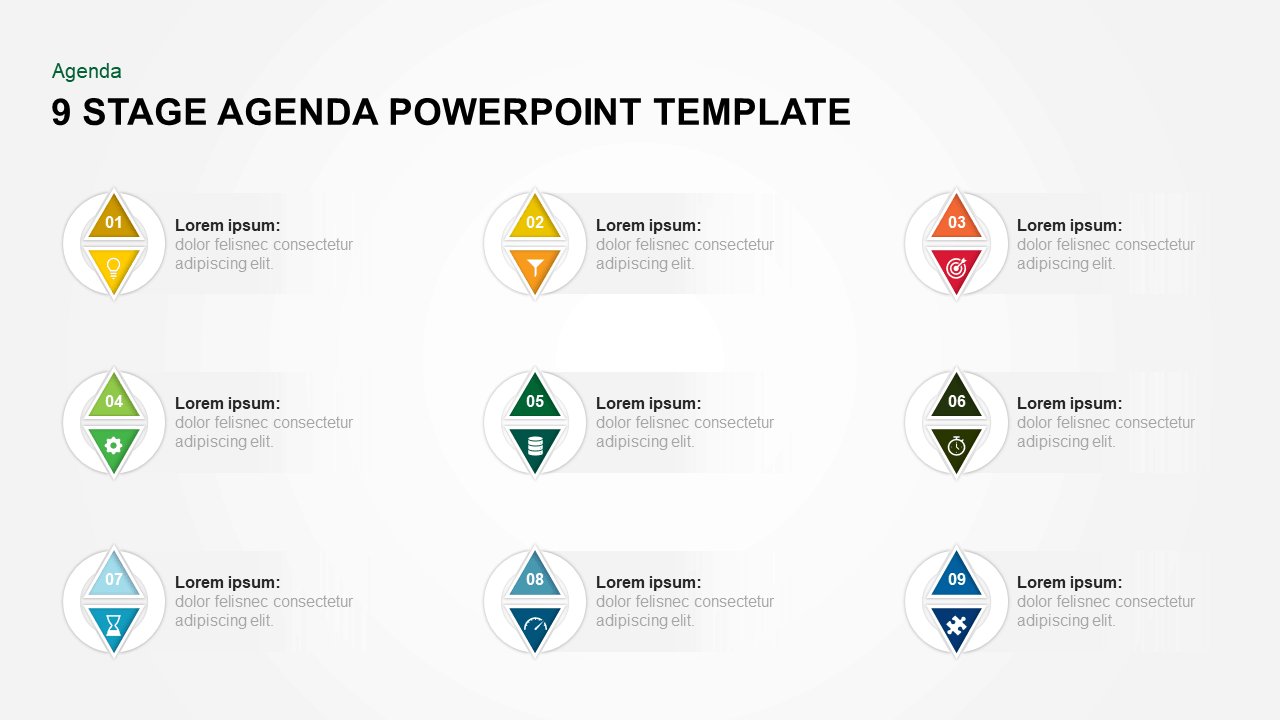
Colorful Nine-Stage Agenda Slide Template for PowerPoint & Google Slides
Agenda
4 Stage Linear Process Flow Diagram Template for PowerPoint & Google Slides
Process
Six-Stage Circular Flow Diagram Template for PowerPoint & Google Slides
Circular
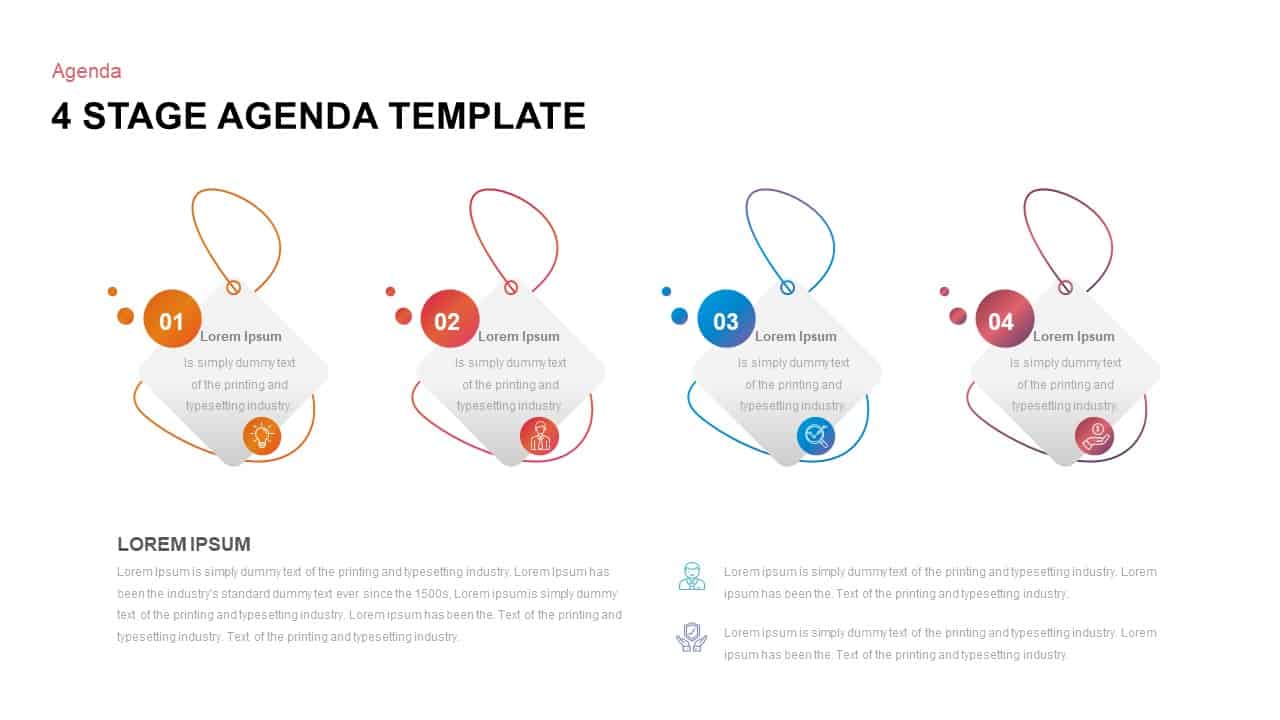
Four-Stage Agenda Infographic Slide Template for PowerPoint & Google Slides
Agenda
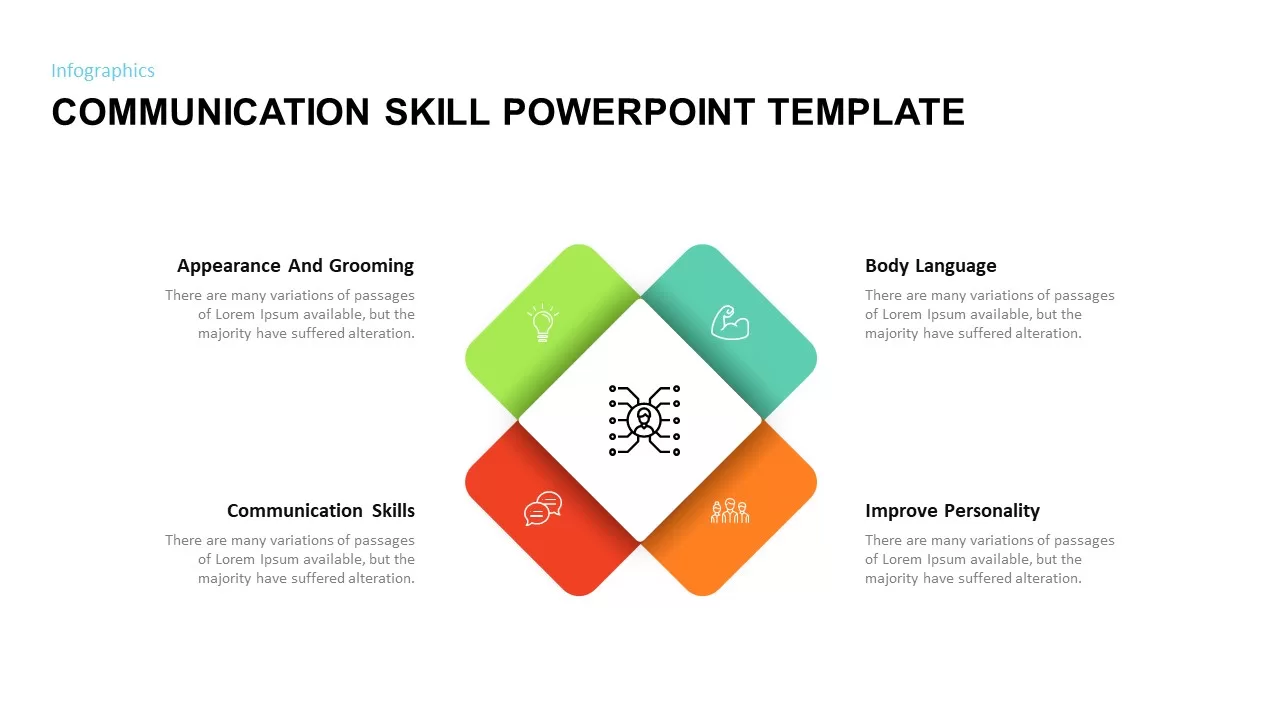
Four-Stage Communication Skills Diamond Template for PowerPoint & Google Slides
Circular
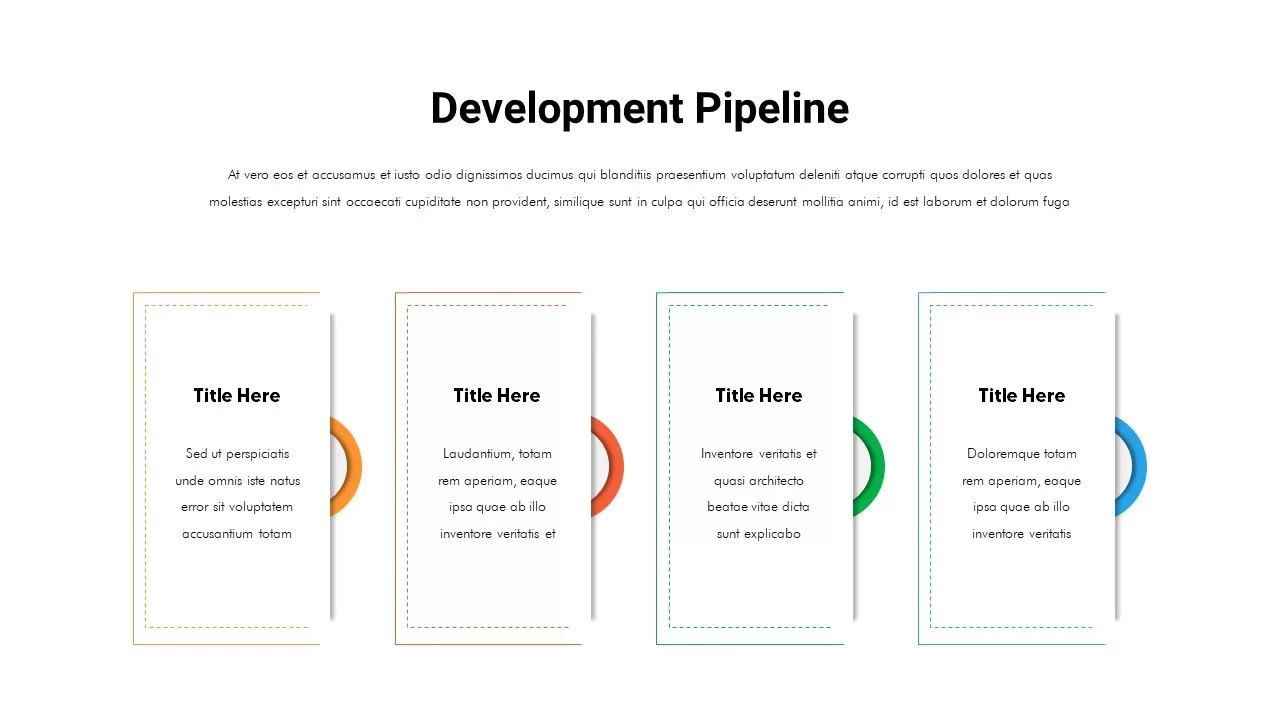
Four-Stage Development Pipeline Template for PowerPoint & Google Slides
Process
Four-Stage Circle Arrow Infographic Template for PowerPoint & Google Slides
Circular
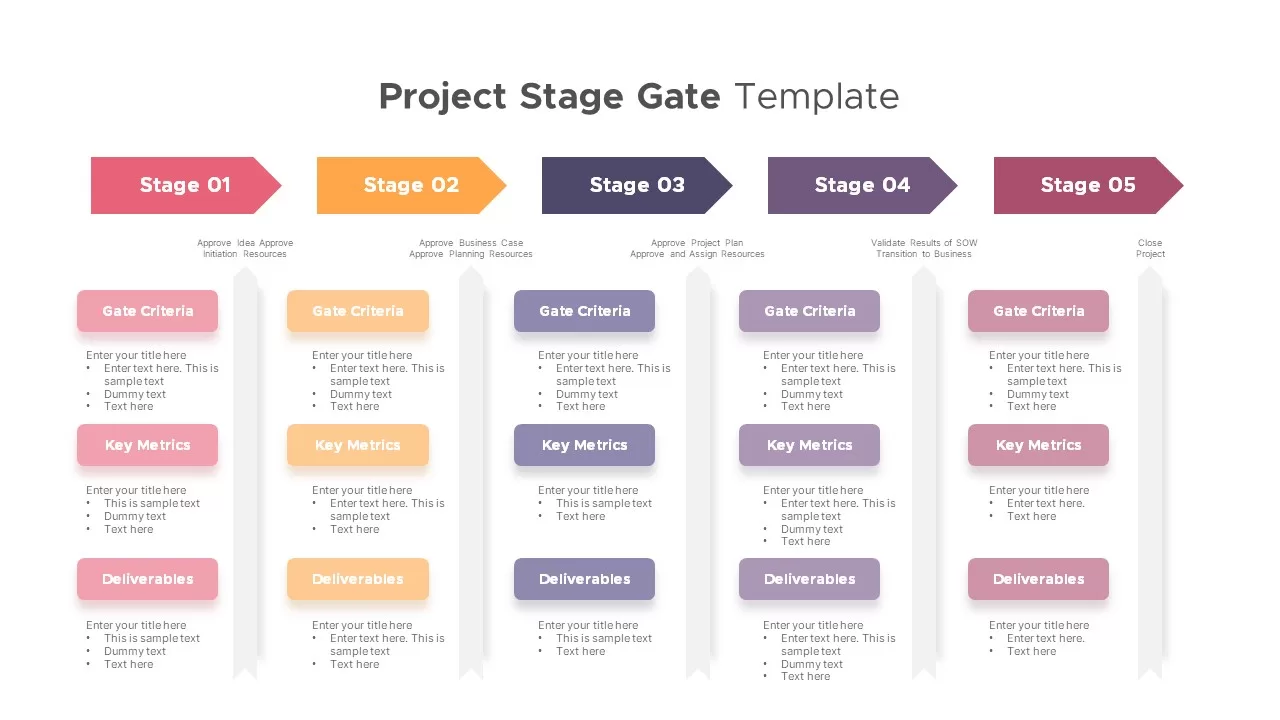
Project Stage Gate Process Diagram Template for PowerPoint & Google Slides
Process
Stage Gate Process Roadmap Template for PowerPoint & Google Slides
Process
Six-Stage Pyramid Process Slide Template for PowerPoint & Google Slides
Pyramid
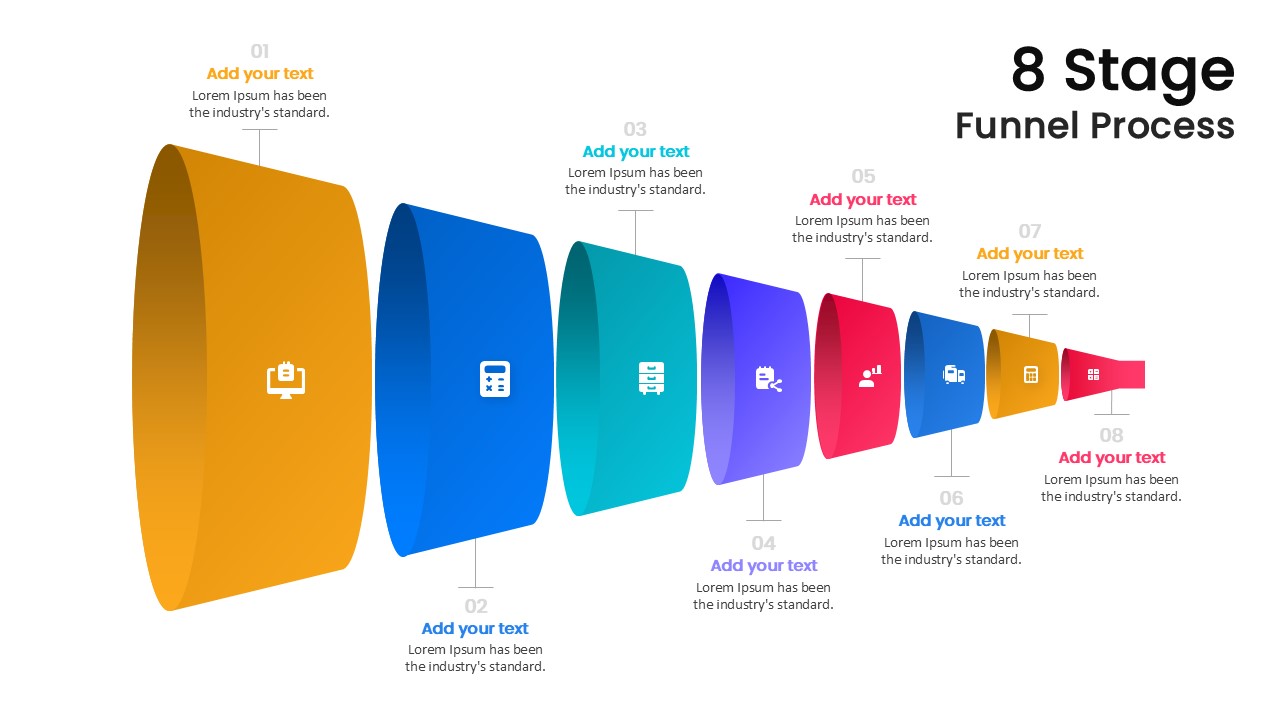
Modern 8-Stage Funnel Process Diagram Template for PowerPoint & Google Slides
Funnel
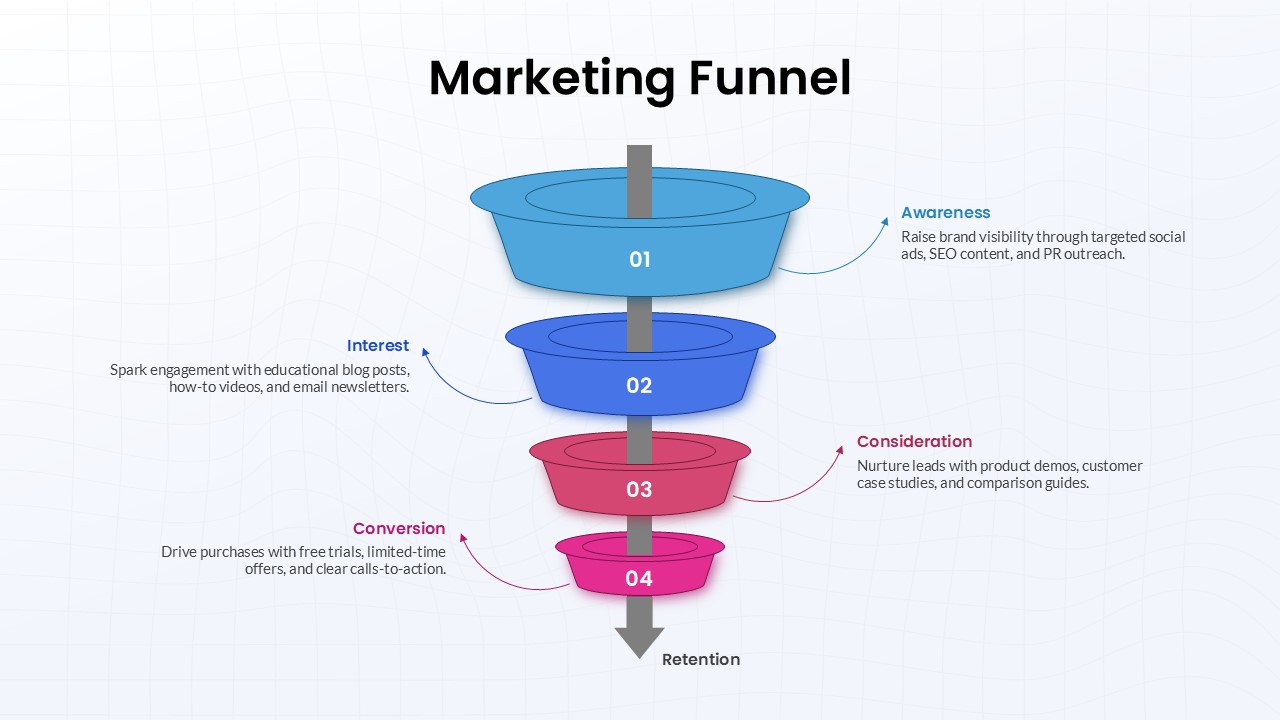
Four-Stage Marketing Funnel Diagram Template for PowerPoint & Google Slides
Marketing Funnel