Service Delivery Quadrant Slide Template for PowerPoint & Google Slides


Description
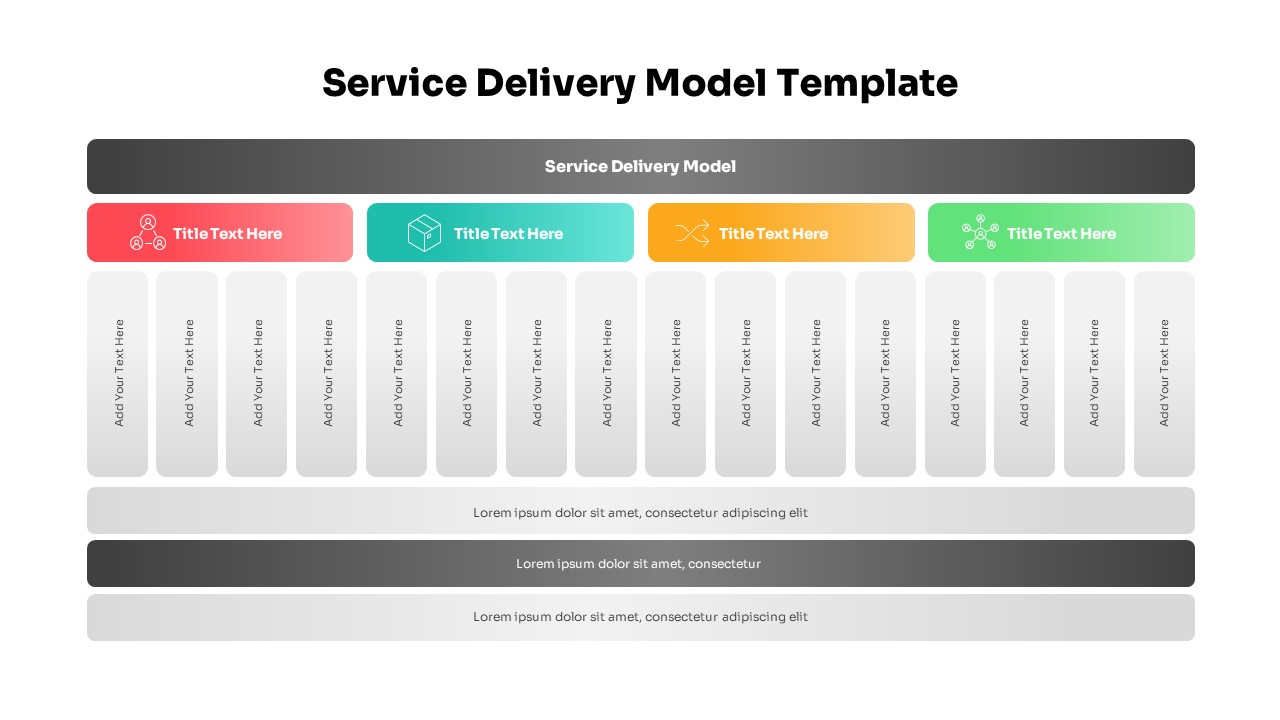
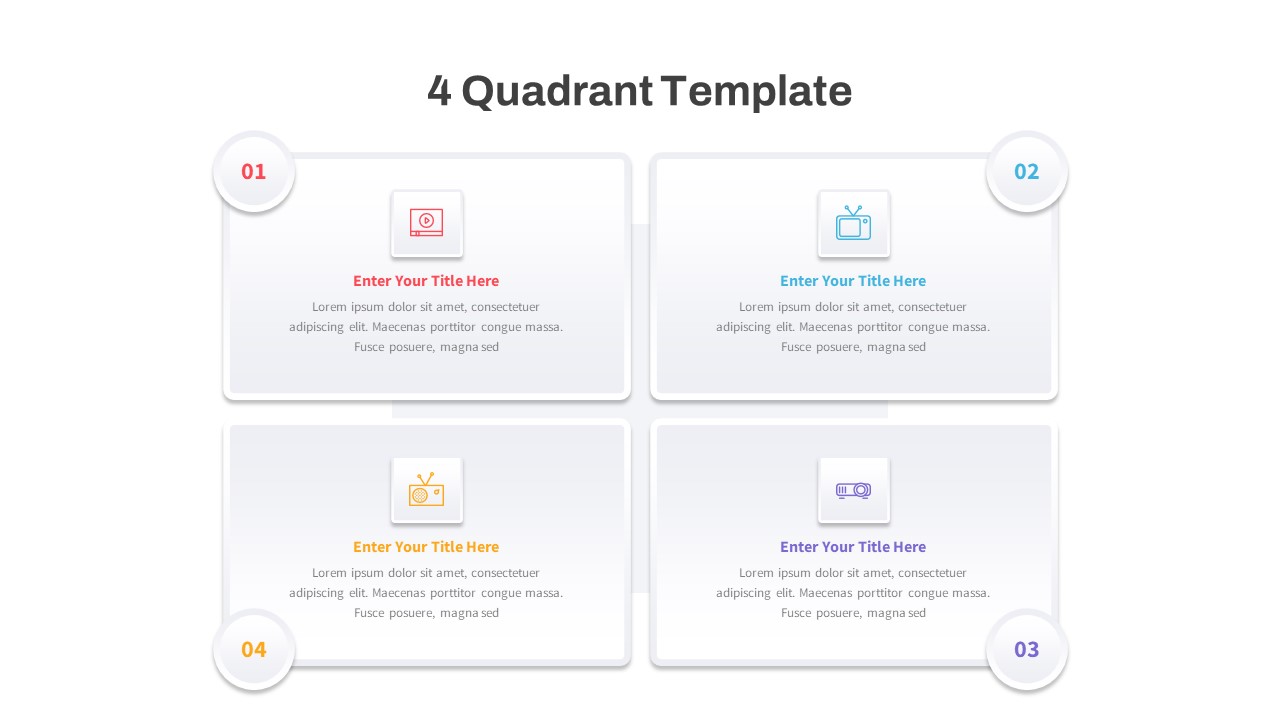
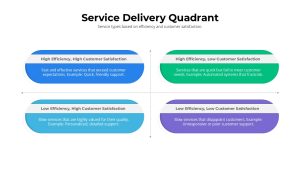
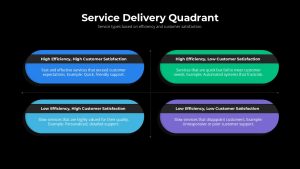
Present service delivery models with this versatile quadrant diagram slide, designed to map efficiency against customer satisfaction. At its center, a dashed vertical and horizontal axis divides the canvas into four segments, each represented by a vibrant rounded capsule. The top-left capsule in deep blue illustrates high efficiency and high satisfaction, perfect for highlighting best-in-class services that delight users through quick, personalized support. In contrast, the top-right green capsule examines high-efficiency, low-satisfaction scenarios—ideal for showcasing automated systems or self-service platforms that may sacrifice user experience despite speed. On the lower-left, a light cyan capsule emphasizes low-efficiency, high-satisfaction offerings, such as premium, detail-oriented services that win customer loyalty through exceptional quality. Finally, the bottom-right purple capsule covers low-efficiency, low-satisfaction situations, outlining critical pain points like slow response times and unresponsive support.
The clean white background and subtle gradient give the slide a modern, professional feel, while the master slide setup ensures easy customization of colors, text, and icons to match corporate branding. Each capsule features a header bar for concise labels and a body section for descriptive text or examples, making it easy to convey complex analyses at a glance. Use editable placeholders to swap in your own metrics, adjust quadrant positions, or refine color schemes without disrupting the overall layout. Compatible with both PowerPoint and Google Slides, the slide maintains full-resolution clarity across devices and screen sizes. Whether you are evaluating service portfolios, conducting operational reviews, or training customer service teams, this quadrant framework helps you communicate insights clearly and drive strategic decision-making.
Who is it for
Operations managers, customer experience leaders, and service designers will benefit from this quadrant slide when analyzing service performance and prioritizing improvement initiatives. Consultants, product managers, and executive teams can leverage the clear visual mapping to align stakeholders and inform strategic roadmaps.
Other Uses
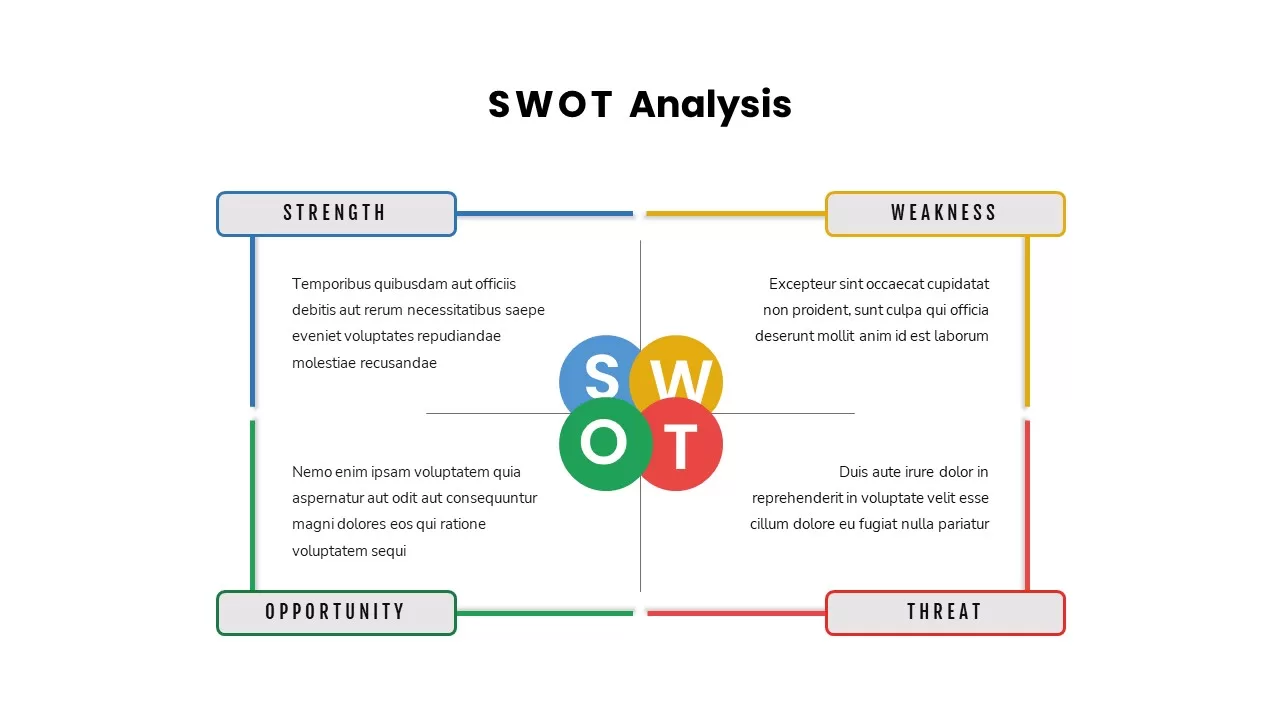
Beyond service delivery assessments, repurpose this slide for risk-reward matrices, product portfolio analyses, SWOT quadrants, or prioritization frameworks. Apply the four-section layout to compare market segments, feature sets, performance metrics, or training outcomes across any industry.
Login to download this file

Item ID
SB04999
Related Templates

Comprehensive Service Delivery Model Template for PowerPoint & Google Slides
Project
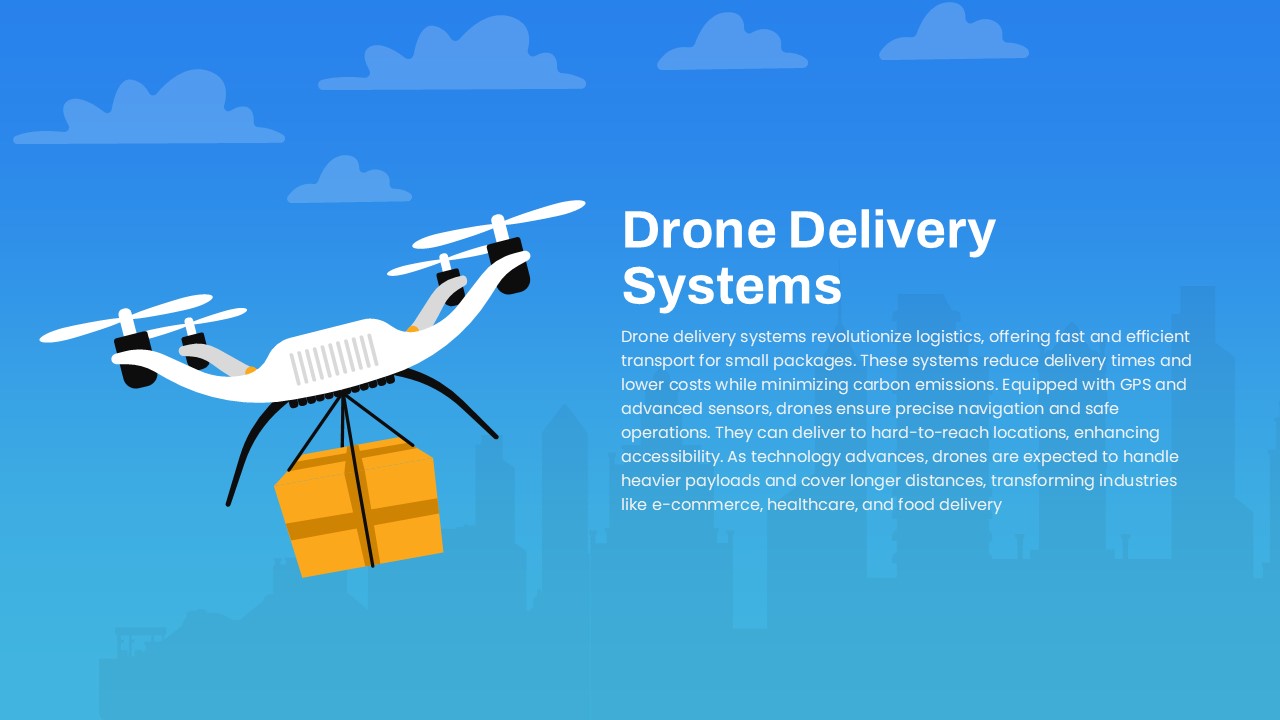
Drone Delivery Systems Overview Slide Template for PowerPoint & Google Slides
Business Models
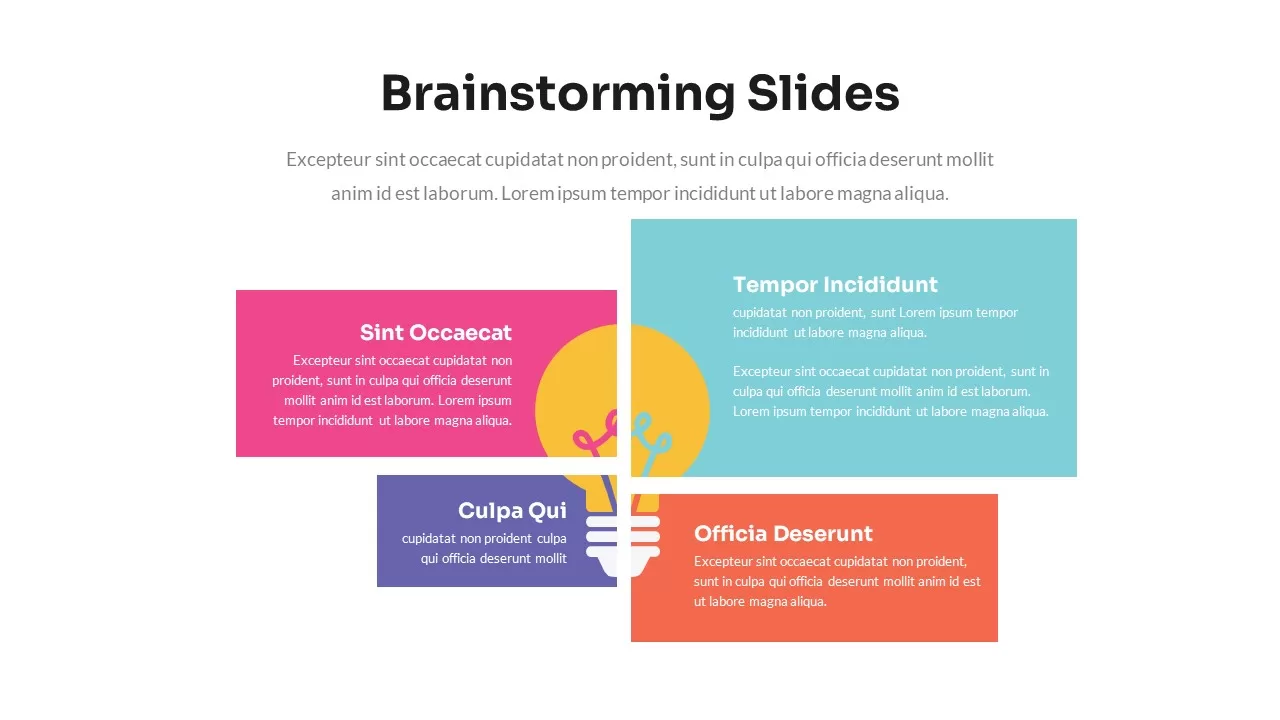
Modern Brainstorming Quadrant Slide Template for PowerPoint & Google Slides
Business Strategy
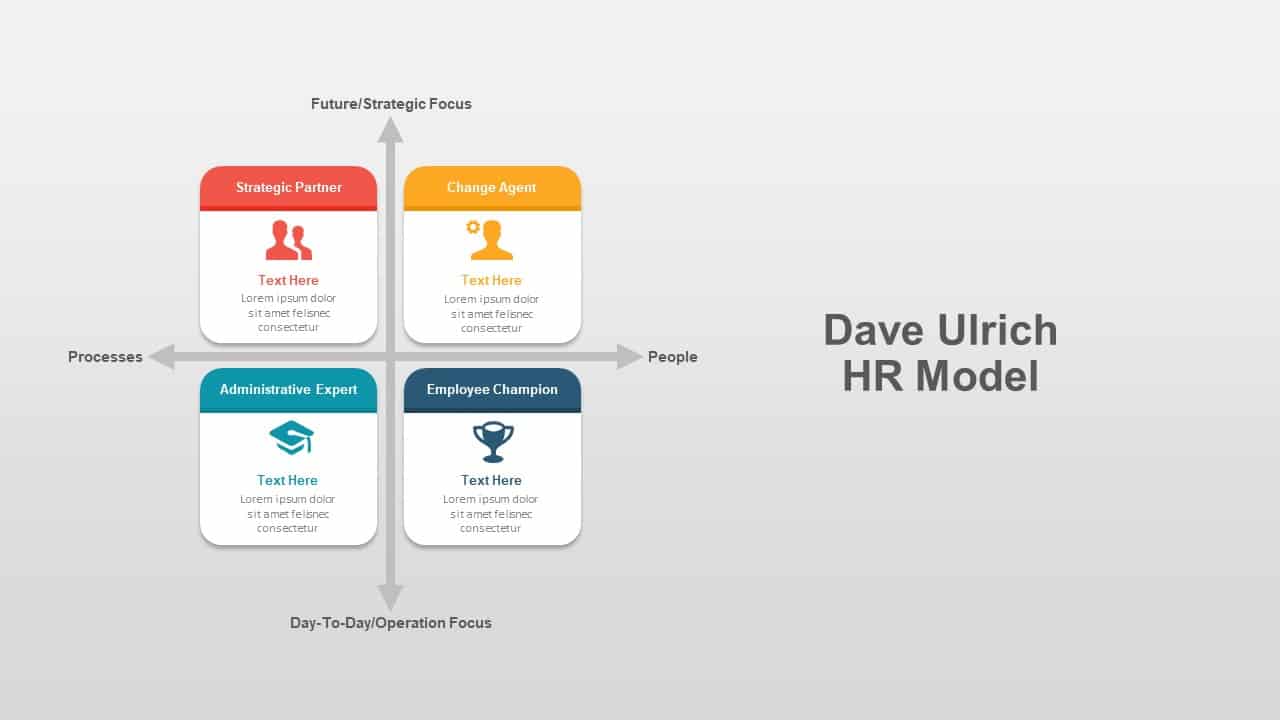
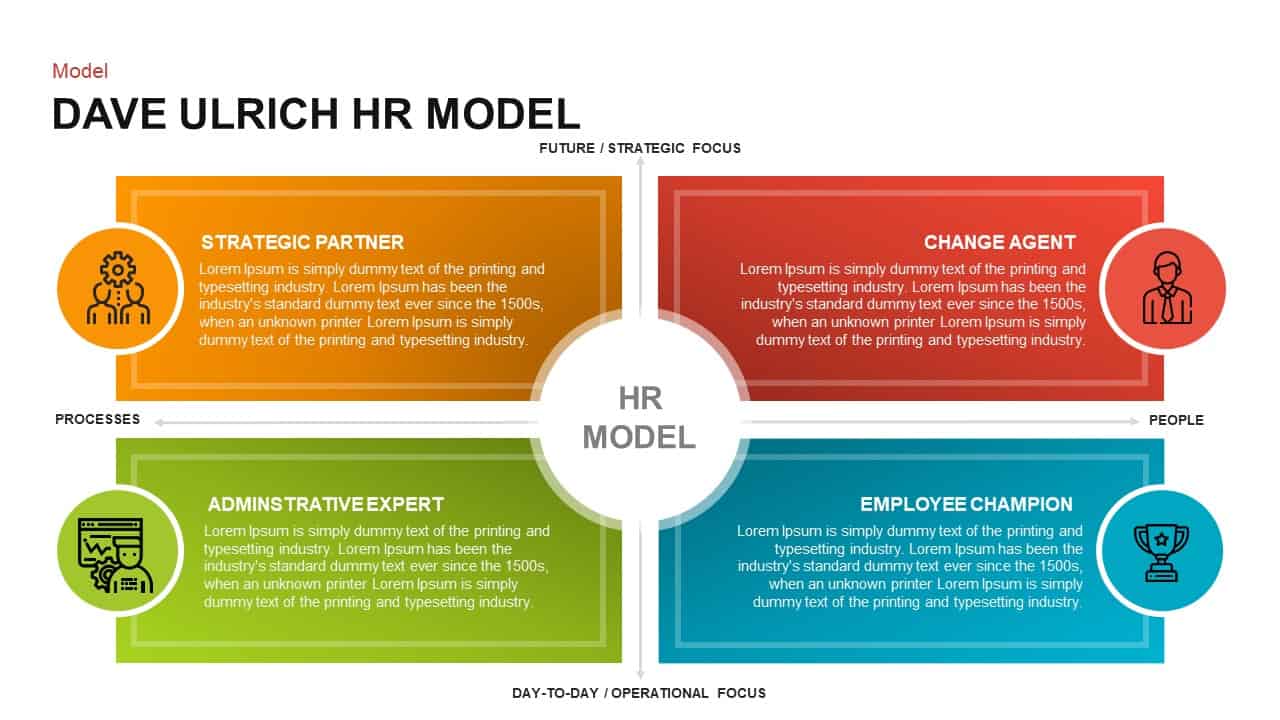
Dave Ulrich HR Model 4-Quadrant Slide Deck for PowerPoint & Google Slides
HR

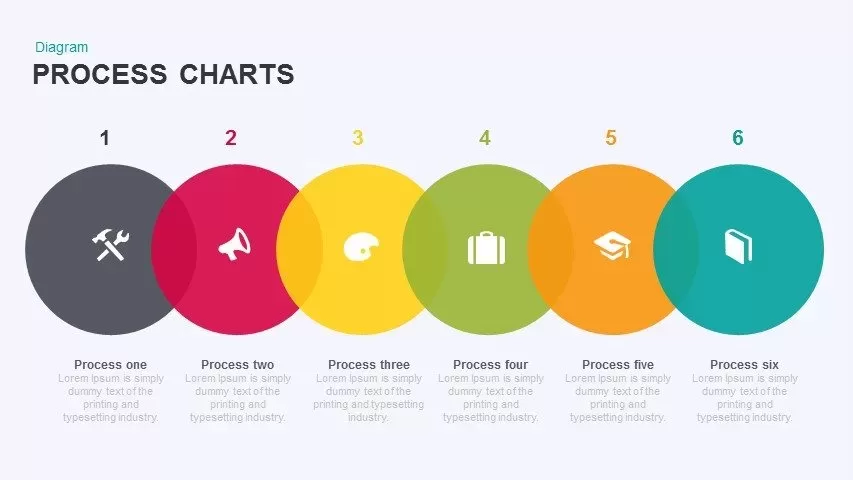
Five-Step Concept to Delivery Process Template for PowerPoint & Google Slides
Process
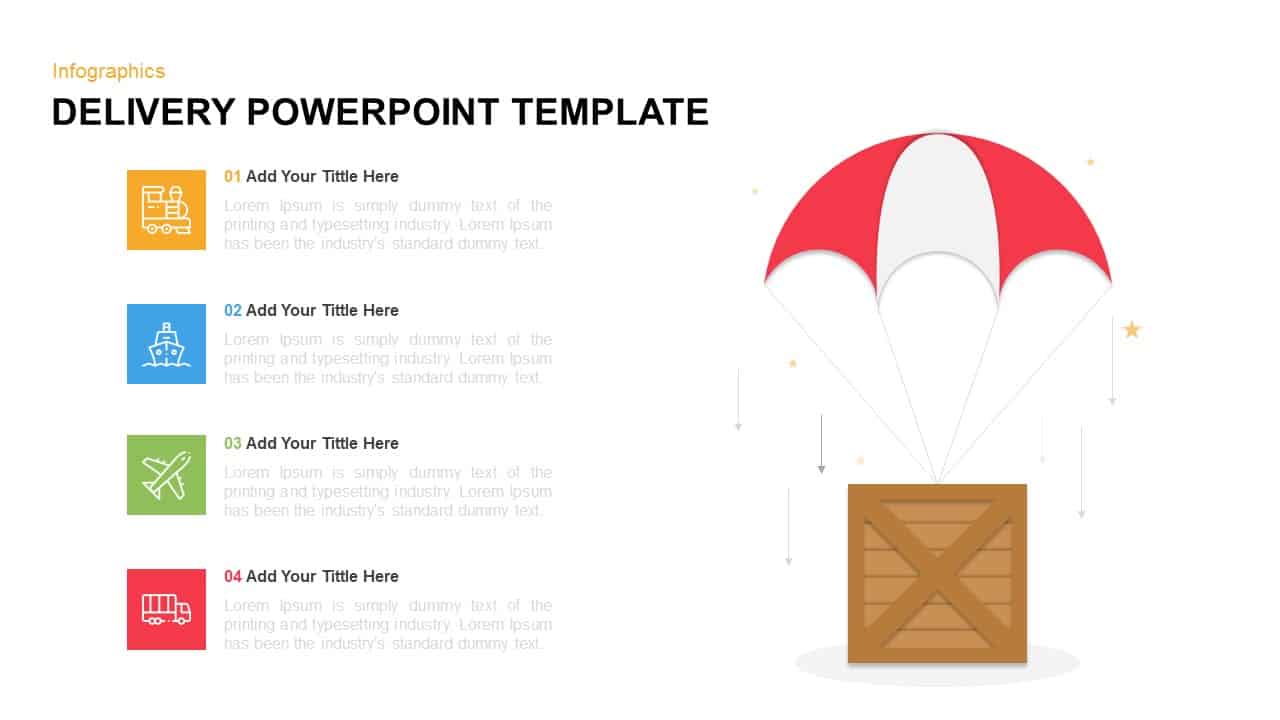
Delivery Logistics Infographic Visual Template for PowerPoint & Google Slides
Process
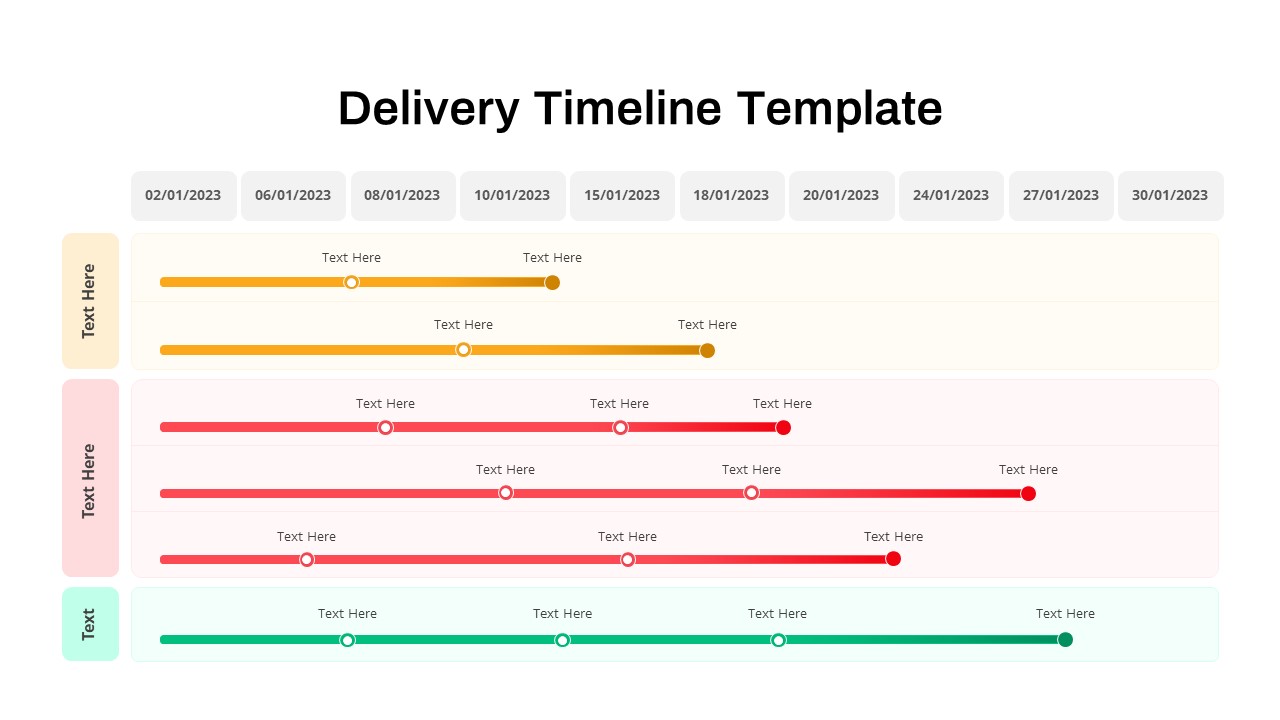
Delivery Timeline Multi-Row Template for PowerPoint & Google Slides
Timeline
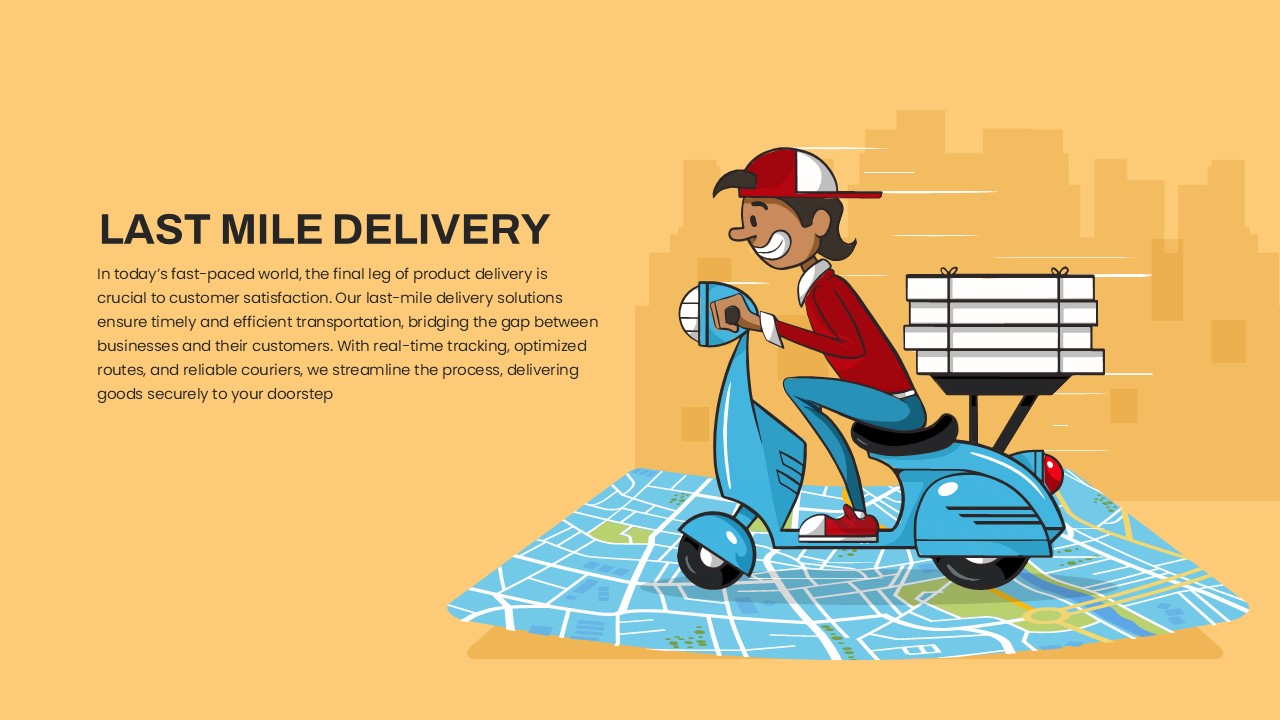
Last Mile Delivery Overview template for PowerPoint & Google Slides
Advertising
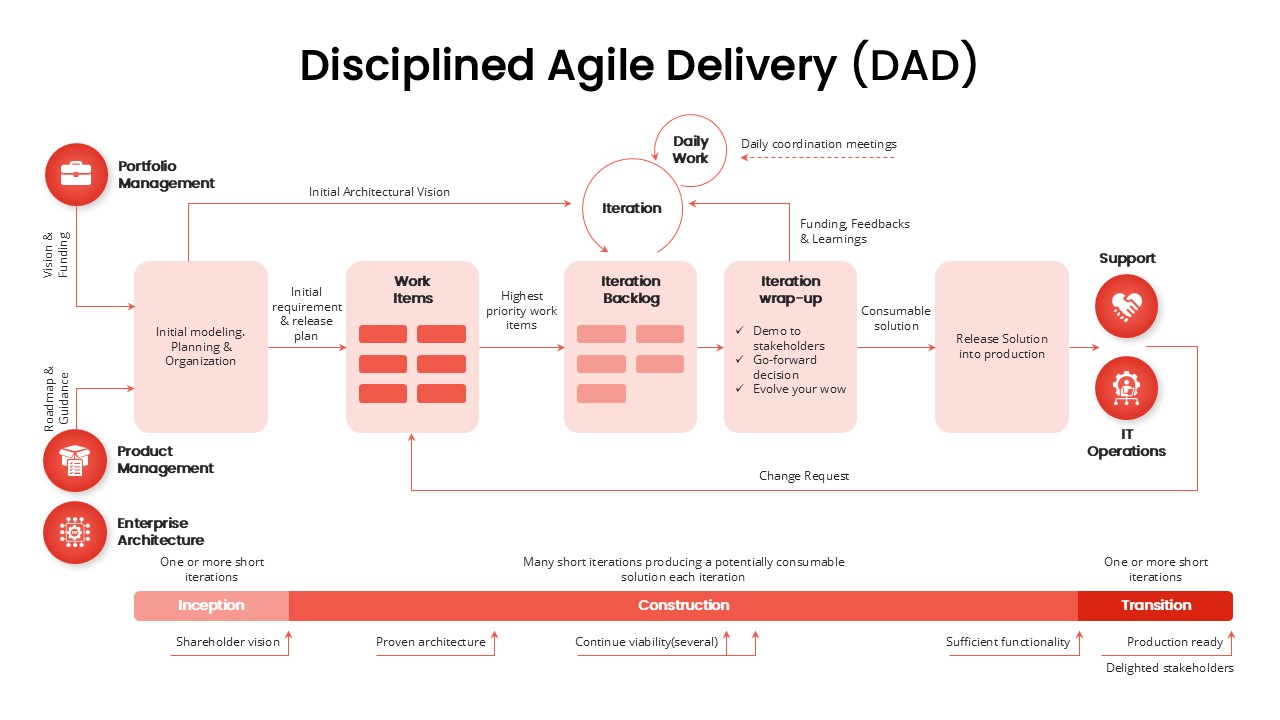
Disciplined Agile Delivery (DAD) Framework template for PowerPoint & Google Slides
Business Strategy
MVP Product Roadmap Delivery Dashboard for PowerPoint & Google Slides
Roadmap
Dave Ulrich Strategic HR Model Quadrant Template for PowerPoint & Google Slides
Employee Performance
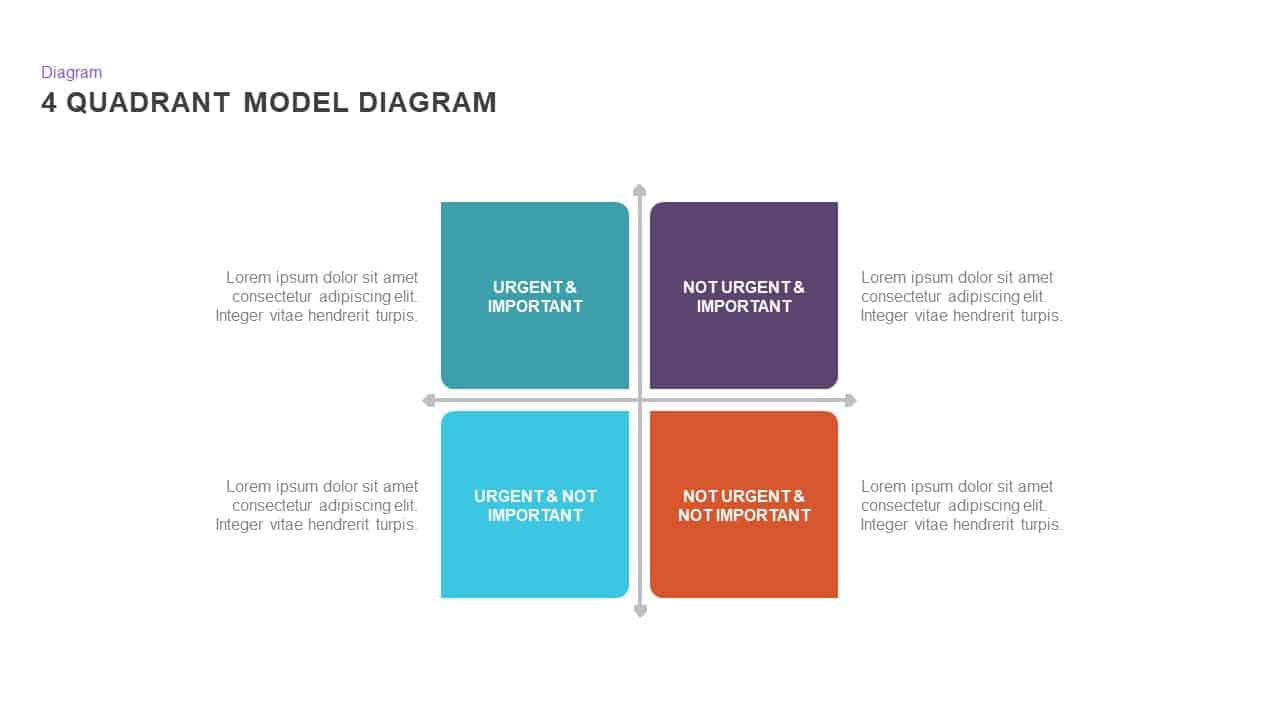
4 Quadrant Model Diagram template for PowerPoint & Google Slides
Process
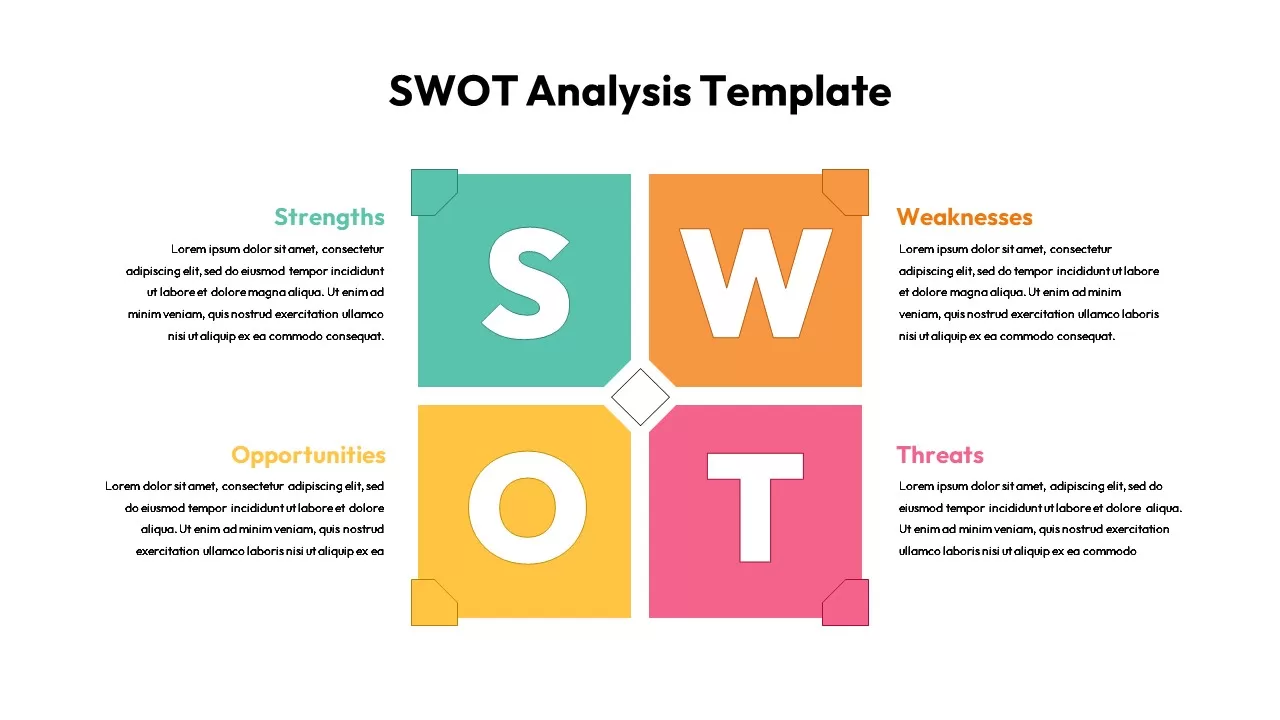
Four-Quadrant SWOT Analysis Diagram Template for PowerPoint & Google Slides
SWOT
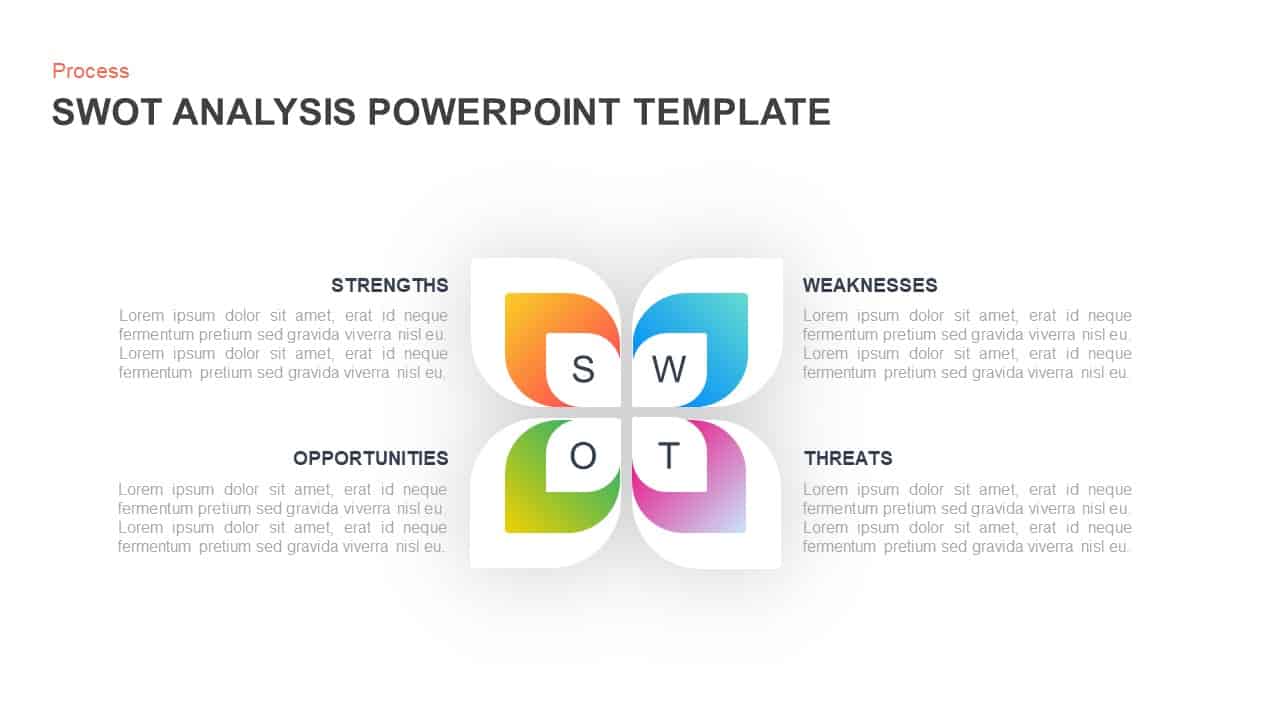
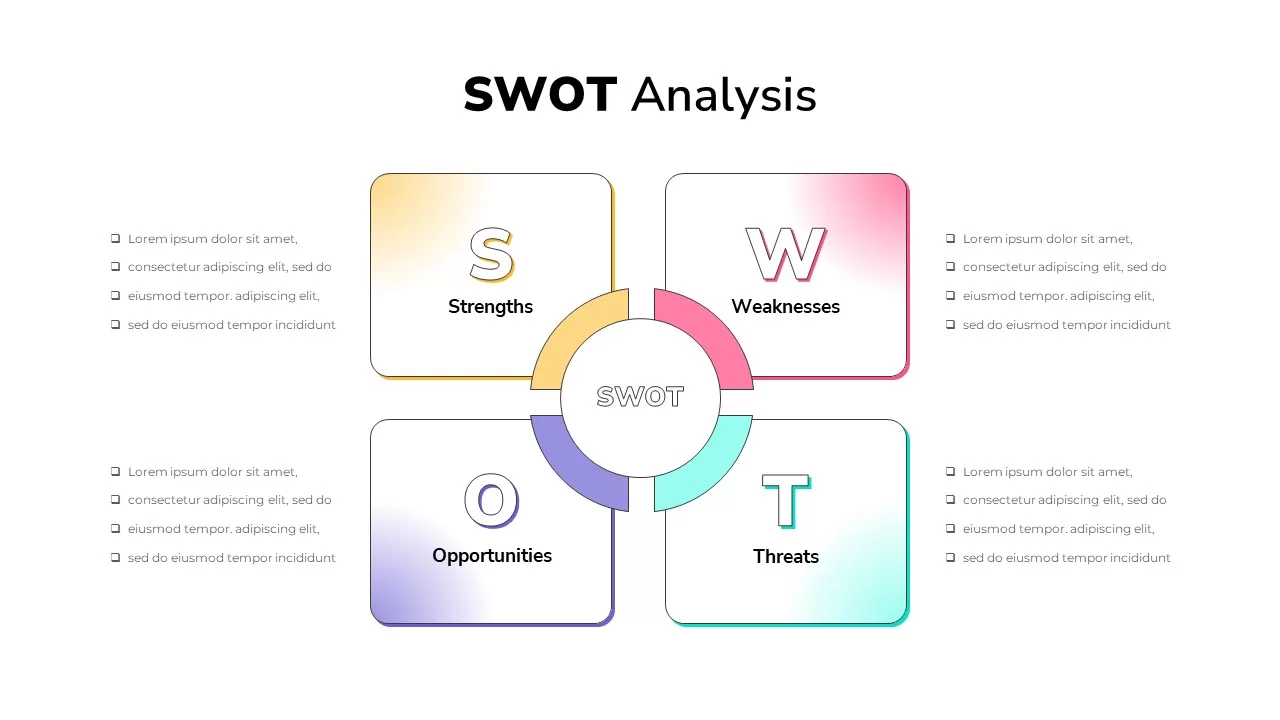
Gradient Petal SWOT Analysis Quadrant Template for PowerPoint & Google Slides
SWOT

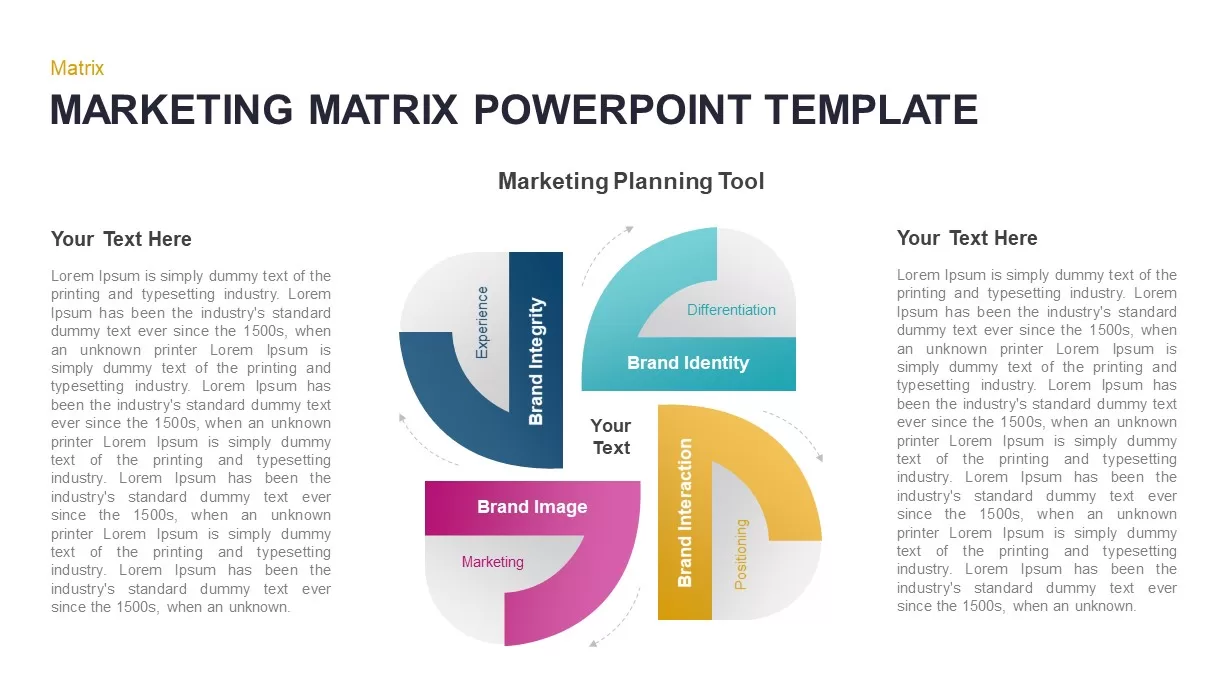
Marketing Matrix Brand Quadrant Diagram Template for PowerPoint & Google Slides
Process
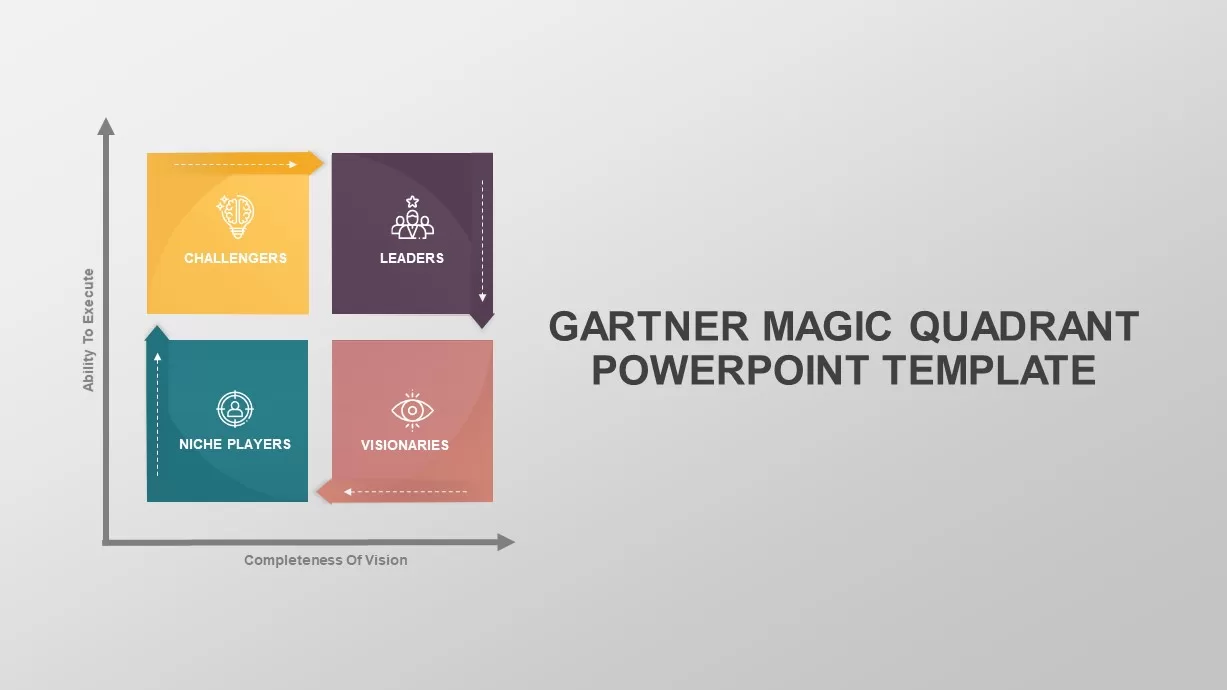
Gartner Magic Quadrant Analysis Template for PowerPoint & Google Slides
Business
Editable Four-Quadrant TOWS Matrix Template for PowerPoint & Google Slides
Opportunities Challenges
Modern Colorful SWOT Quadrant Analysis Template for PowerPoint & Google Slides
SWOT
Gradient SWOT Quadrant Diagram Template for PowerPoint & Google Slides
SWOT
Colorful SWOT Analysis Quadrant Template for PowerPoint & Google Slides
SWOT
SWOT Analysis Quadrant template for PowerPoint & Google Slides
Business Strategy
SWOT Analysis Quadrant template for PowerPoint & Google Slides
Business Strategy
Opportunities Quadrant Diagram Template for PowerPoint & Google Slides
Opportunities Challenges
Emotional Intelligence Quadrant Template for PowerPoint & Google Slides
Circular
Four Quadrant Scatter Chart Analysis Template for PowerPoint & Google Slides
Comparison Chart
Free 4 Quadrant Template for PowerPoint & Google Slides
Business
Free
Free Balanced Scorecard Quadrant KPI Layout Template for PowerPoint & Google Slides
Employee Performance
Free
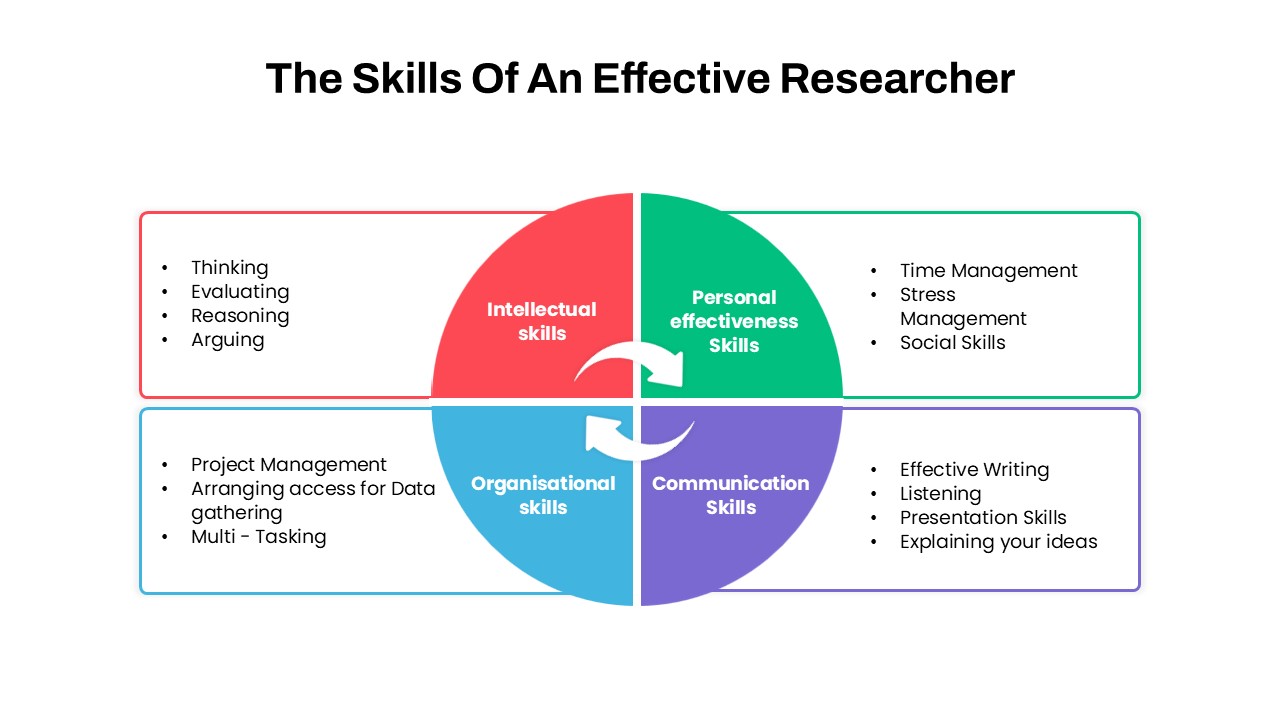
Researcher Skills Quadrant Diagram Template for PowerPoint & Google Slides
Circular
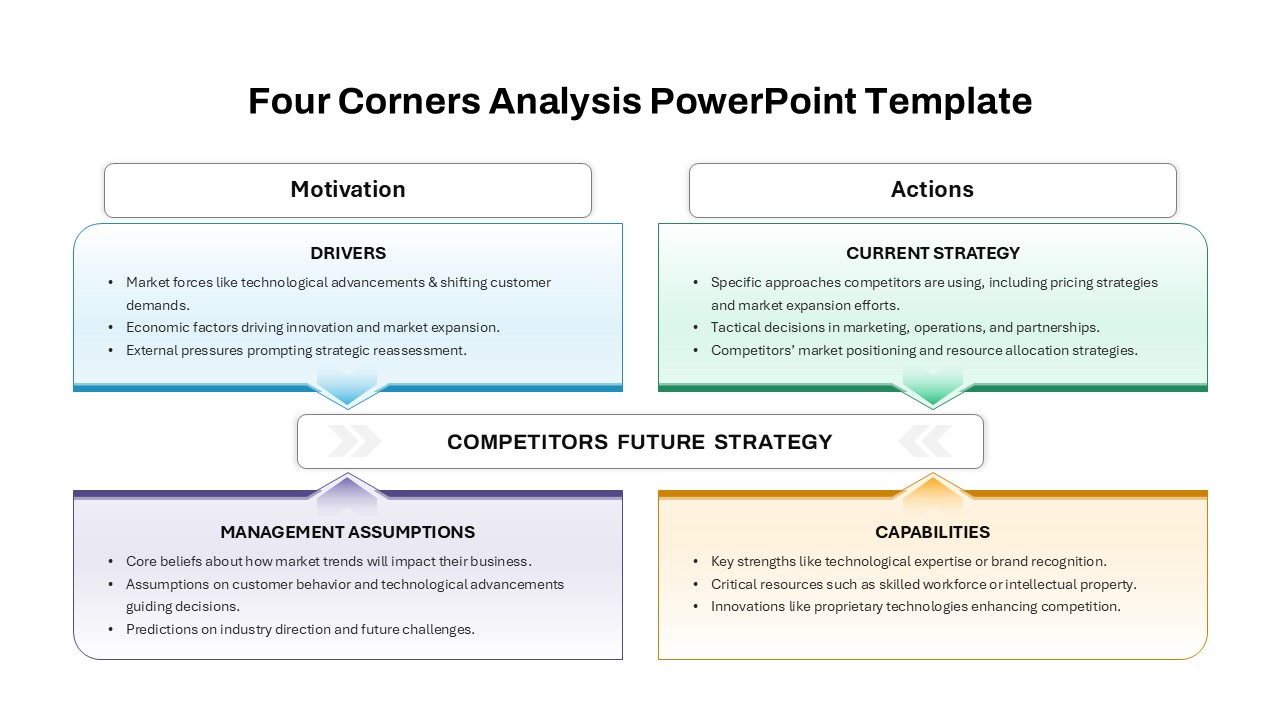
Four-Corners Strategic Analysis Quadrant Template for PowerPoint & Google Slides
SWOT
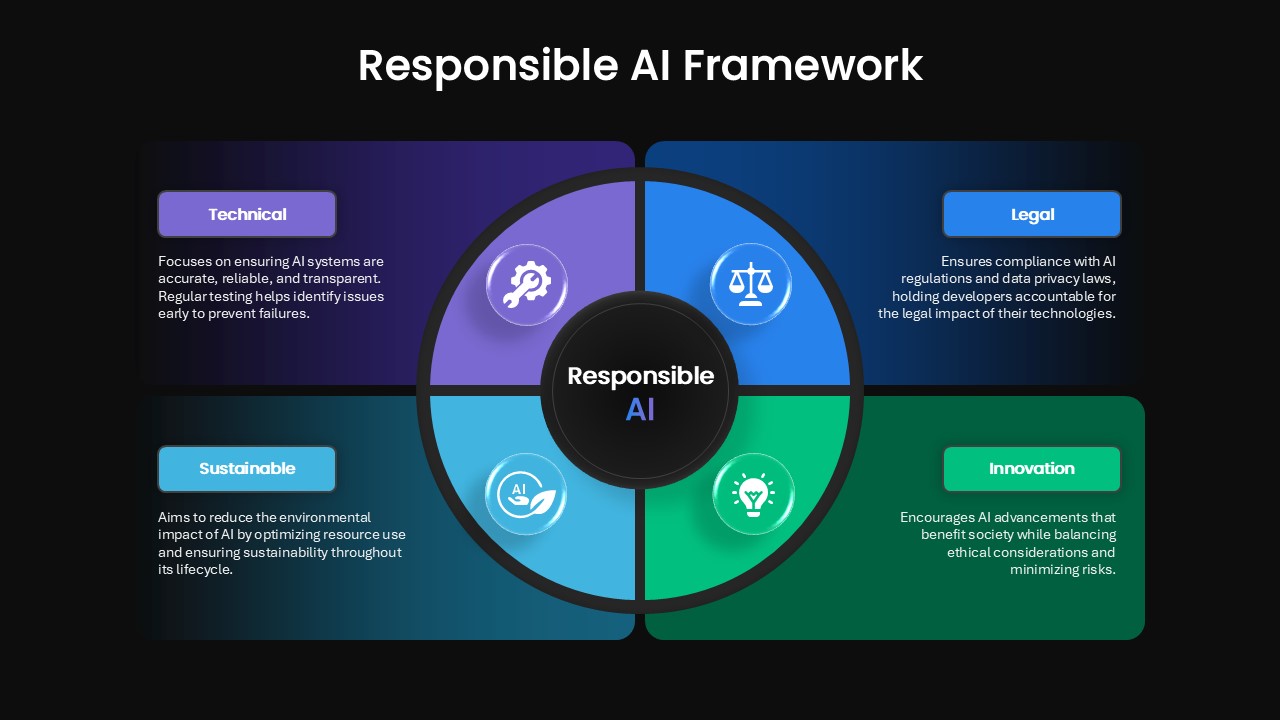
Four-Quadrant Responsible AI Framework Template for PowerPoint & Google Slides
Circular
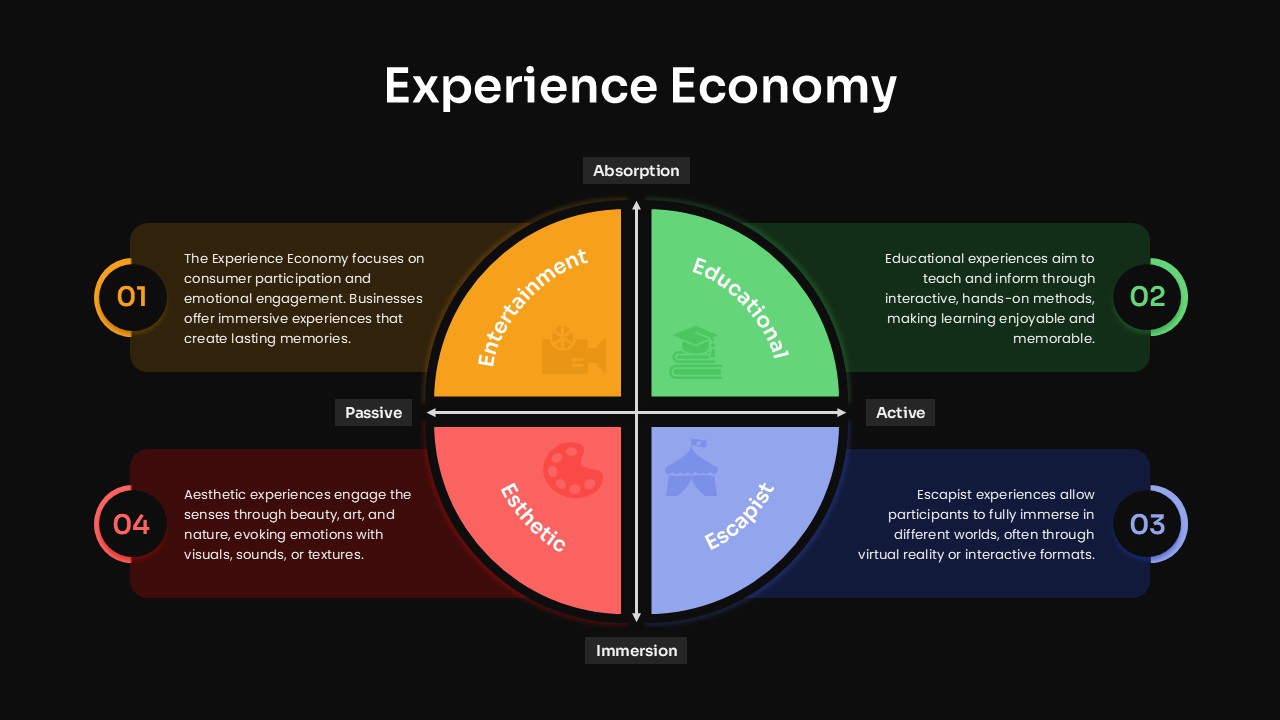
Experience Economy Quadrant Diagram Template for PowerPoint & Google Slides
Circular
Colorful SWOT Analysis Quadrant Template for PowerPoint & Google Slides
SWOT
Multi Color SWOT Analysis Quadrant Template for PowerPoint & Google Slides
SWOT
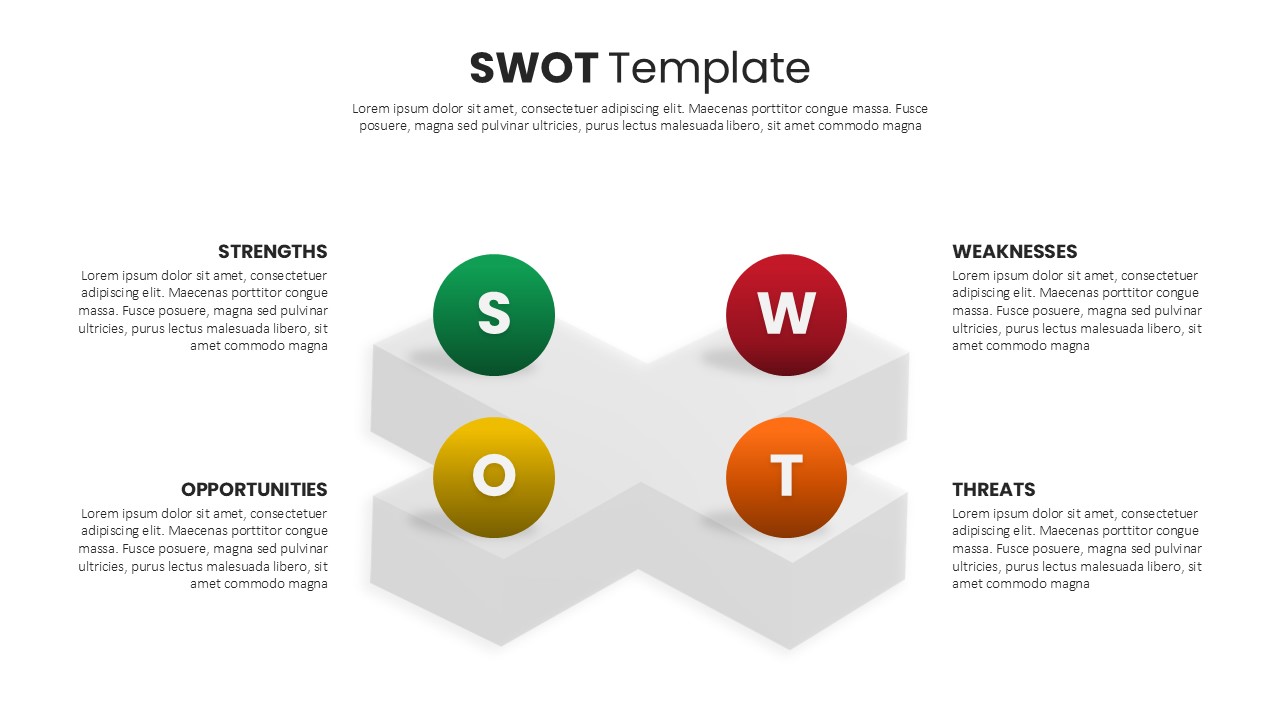
3D Quadrant SWOT Analysis Template for PowerPoint & Google Slides
SWOT
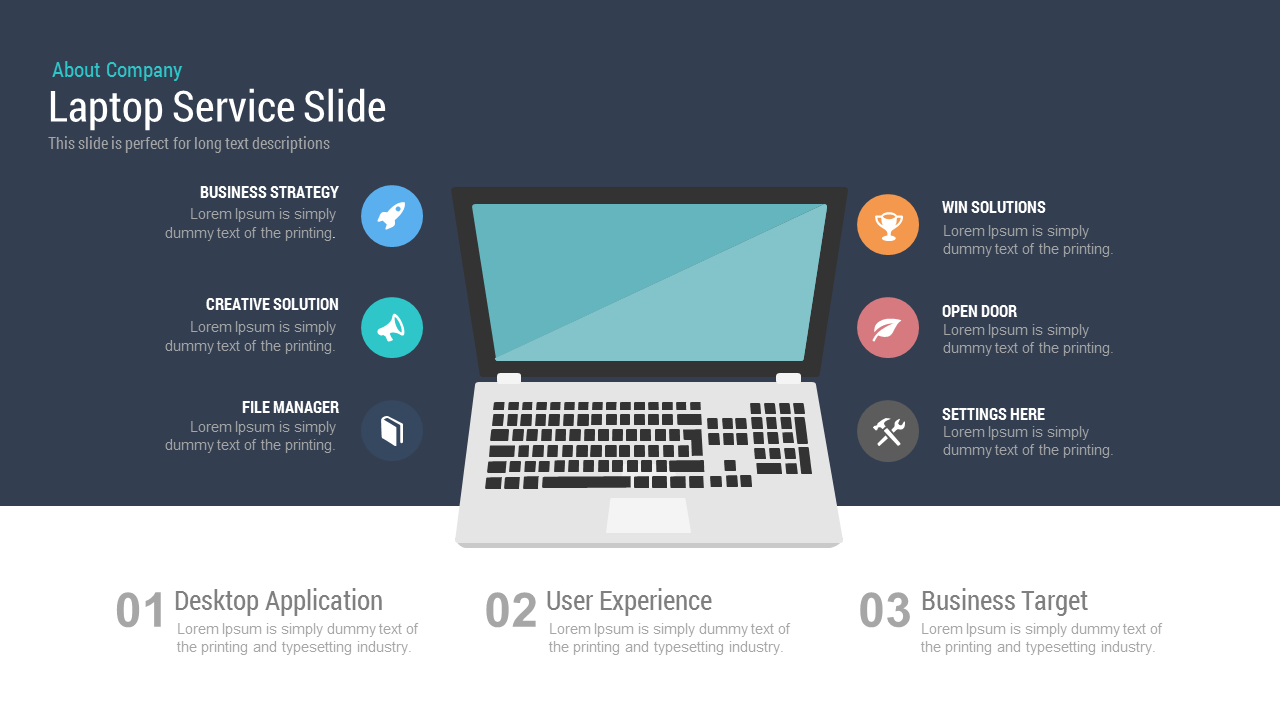
Free Laptop Service Slide template for PowerPoint & Google Slides
Business
Free
Clean Mobile Service Comparison Slide Template for PowerPoint & Google Slides
Comparison

Cleaning Service Blue Theme Slide Deck Template for PowerPoint & Google Slides
Pitch Deck
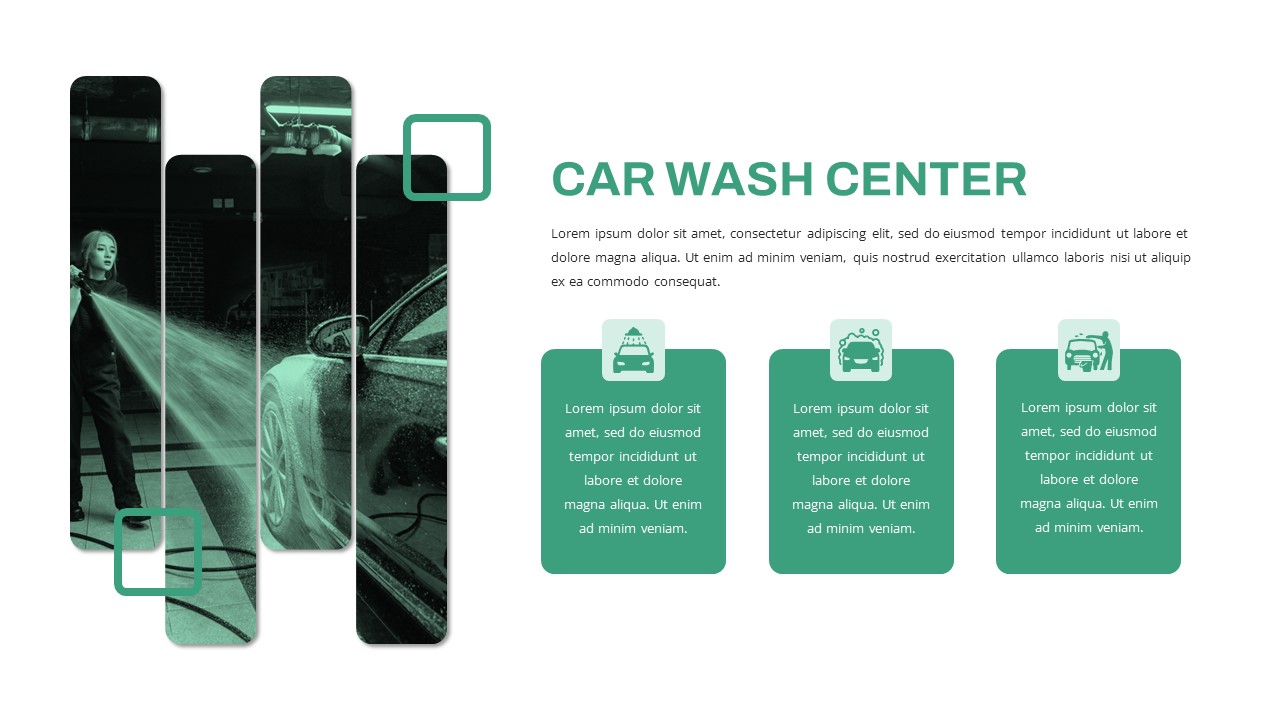
Free Car Wash Center Service Features Slide Template for PowerPoint & Google Slides
Business Proposal
Free
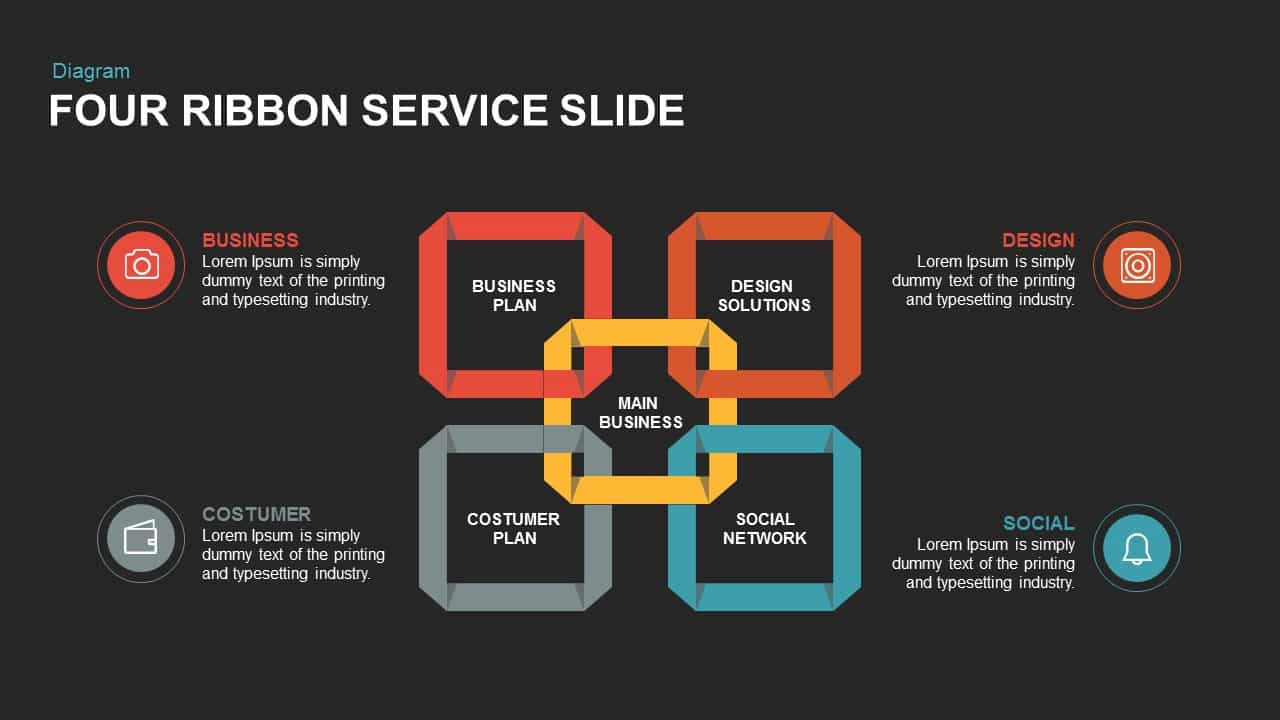
Four Ribbon Service Slide for PowerPoint & Google Slides
Infographics
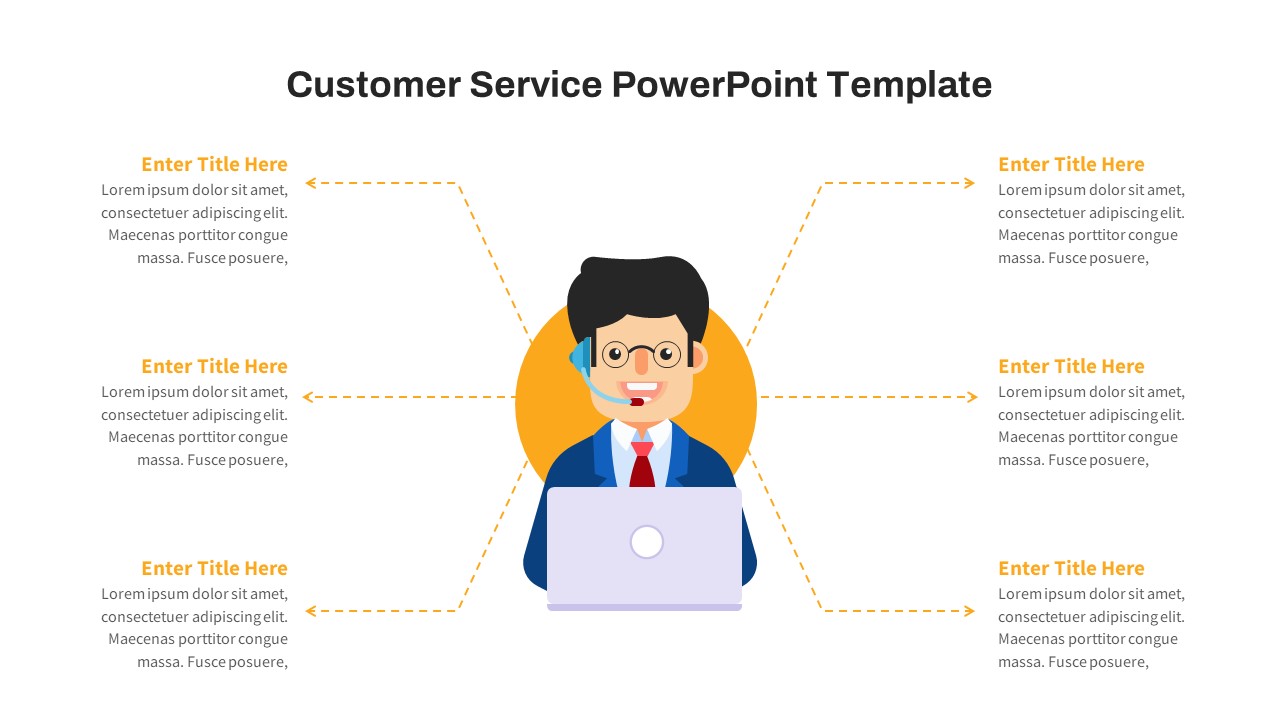
Free Customer Service Breakdown Slide for PowerPoint & Google Slides
Infographics
Free
Service Zoom Feature Slides Comparison template for PowerPoint & Google Slides
Process
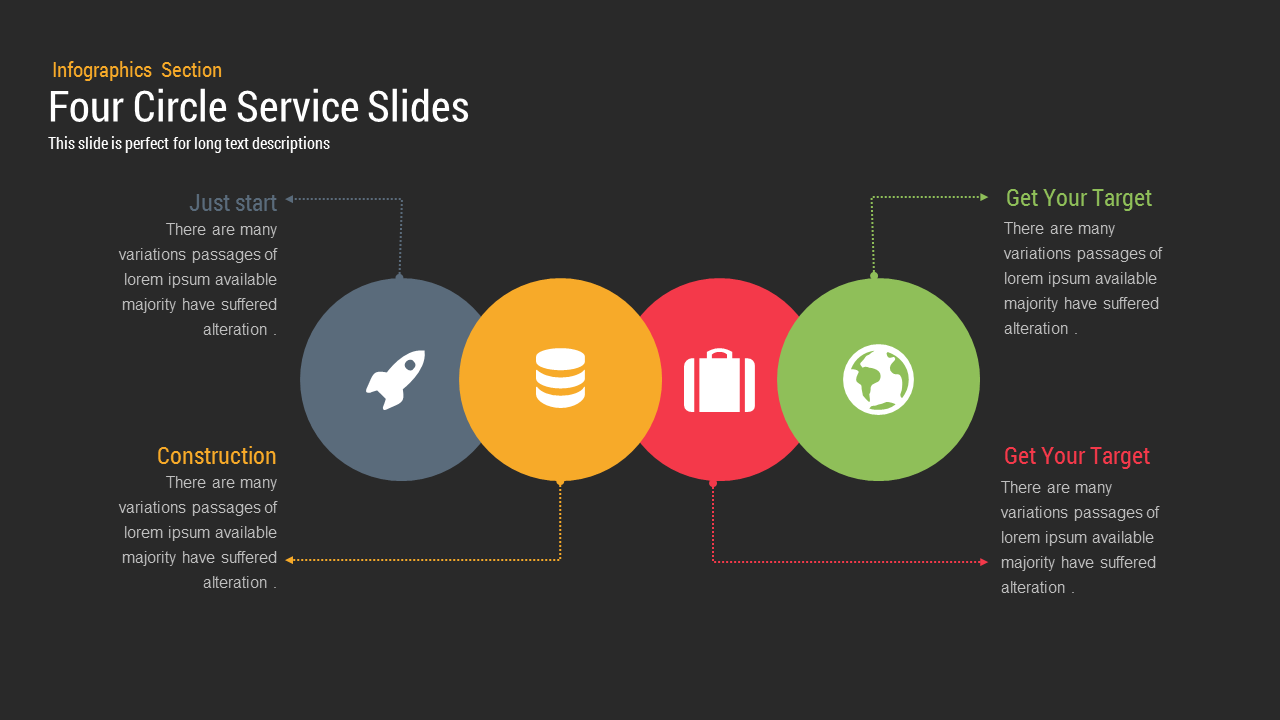
Four Circle Service template for PowerPoint & Google Slides
Process

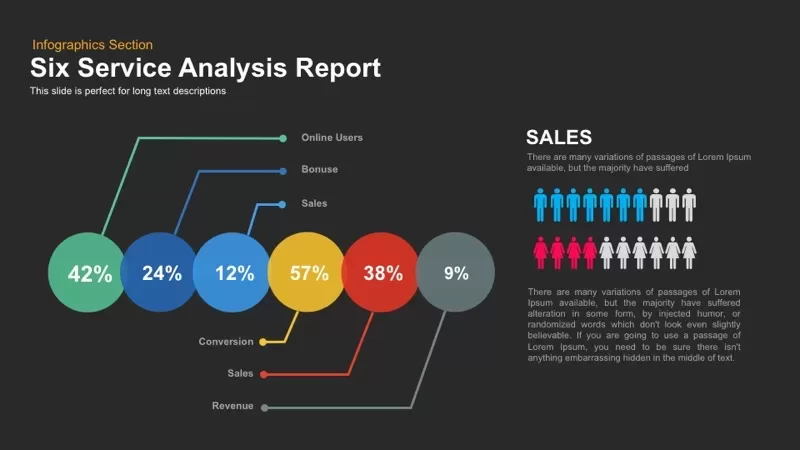
Six Service Analysis Report template for PowerPoint & Google Slides
Infographics
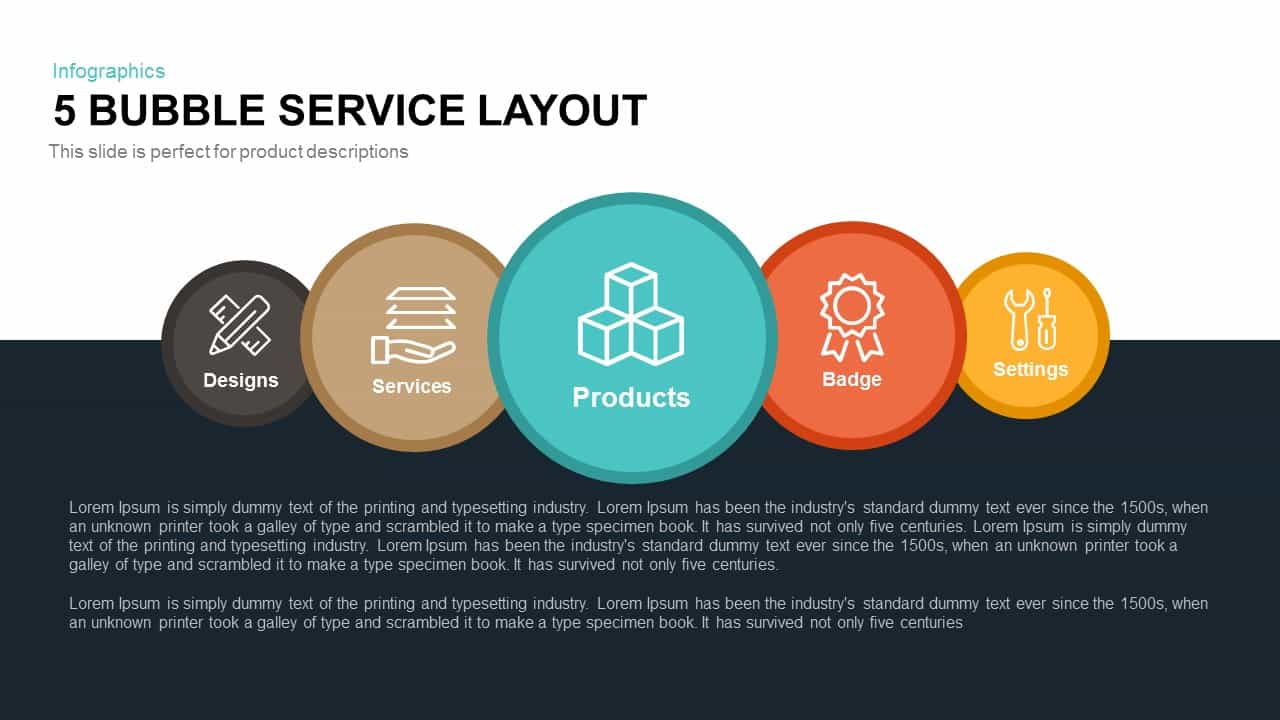
5 Bubble Service Layout Diagram Template for PowerPoint & Google Slides
Process
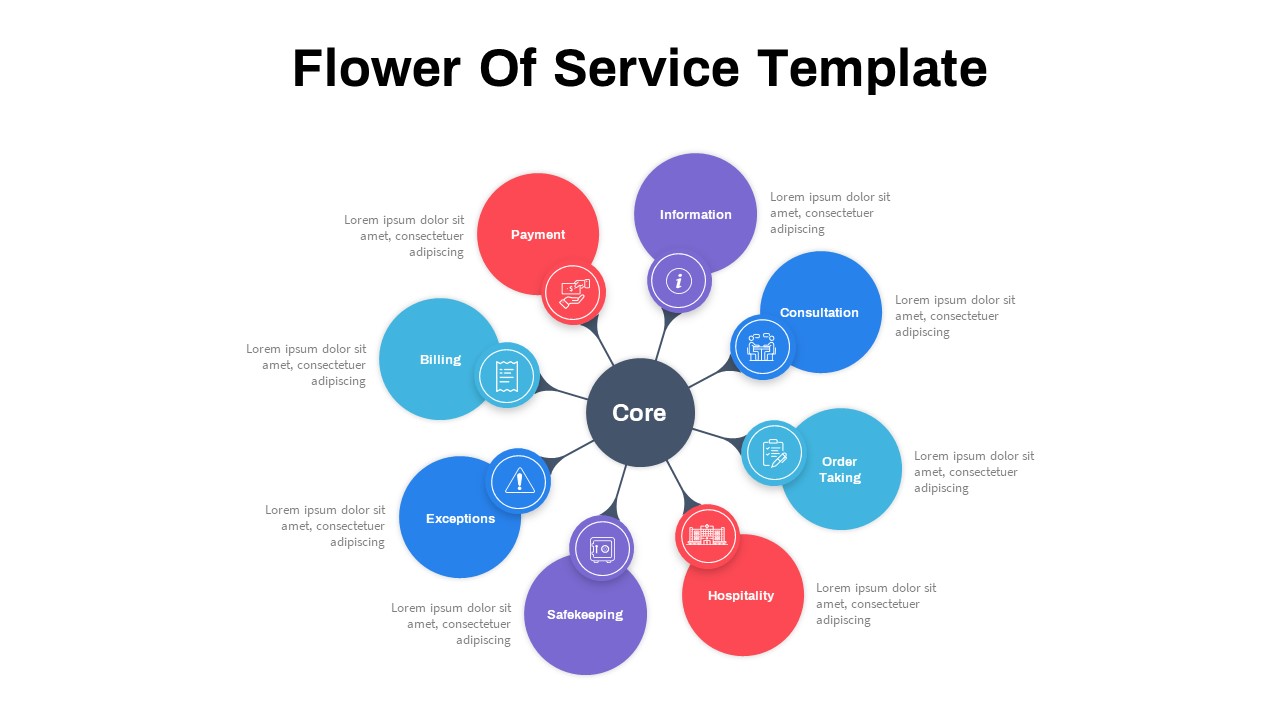
Flower of Service template for PowerPoint & Google Slides
Process
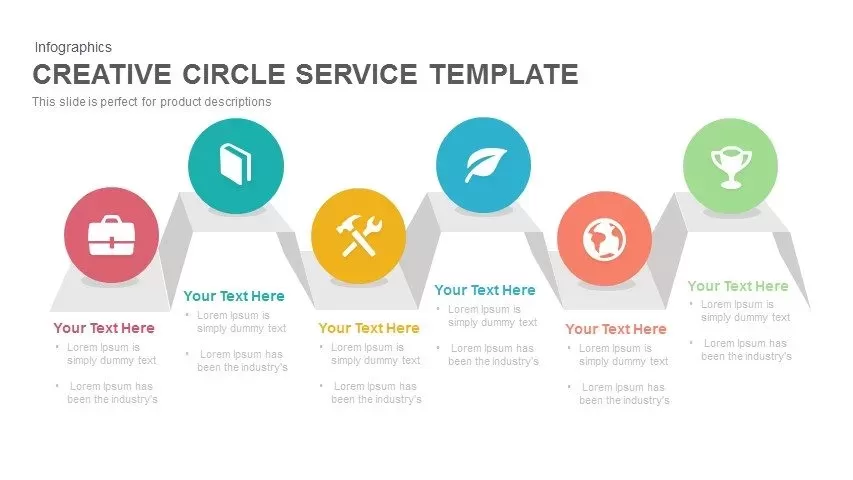
Creative Zigzag Circle Service Steps Template for PowerPoint & Google Slides
Process
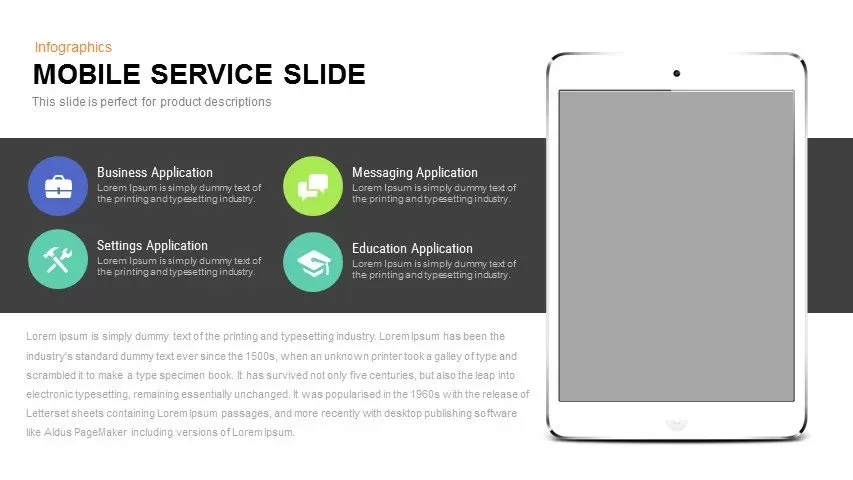
Mobile Service Features Infographic Template for PowerPoint & Google Slides
Process
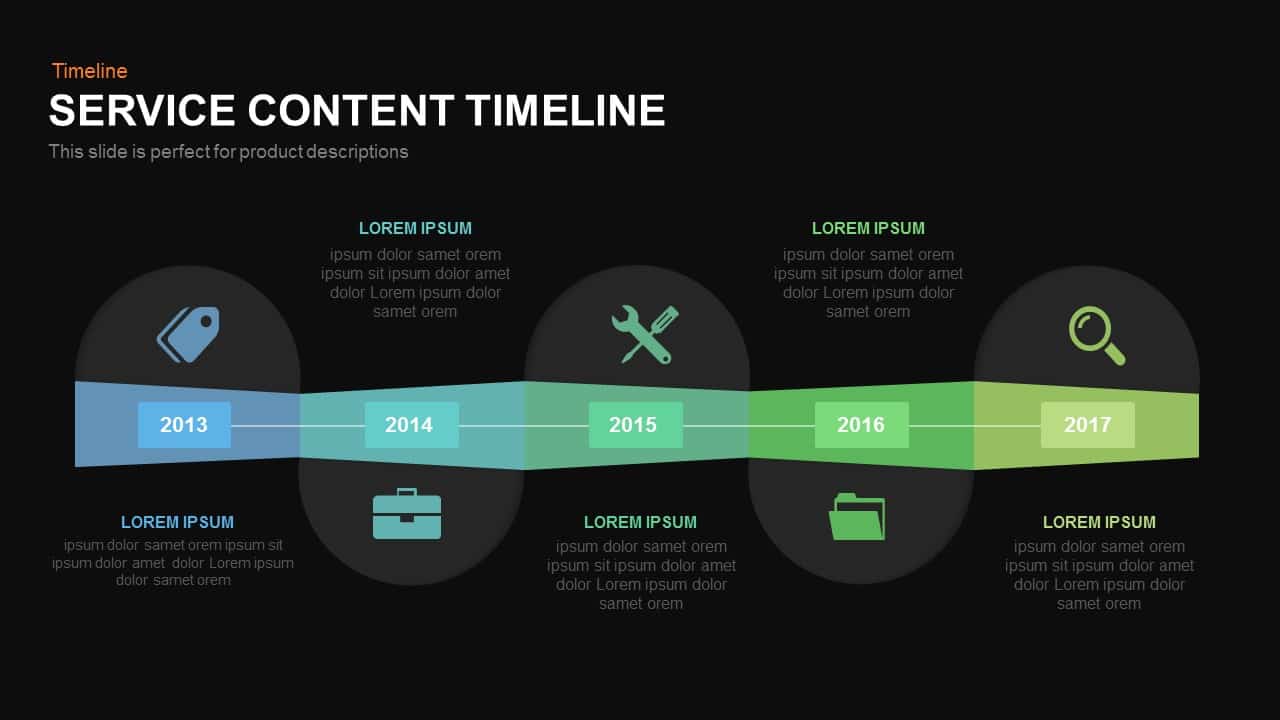
Service Content Timeline Diagram Template for PowerPoint & Google Slides
Timeline
Professional Box Service Diagram Template for PowerPoint & Google Slides
Comparison

Service Features Presentation template for PowerPoint & Google Slides
Business Proposal
Customer Service Strategy template for PowerPoint & Google Slides
Business Strategy

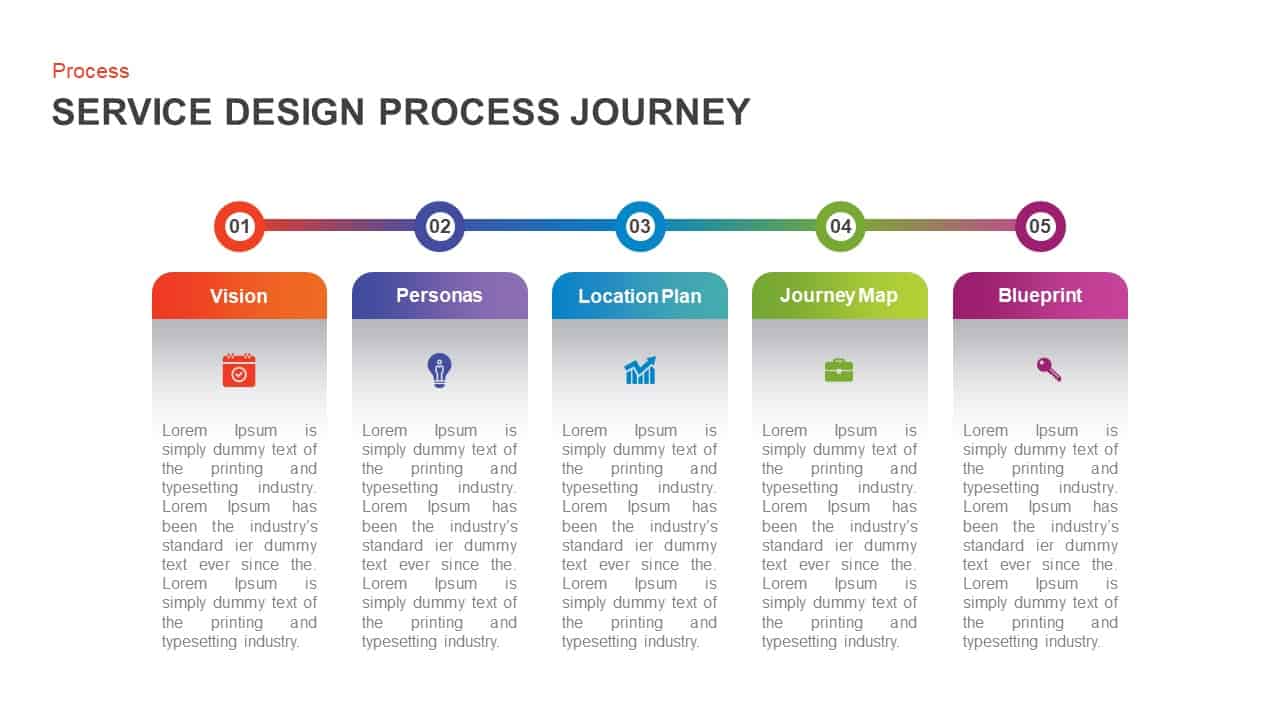
Service Design Process Journey template for PowerPoint & Google Slides
Process
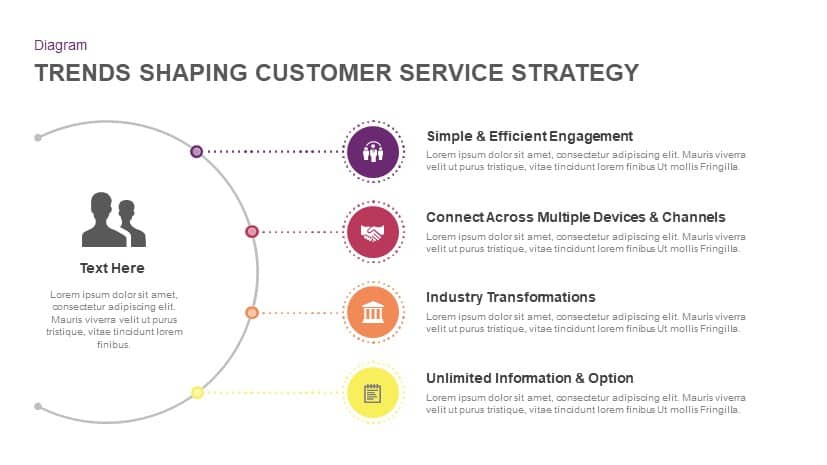
Trends Shaping Customer Service Strategy template for PowerPoint & Google Slides
Marketing
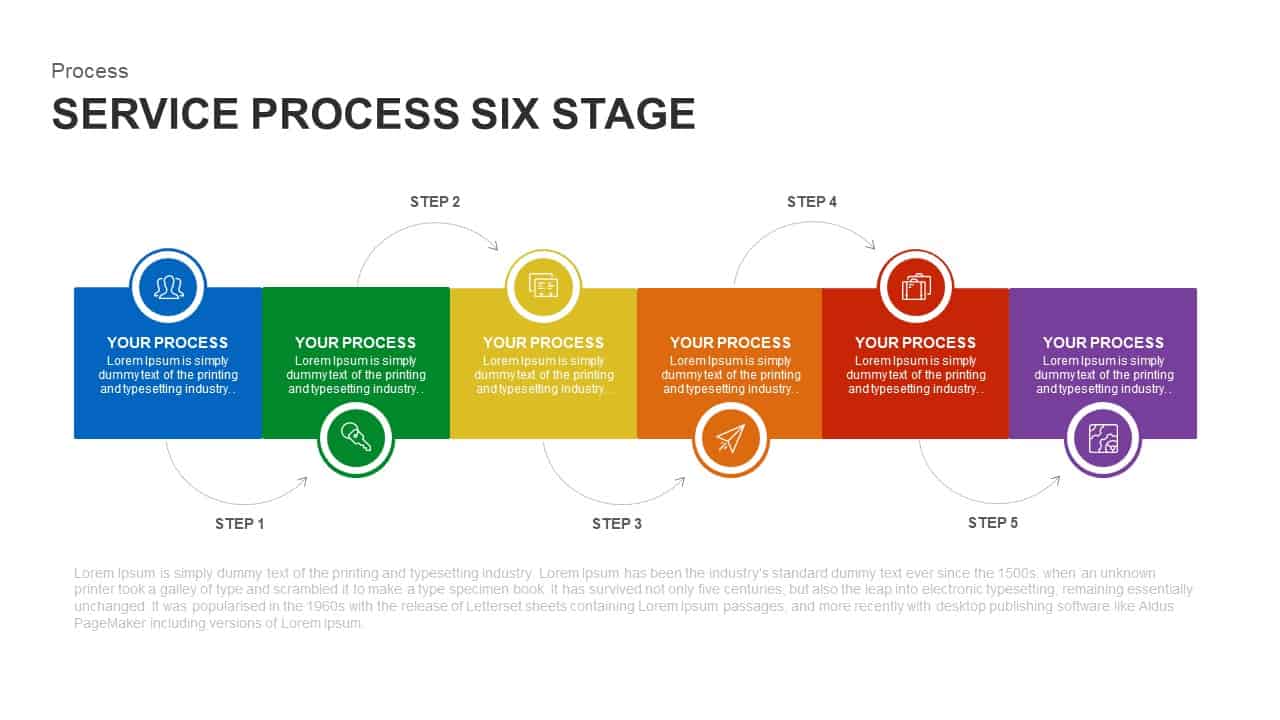
Six-Stage Service Process Workflow Template for PowerPoint & Google Slides
Process
Service Design Process Journey Template for PowerPoint & Google Slides
Process
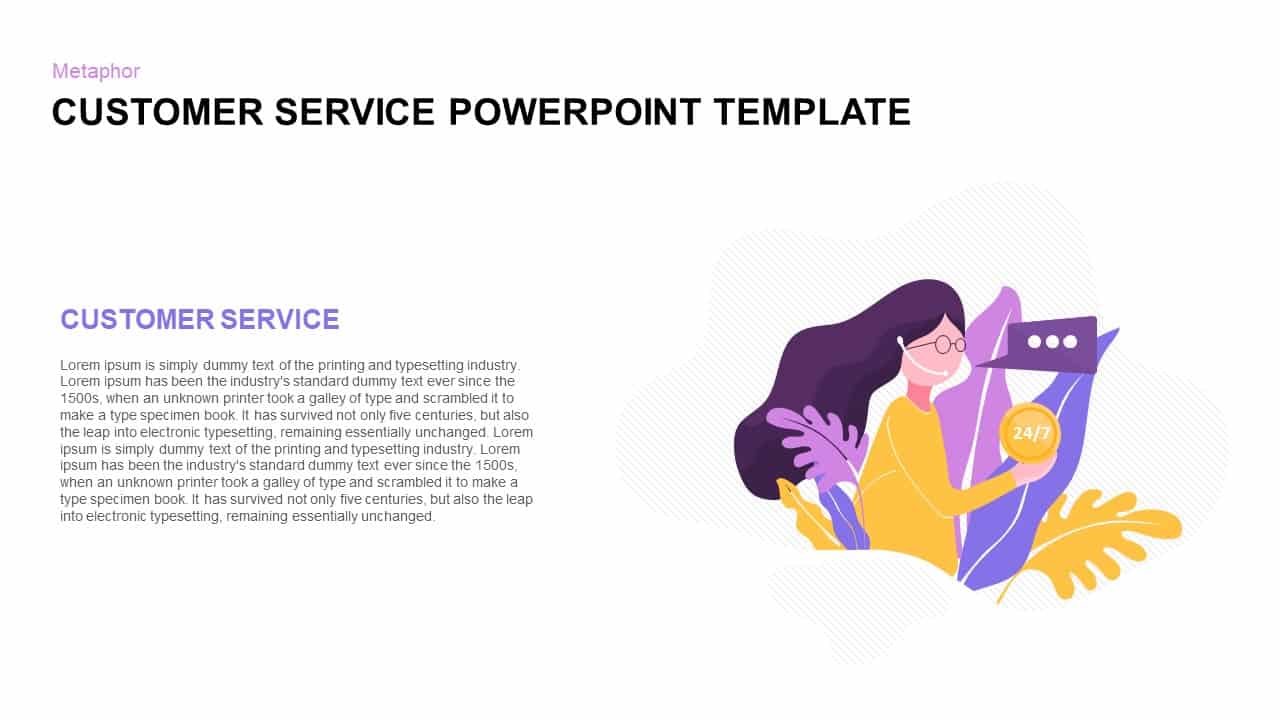
Customer Service Metaphor Infographic Template for PowerPoint & Google Slides
Customer Experience
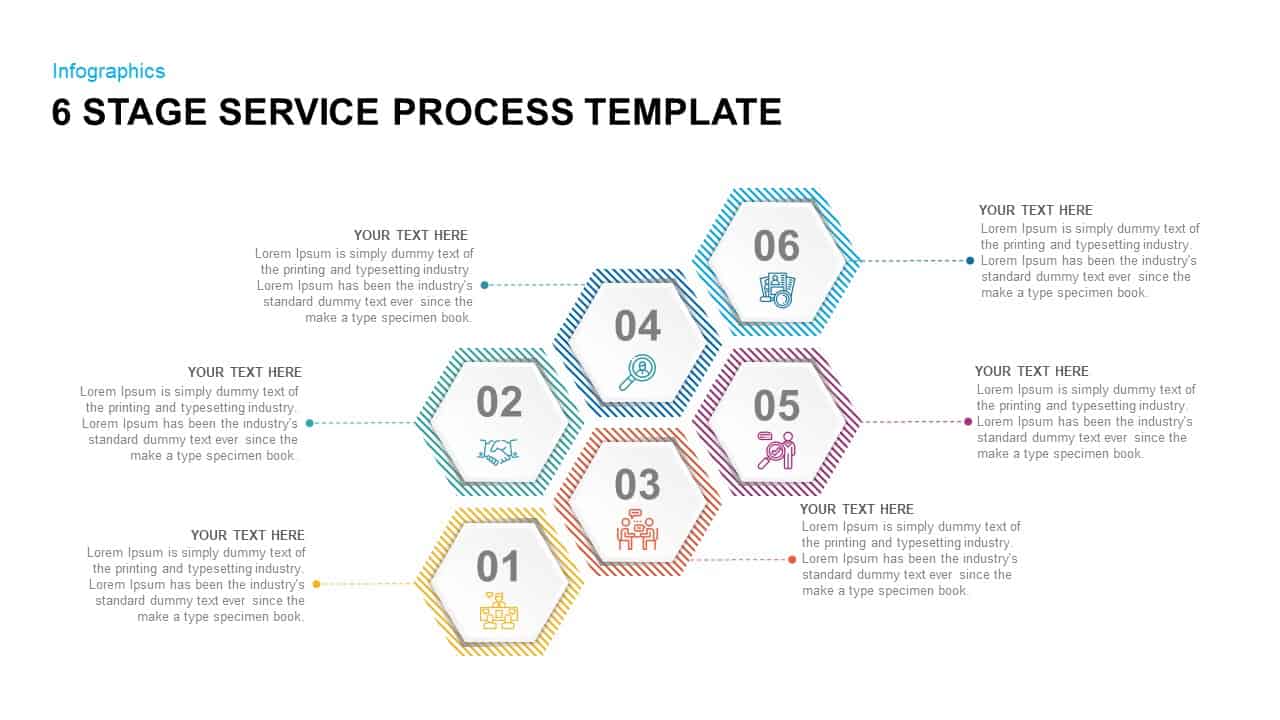
6 Stage Service Process Infographic Template for PowerPoint & Google Slides
Process
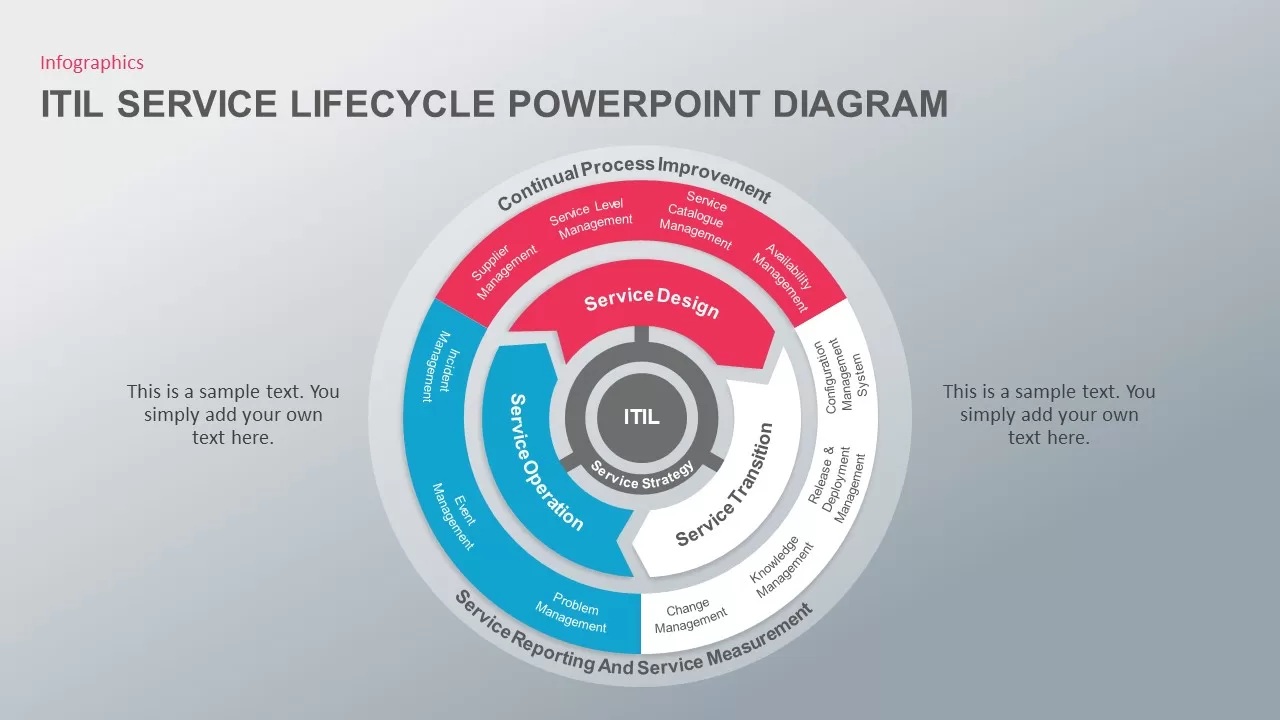
ITIL Service Lifecycle Circular Diagram Template for PowerPoint & Google Slides
Circular

Streaming Service Overview template for PowerPoint & Google Slides
Business Proposal
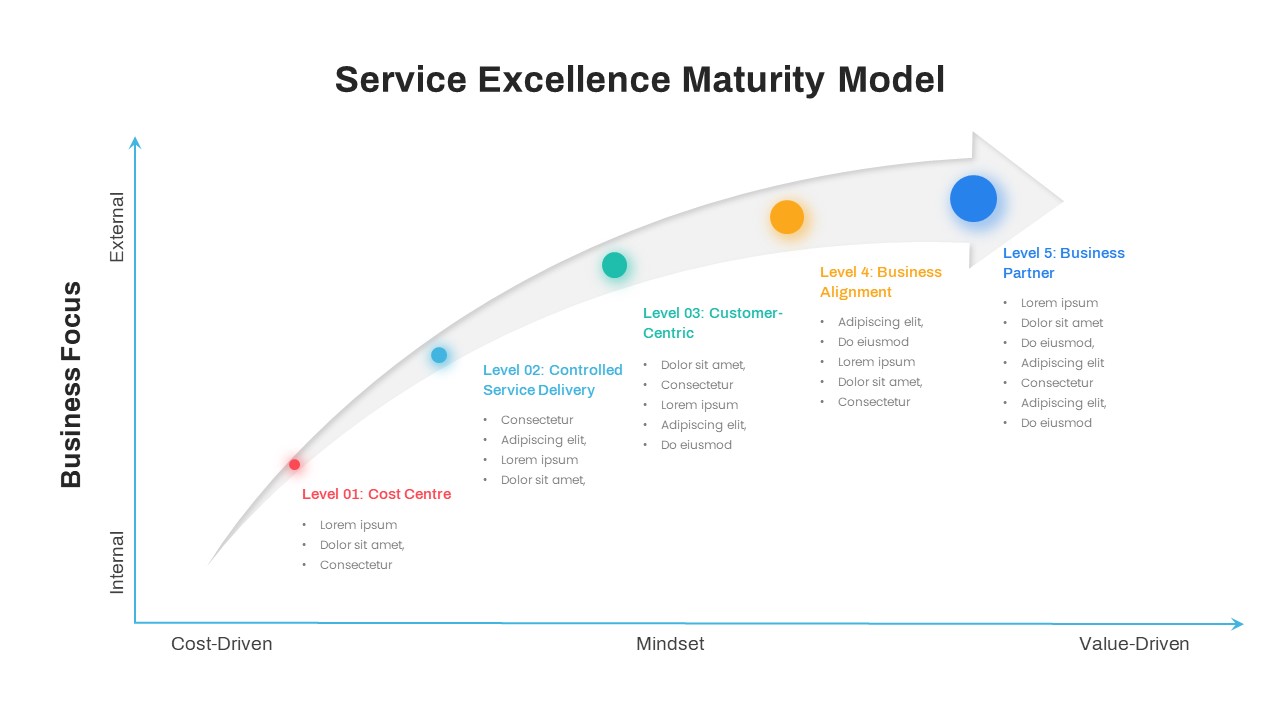
Service Excellence Maturity 5-Stage Template for PowerPoint & Google Slides
Process
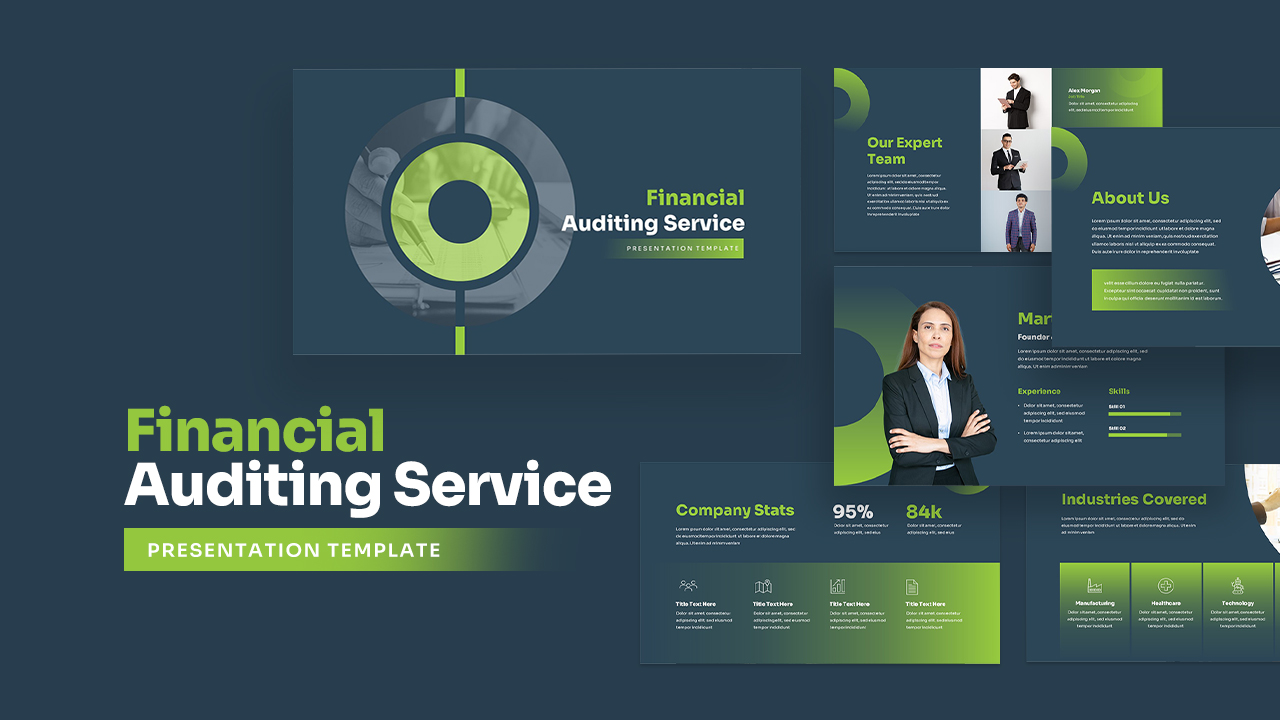
Corporate Financial Auditing Service Template for PowerPoint & Google Slides
Finance
Financial Advisory Service Pitch Deck Template for PowerPoint & Google Slides
Finance
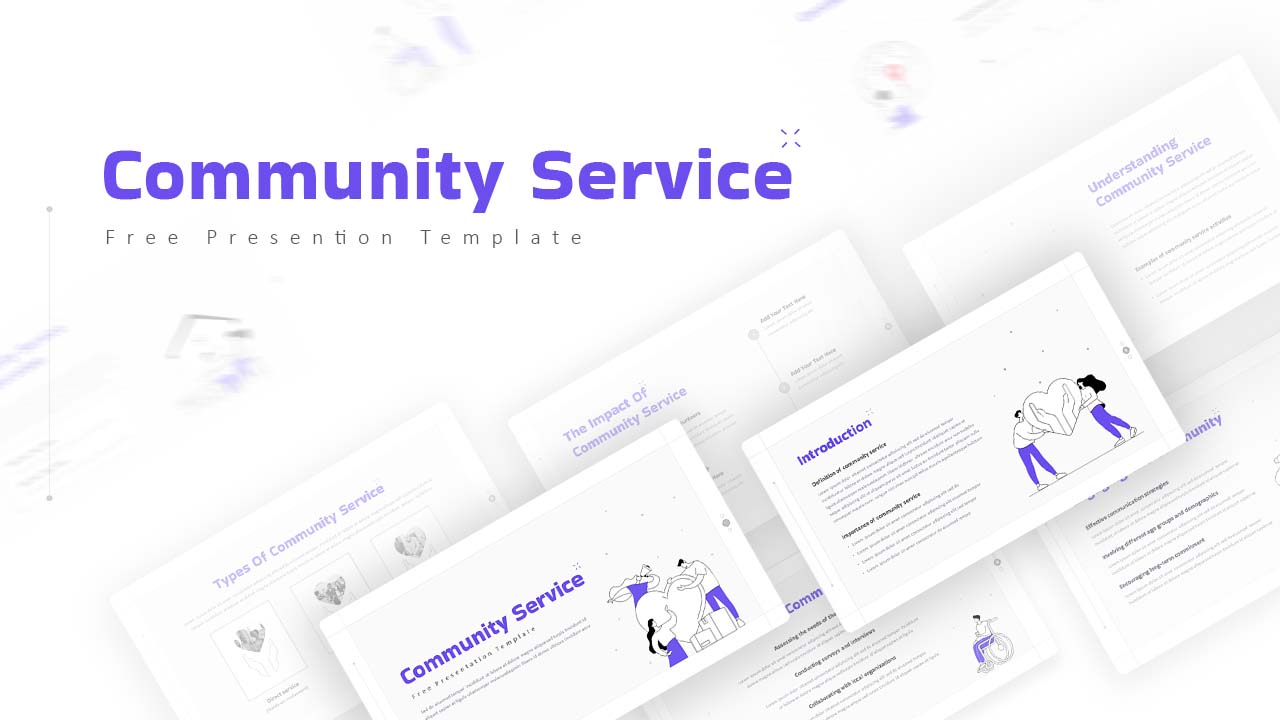
Free Community Service Presentation Deck Template for PowerPoint & Google Slides
Company Profile
Free
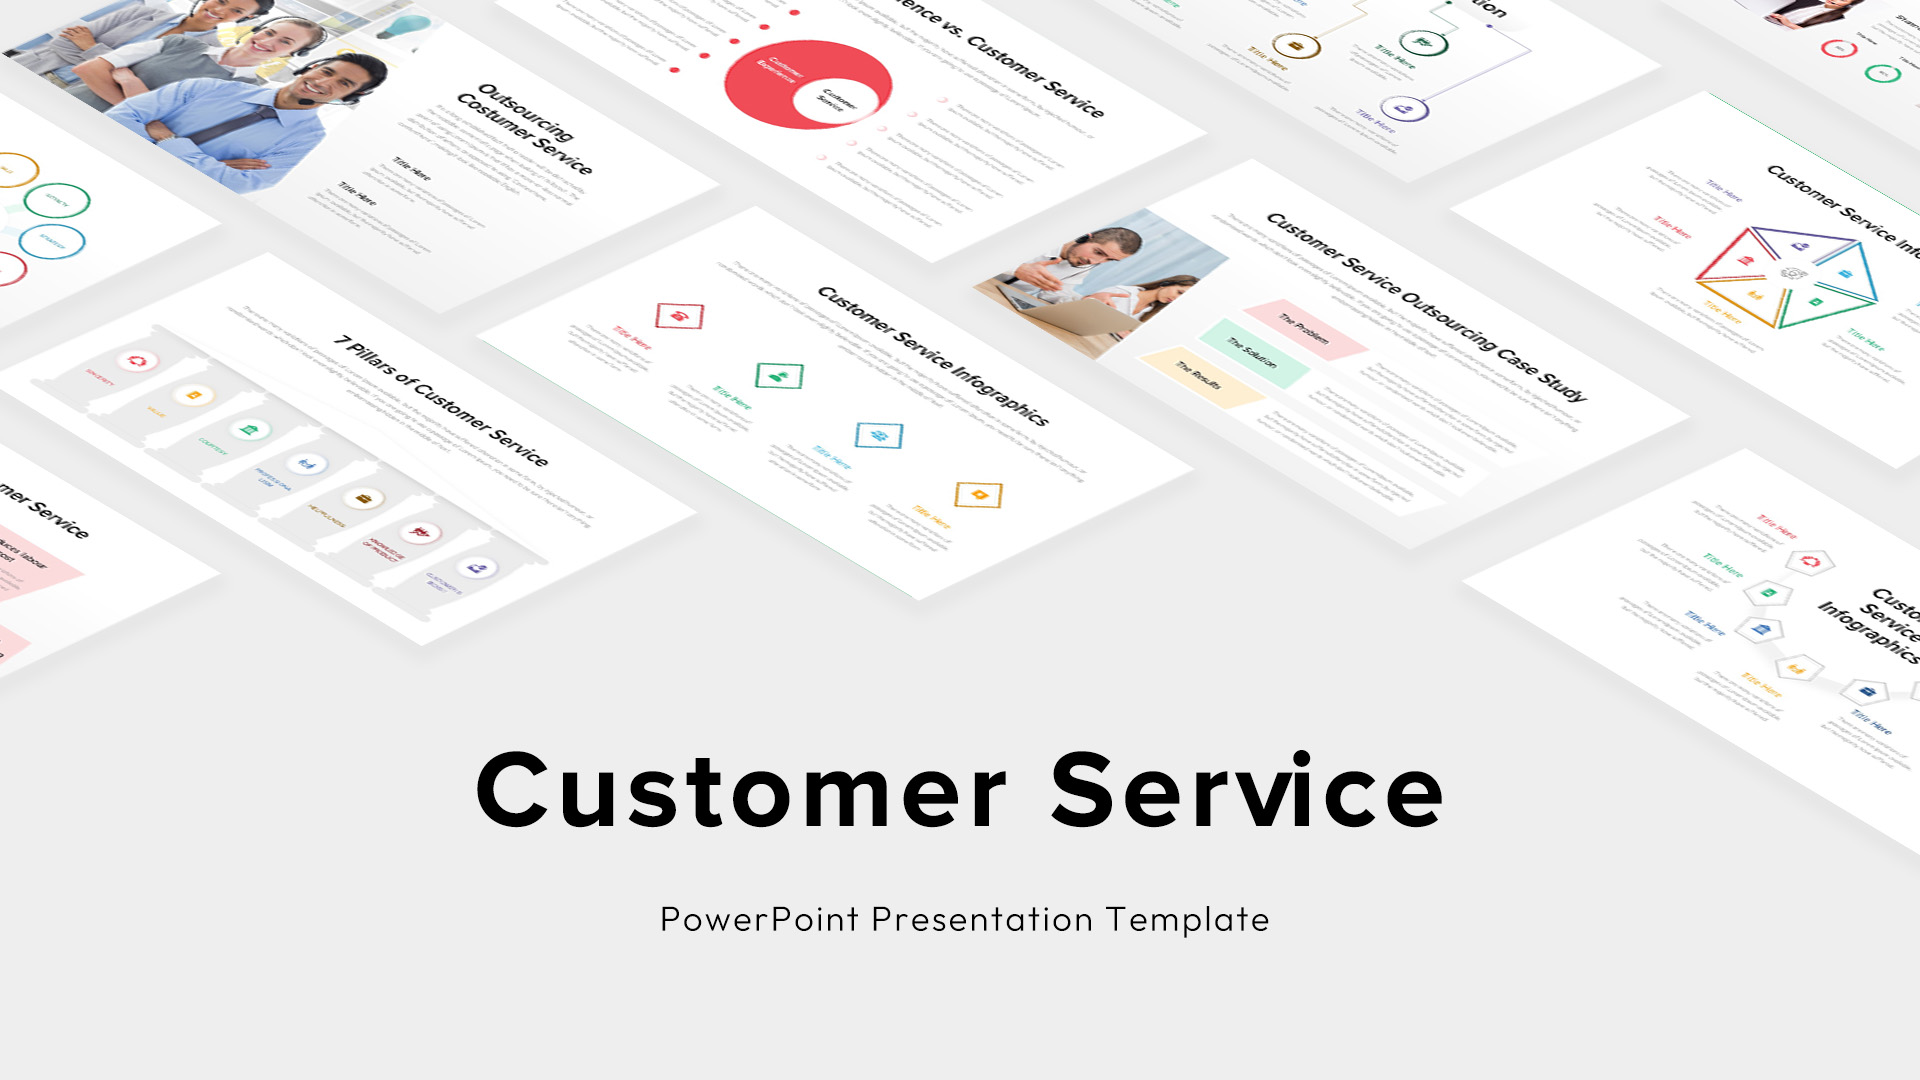
Custom Customer Service Infographics Template for PowerPoint & Google Slides
Process
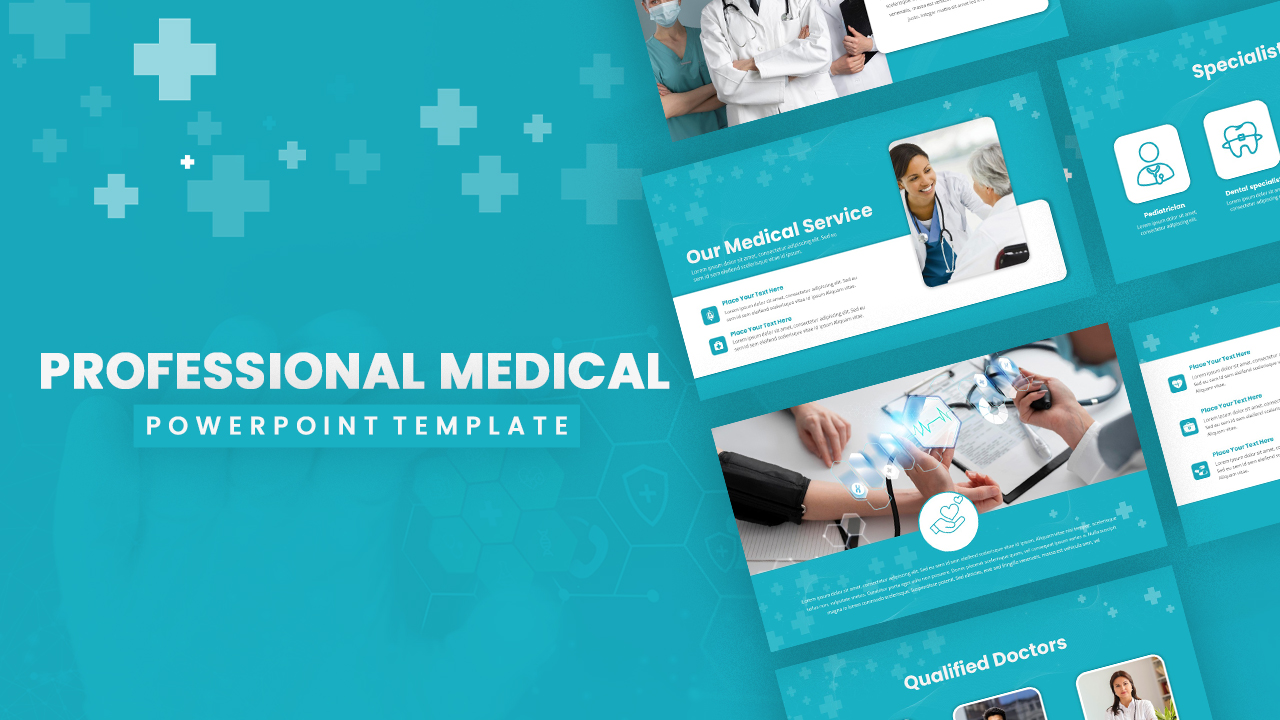
Modern Professional Medical Service Template for PowerPoint & Google Slides
Health
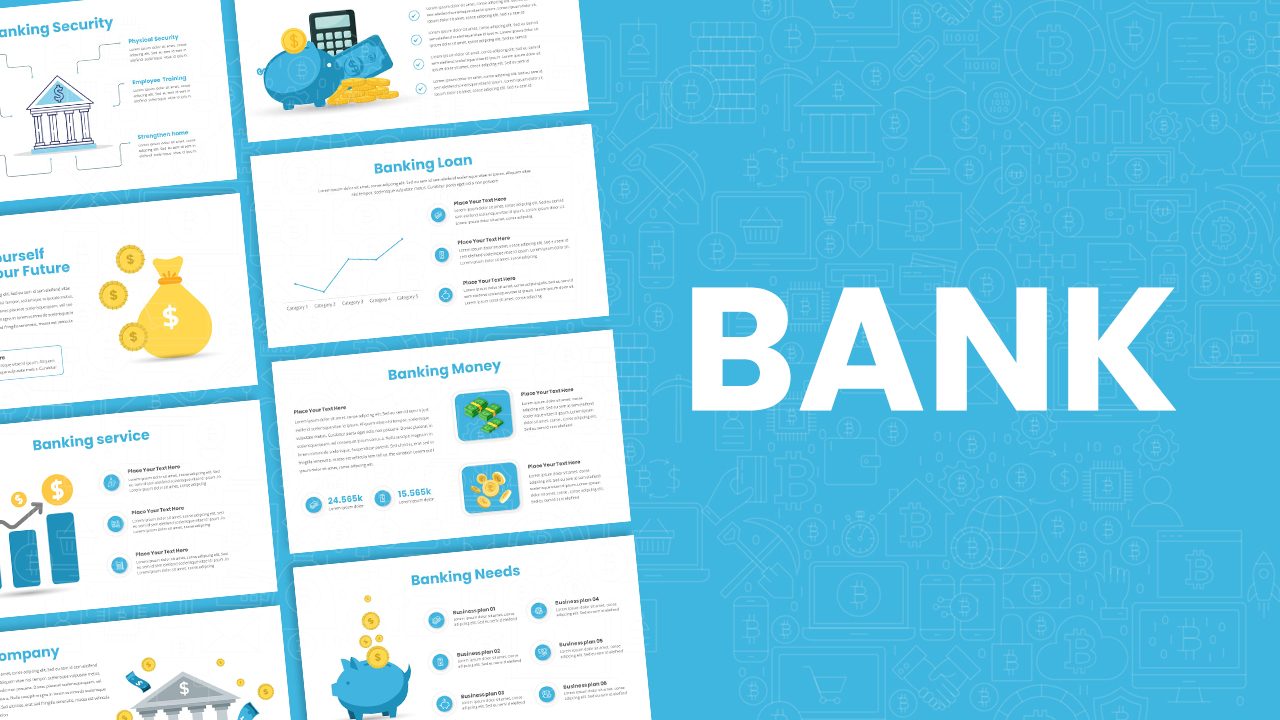
Banking Service & Finance Infographics Template for PowerPoint & Google Slides
Finance
Free
Free Nature-Inspired Hotel Service Showcase Template for PowerPoint & Google Slides
Company Profile
Free
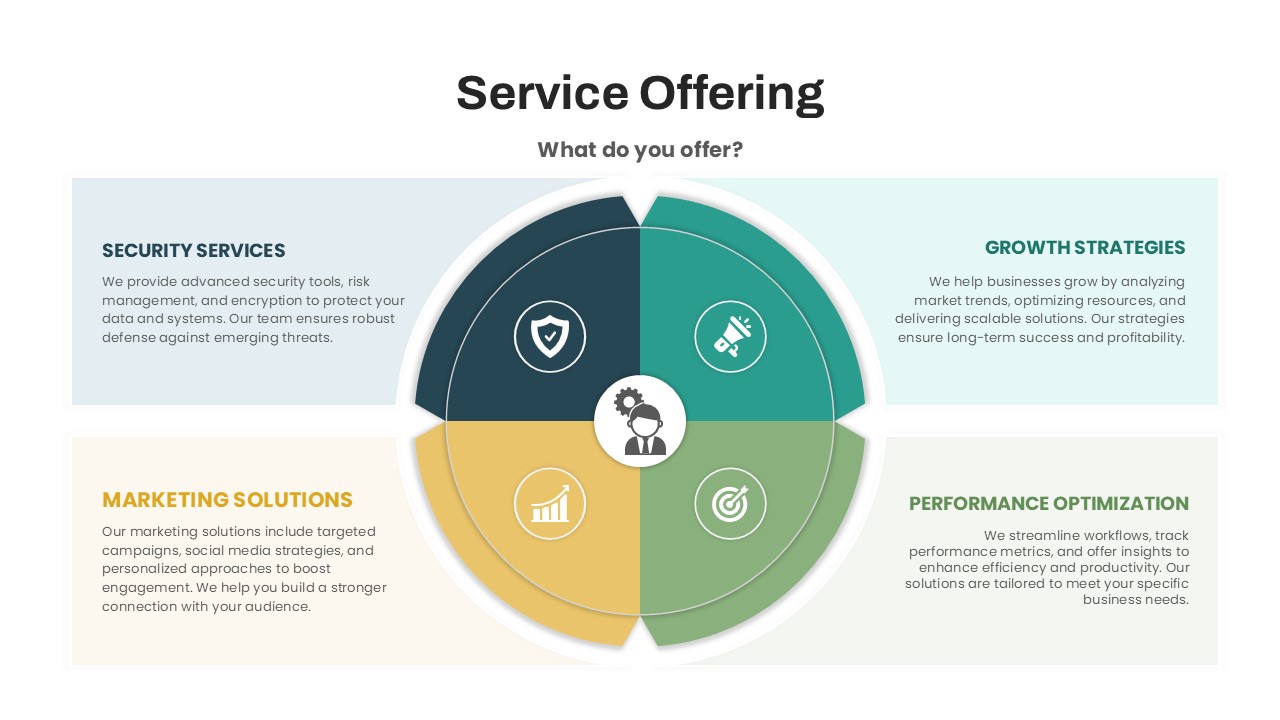
Circular Service Offering Diagram Template for PowerPoint & Google Slides
Circular
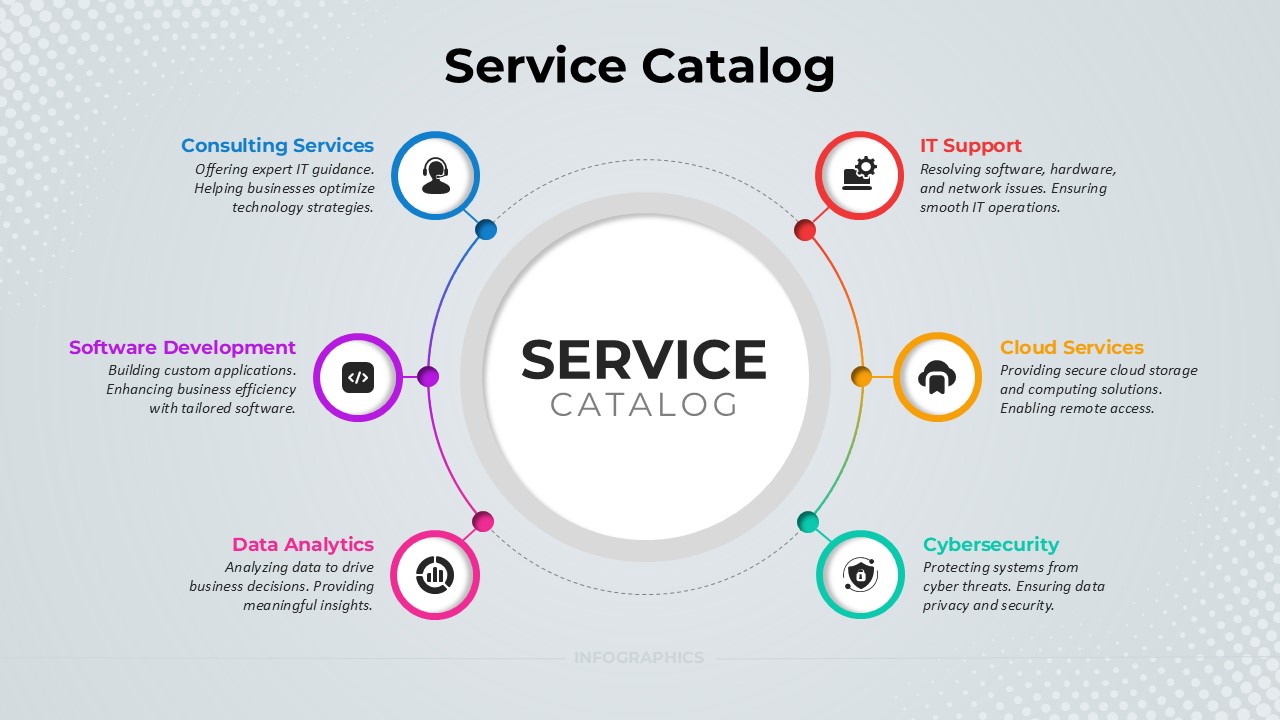
Service Catalog Circular Infographic Template for PowerPoint & Google Slides
Circular
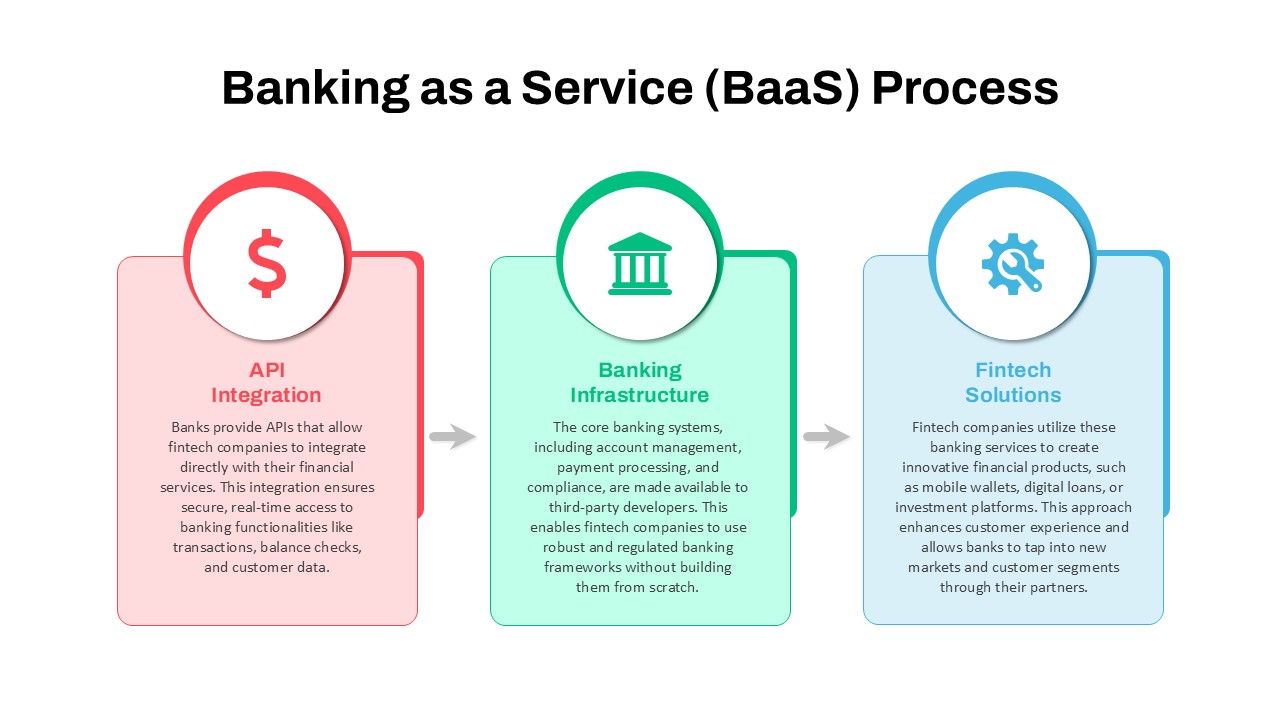
Banking as a Service (BaaS) Process Flow Template for PowerPoint & Google Slides
Process
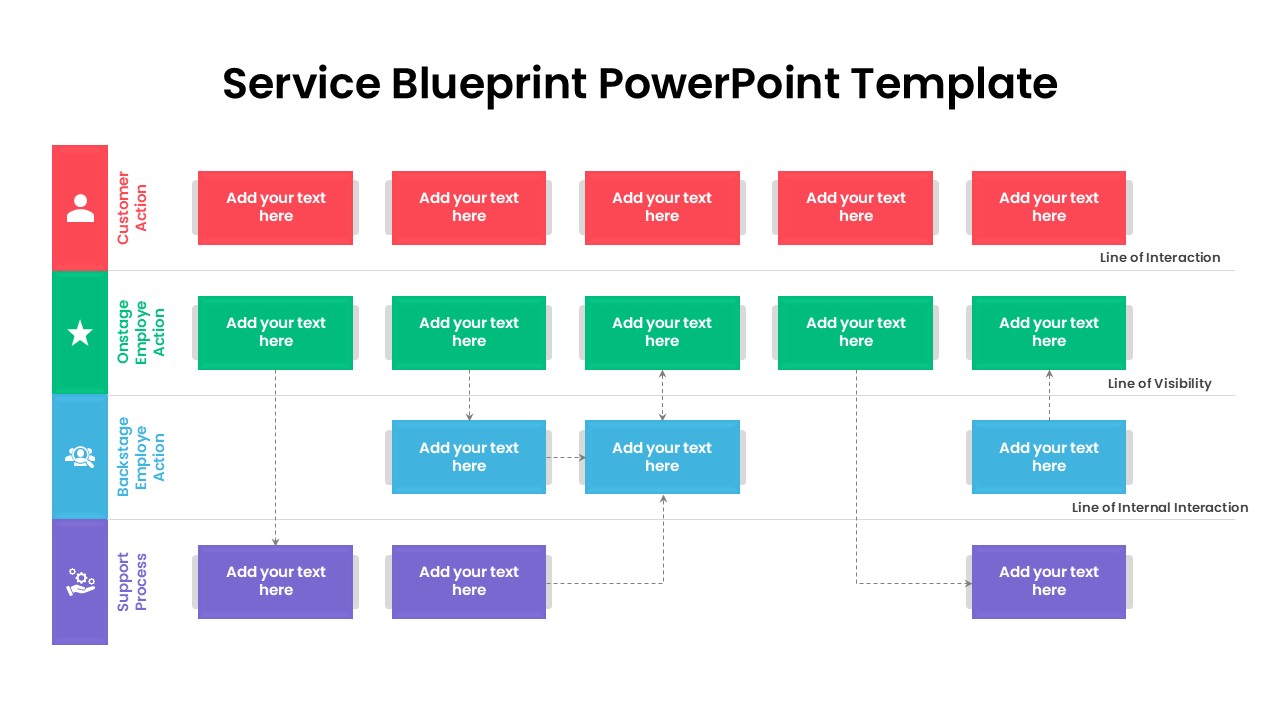
Service Blueprint Process Flow Template for PowerPoint & Google Slides
Process
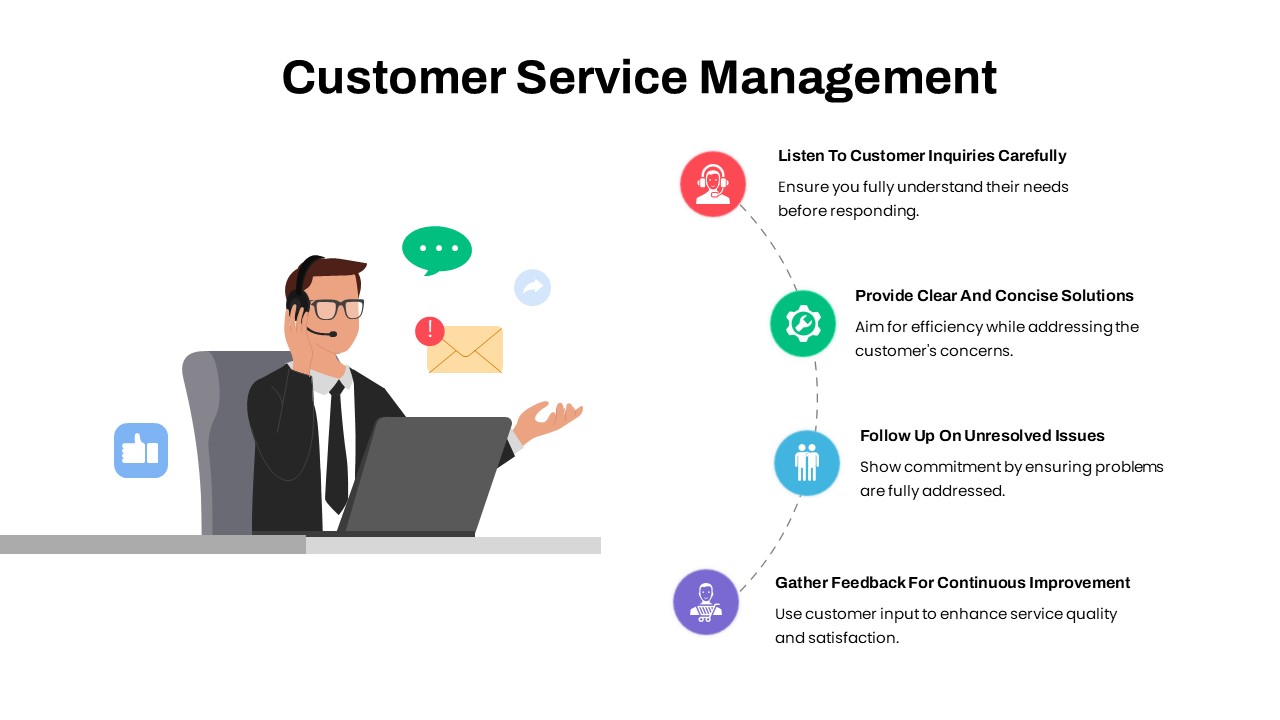
Customer Service Management Process Template for PowerPoint & Google Slides
Process
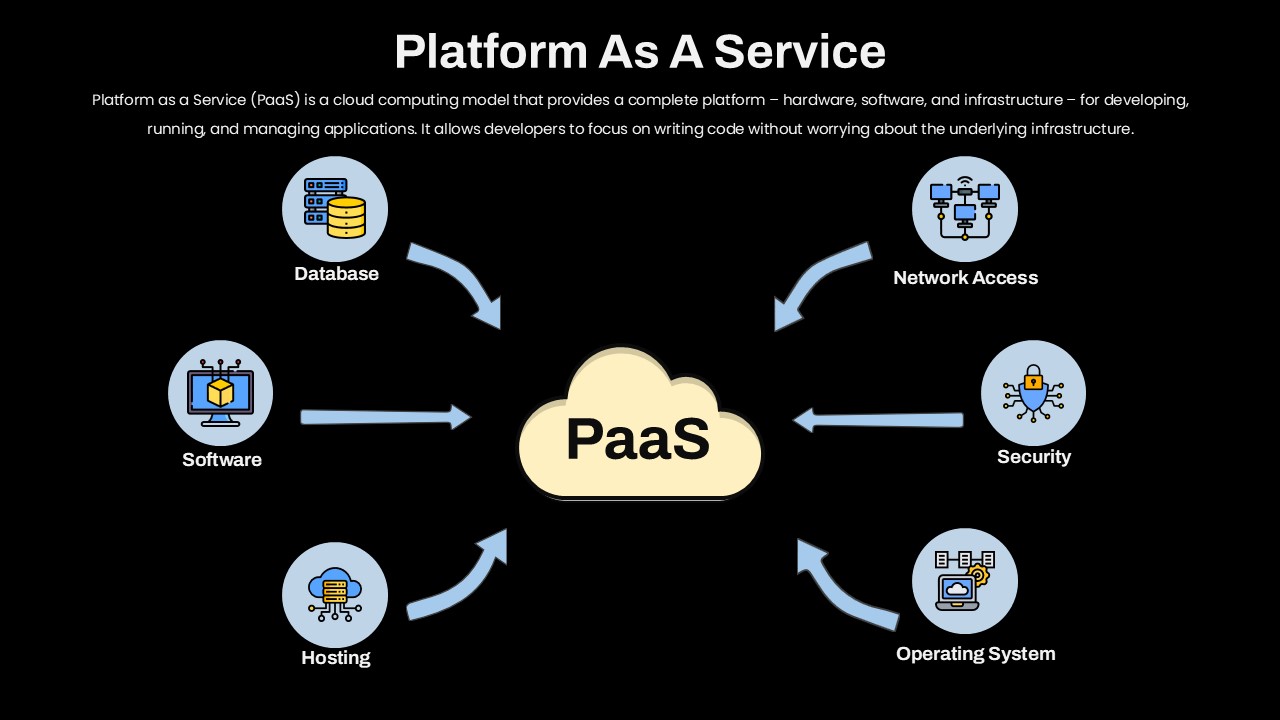
Platform as a Service Cloud Diagram Template for PowerPoint & Google Slides
Cloud Computing
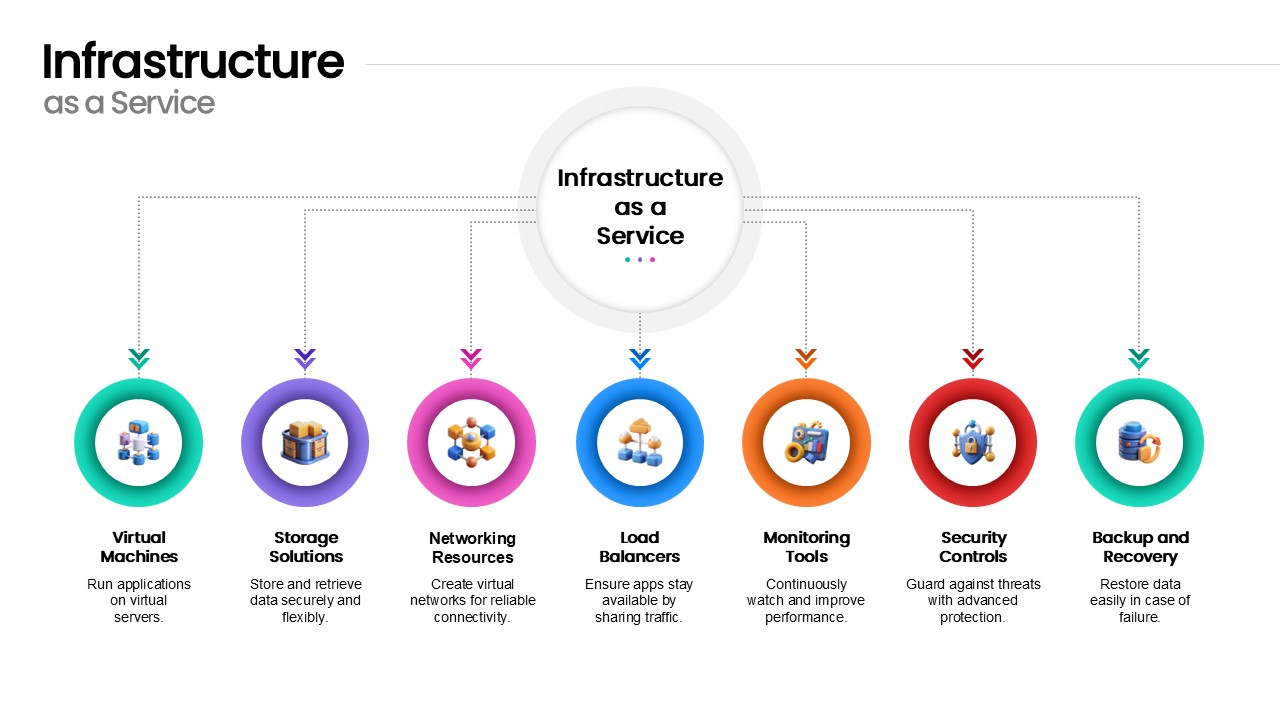
Infrastructure as a Service Diagram Template for PowerPoint & Google Slides
Cloud Computing
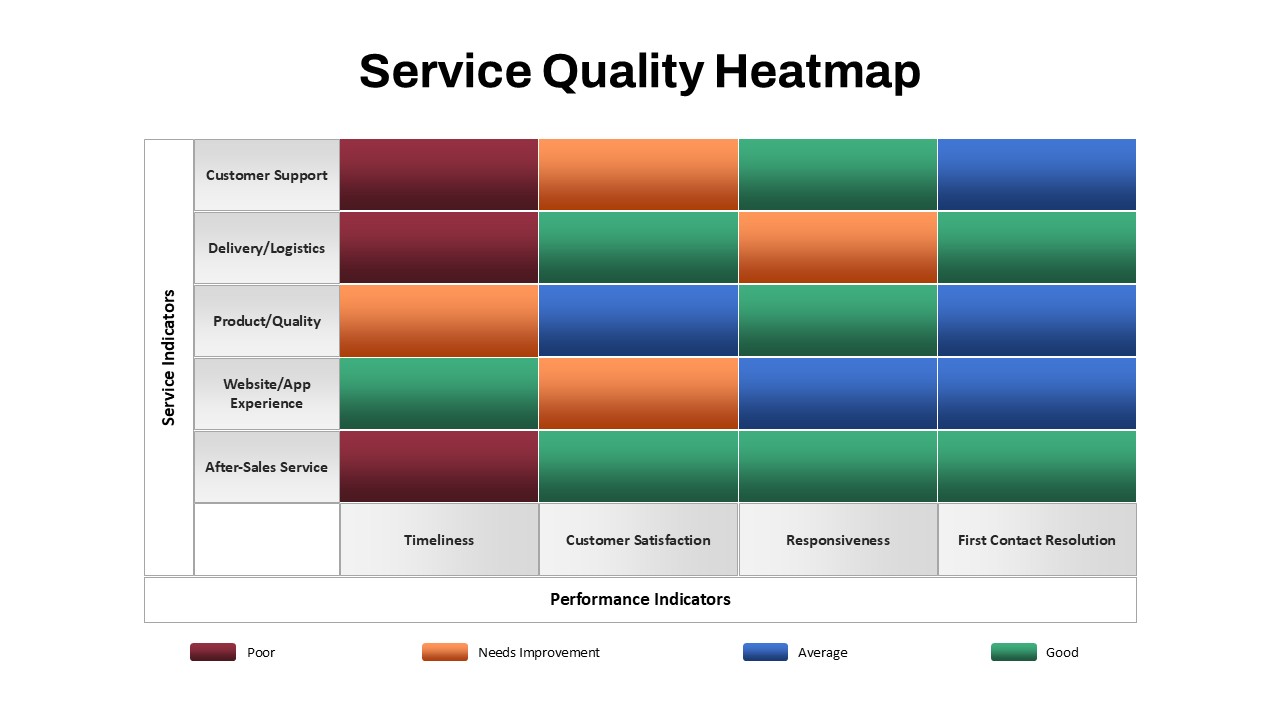
Service Quality Heatmap Template for PowerPoint & Google Slides
Business
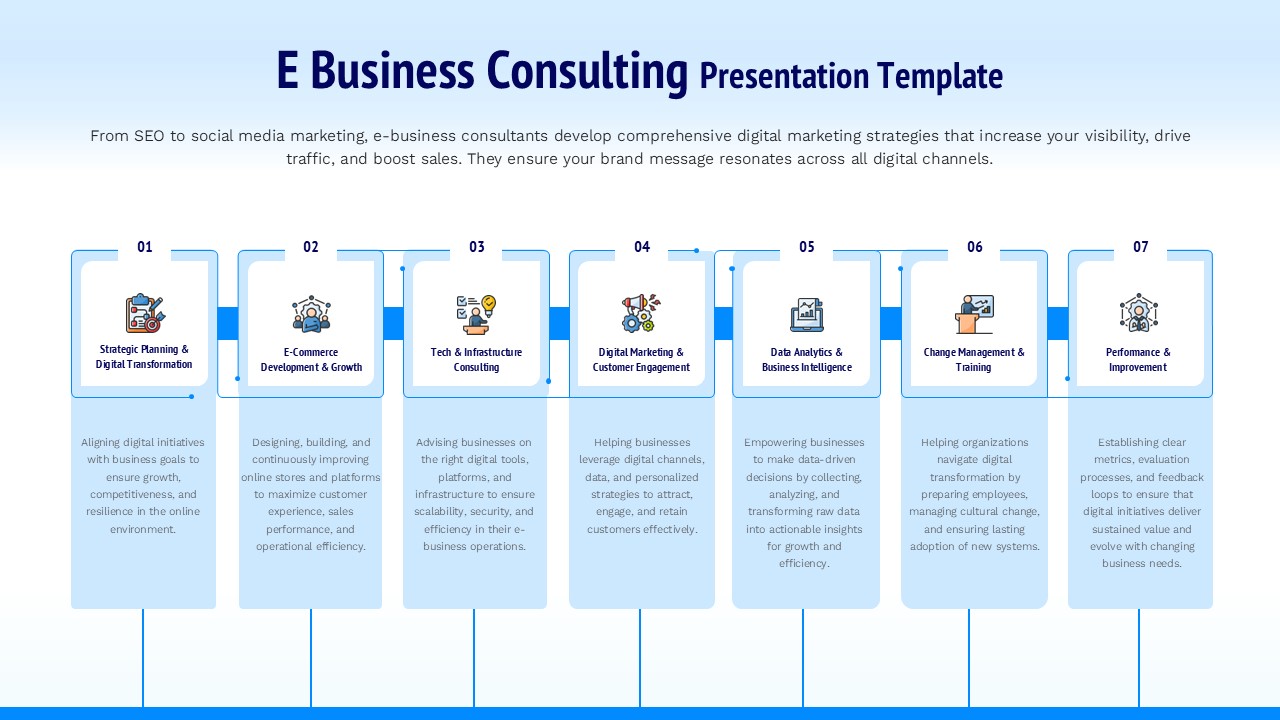
E Business Consulting Service Framework Template for PowerPoint & Google Slides
Business Strategy
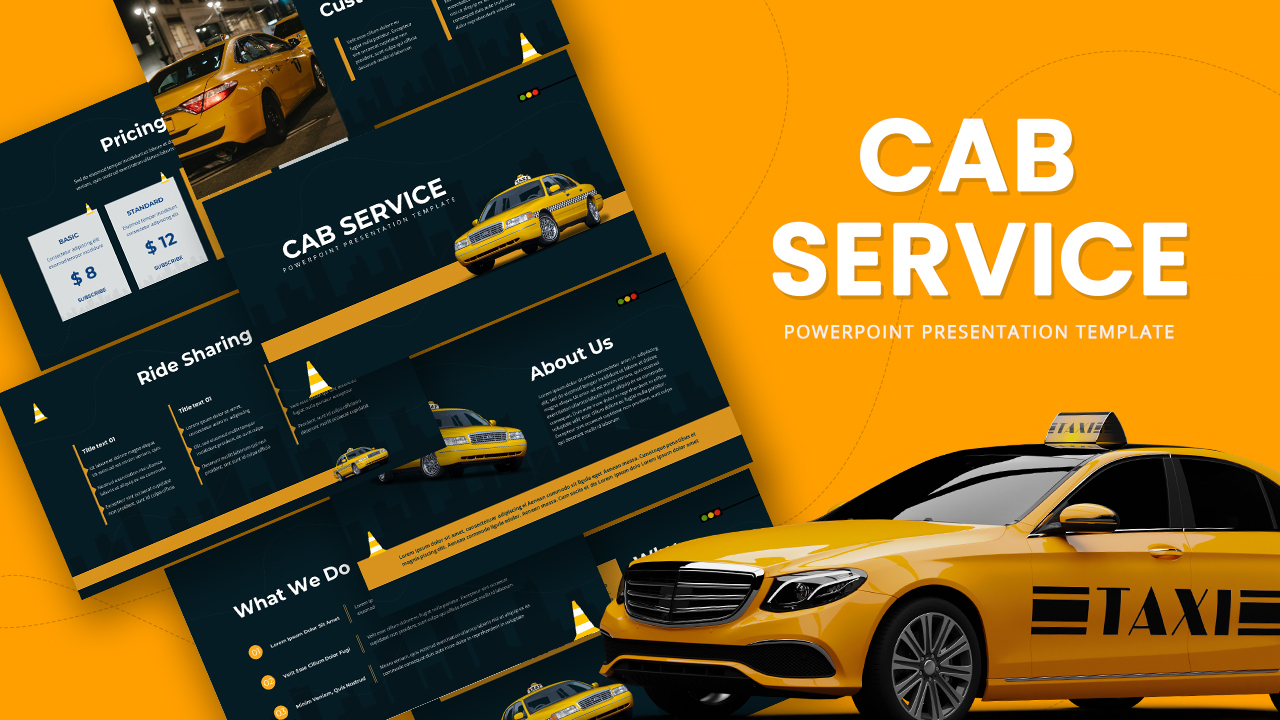
Cab Service Presentation Deck for PowerPoint & Google Slides
Decks
4 Step Process PowerPoint & Google Slides Template for PowerPoint & Google Slides
Process