


Sankey Diagram Presentation Template for PowerPoint
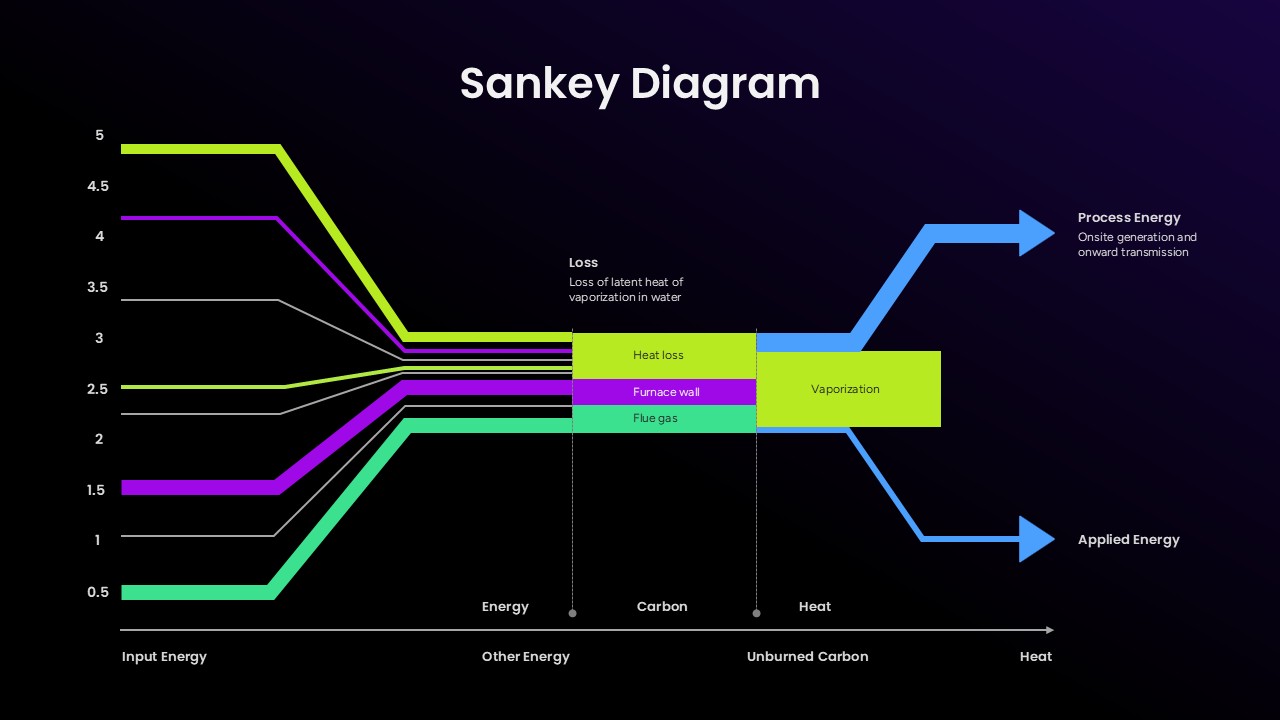
Present complex systems and flow relationships clearly with this Sankey Diagram template editable in PowerPoint and Google Slides. Designed to simplify data-heavy presentations, the template helps teams visualize how resources, budgets, materials, or processes move from one stage to another. Its proportional flow design makes it easier to identify inefficiencies, bottlenecks, and distribution patterns that may be difficult to explain through traditional charts.
This Sankey diagram template is useful for manufacturing reports, energy analysis, sustainability planning, supply chain mapping, financial reporting, and business process presentations. Project managers can use it to display resource allocation across departments or project phases, while analysts and consultants can explain workflow performance and operational improvements with greater clarity.
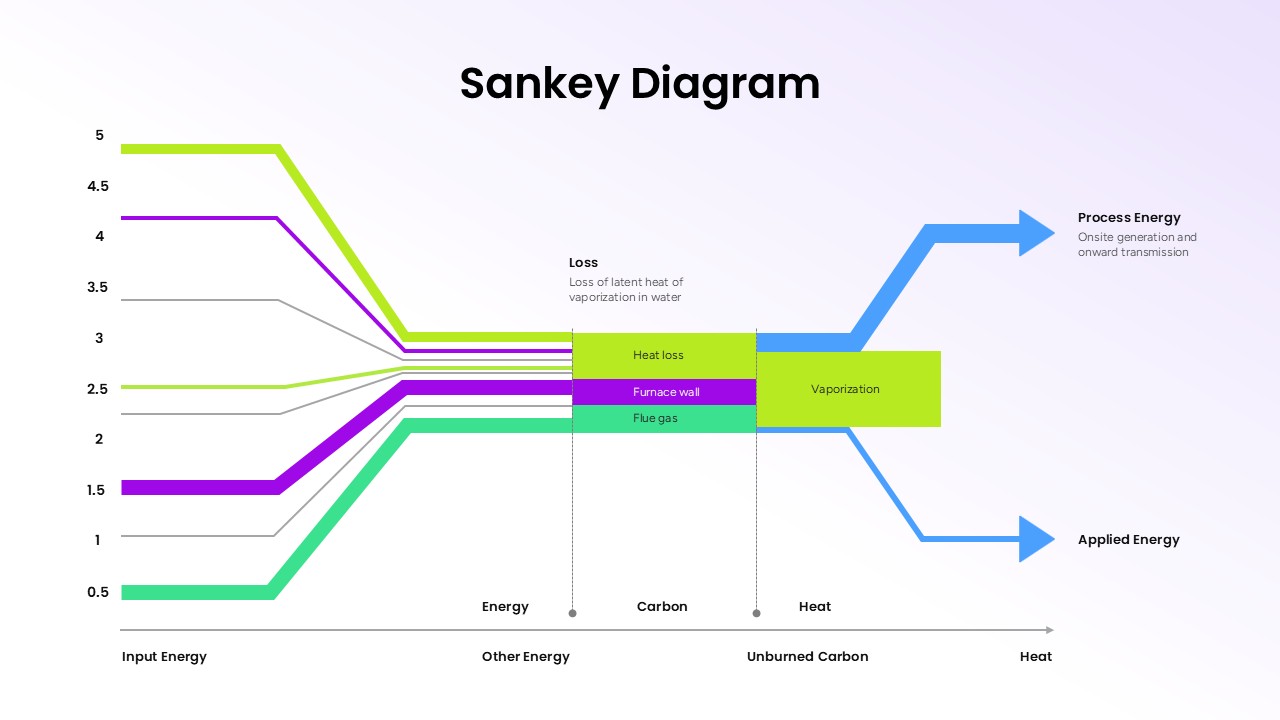
The template includes professionally designed dark and light theme layouts, allowing presenters to match different branding styles or presentation environments. Every element is fully editable in PowerPoint and Google Slides, making it simple to adjust colors, labels, flow sizes, and text according to project requirements.
Whether you are presenting customer journeys, energy transfers, production flows, budget distribution, or data movement within IT systems, this template helps turn complicated information into an organized visual story. Its clean structure supports executive meetings, academic research, operational reviews, and strategic planning discussions with a more engaging and understandable presentation format.
Frequently Asked Questions
What types of data work best with Sankey diagrams?
Can I customize the colors and labels in this template?
Login to download this file

Item ID
SB05891Designed By
Naseeba Sithara