Return on Ad Spend Formula for PowerPoint & Google Slides

Description
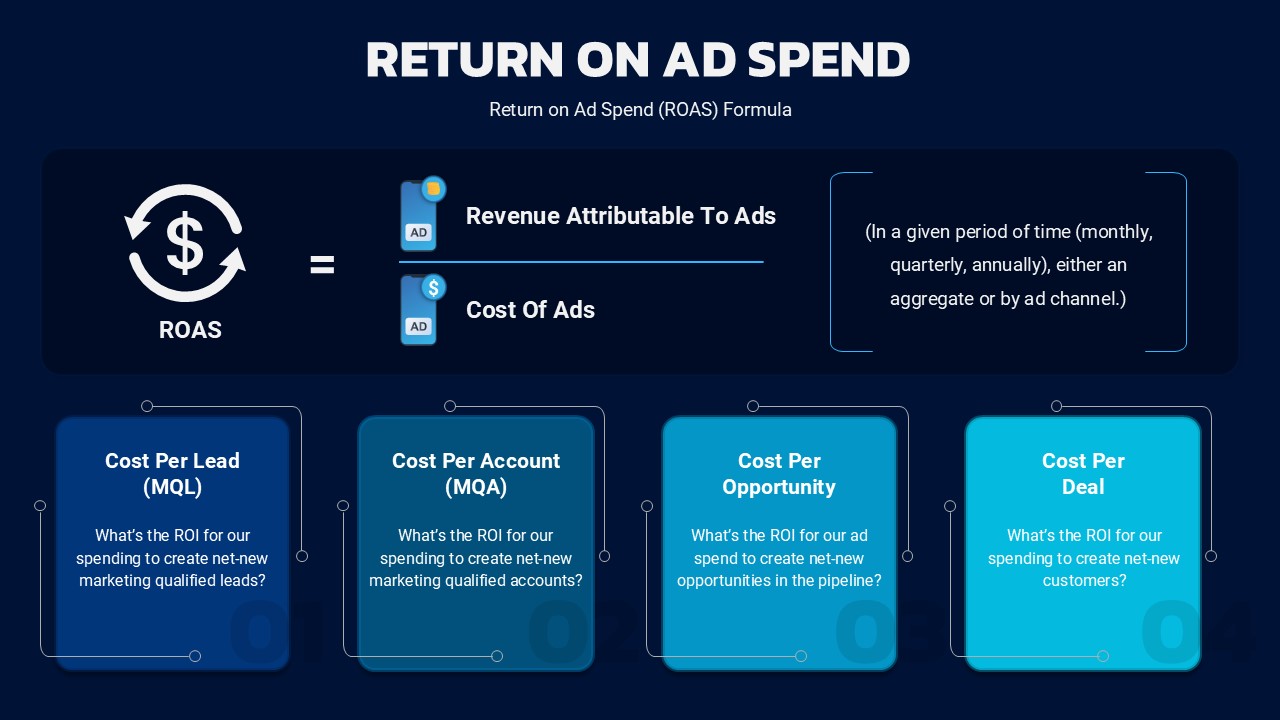
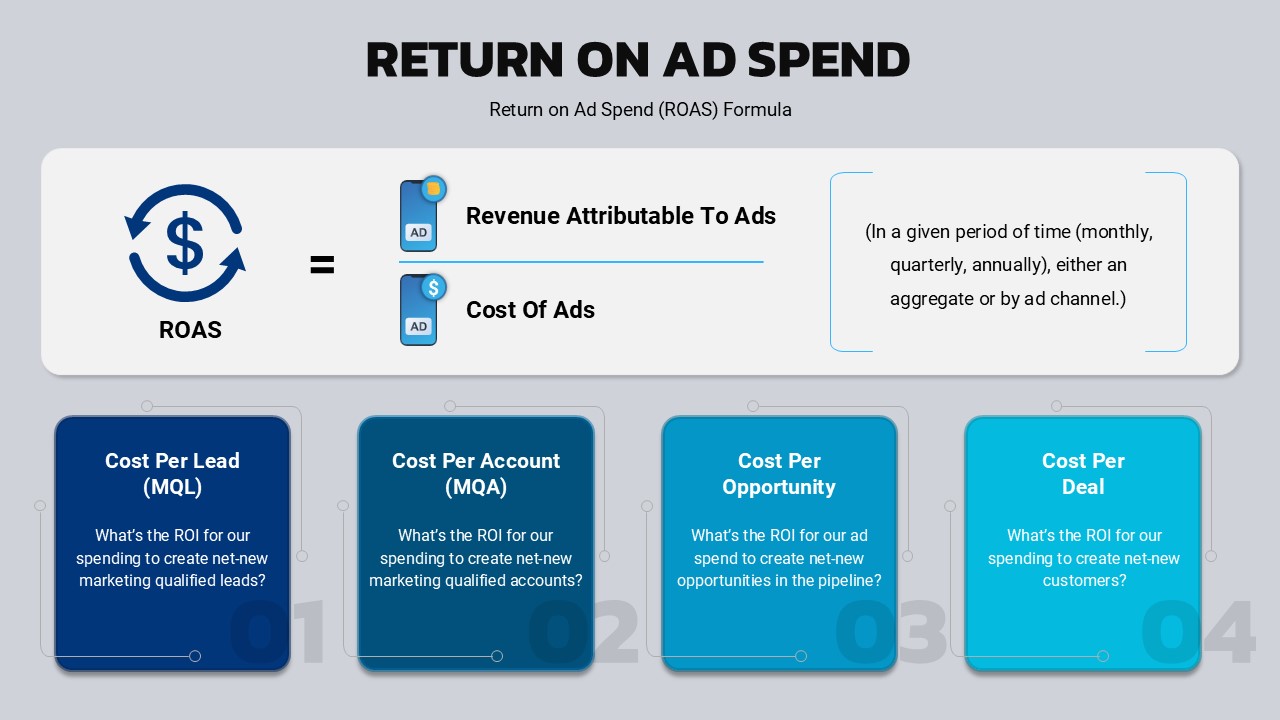
This detailed Return on Ad Spend (ROAS) slide offers a comprehensive breakdown of how to calculate and optimize ad spend performance. The slide clearly presents the formula, showing how revenue attributable to ads is divided by the cost of ads, helping to visualize the relationship between investment and returns in marketing efforts. The layout includes color-coded sections explaining key metrics like Cost Per Lead (MQL), Cost Per Account (MQA), Cost Per Opportunity, and Cost Per Deal. Each section features a question, encouraging the audience to reflect on specific ROI aspects such as net-new leads, opportunities, and customer acquisitions.
The modern, clean design uses a gradient background, with icons and numbers to enhance clarity and visual appeal. This slide is perfect for marketing teams, advertisers, and business leaders seeking to evaluate the effectiveness of their digital campaigns and improve marketing strategies based on data-driven insights. The elements are fully customizable, allowing users to adapt the slide to their specific needs and brand aesthetic.
Whether you are preparing a pitch deck, a quarterly marketing report, or a strategic discussion, this slide provides a professional framework for analyzing ad spend performance. It can be used across both PowerPoint and Google Slides, ensuring compatibility and seamless presentation experiences.
Who is it for
This slide is ideal for digital marketers, marketing managers, business analysts, and advertising professionals who need to track and communicate the performance of their ad spend across various channels. It’s also useful for startup founders, business consultants, and project managers focused on optimizing marketing ROI.
Other Uses
Beyond marketing, this slide layout can be adapted for financial presentations, budget breakdowns, sales performance analysis, and cost-benefit evaluations. It’s versatile enough for use in any situation requiring clear data visualization of spending versus returns. The structure can be modified for other types of ROI assessments in different industries.
Login to download this file

Item ID
SB05407
Related Templates

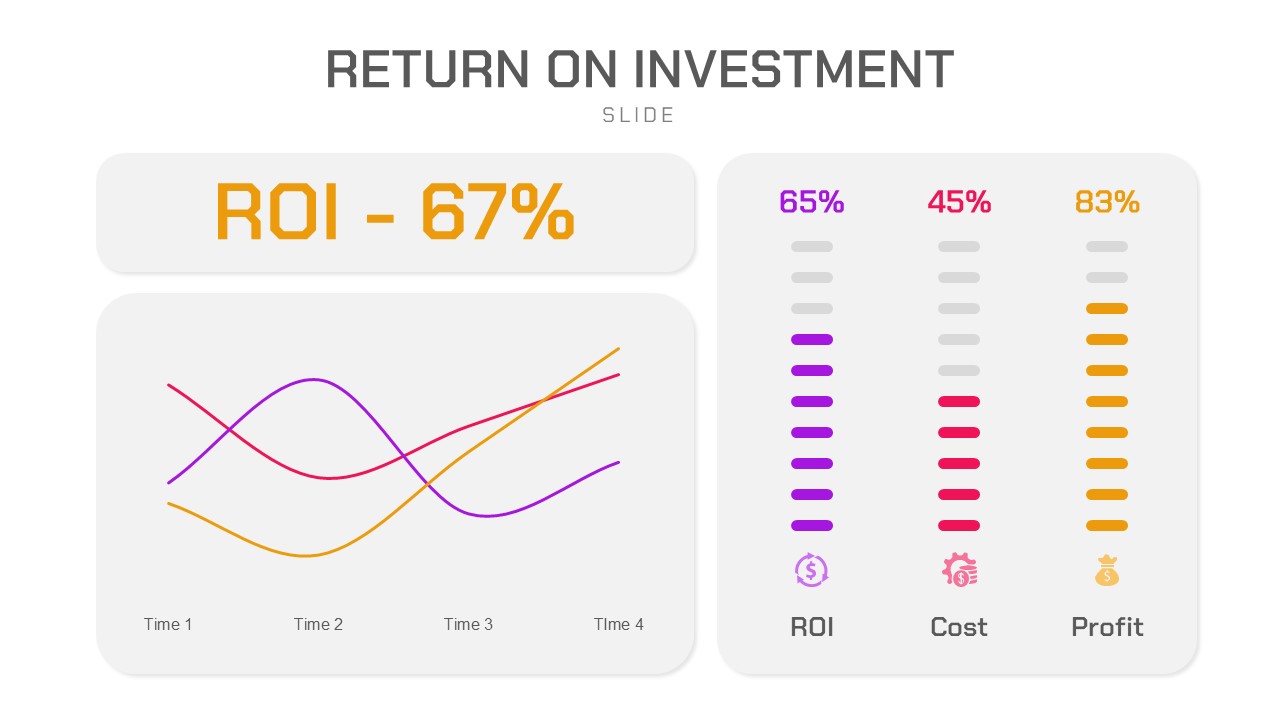
Return on Investment (ROI) Analysis template for PowerPoint & Google Slides
Business Report
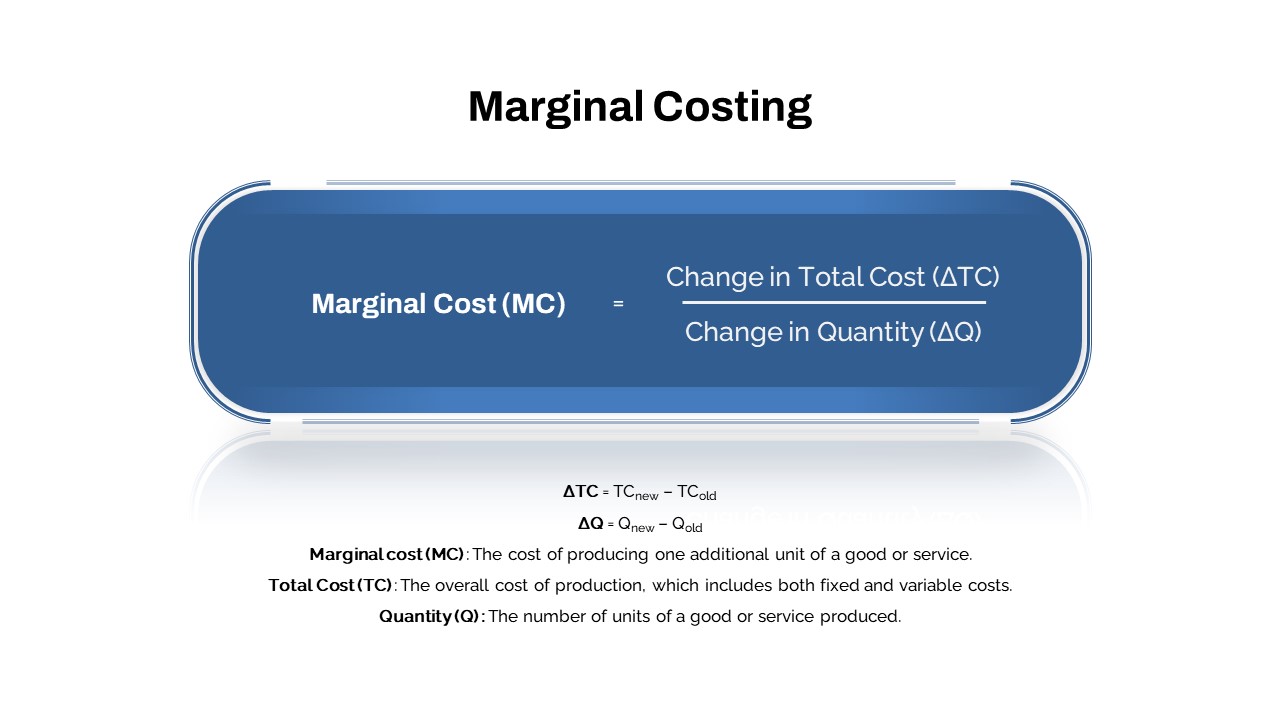
Comprehensive Marginal Costing Formula Template for PowerPoint & Google Slides
Process
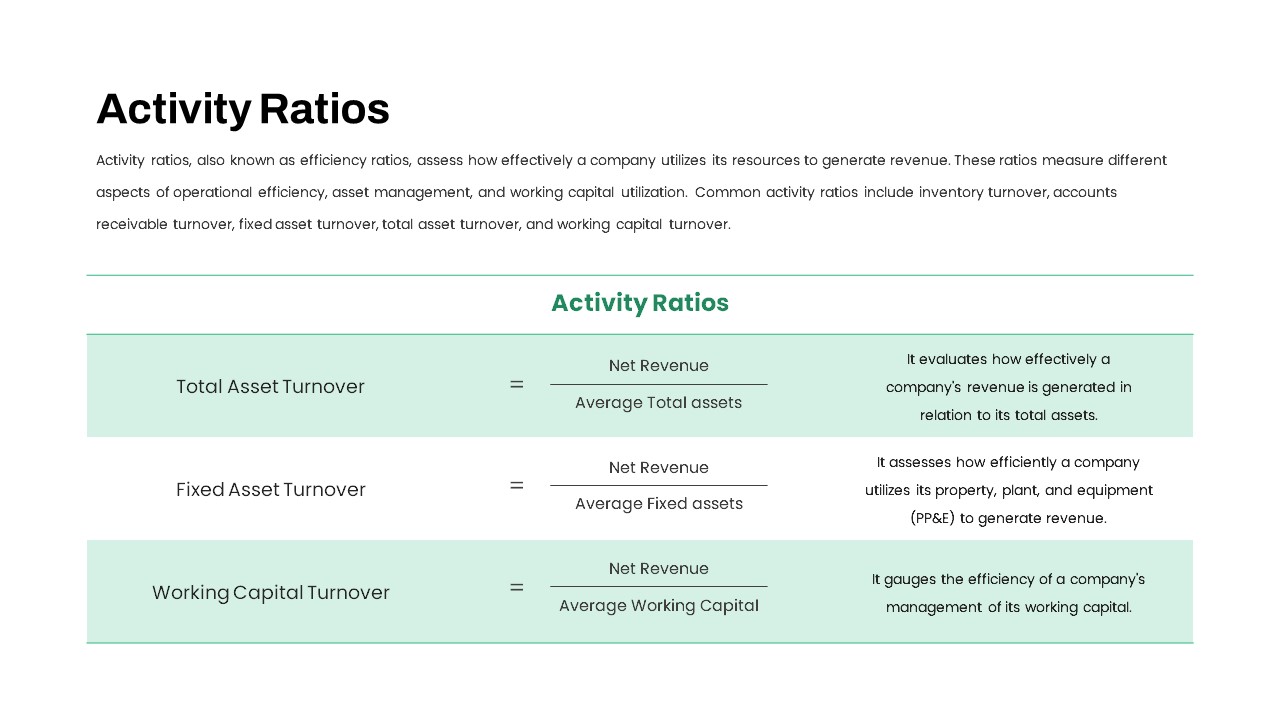
Activity Ratios Formula Table Slide Template for PowerPoint & Google Slides
Comparison Chart
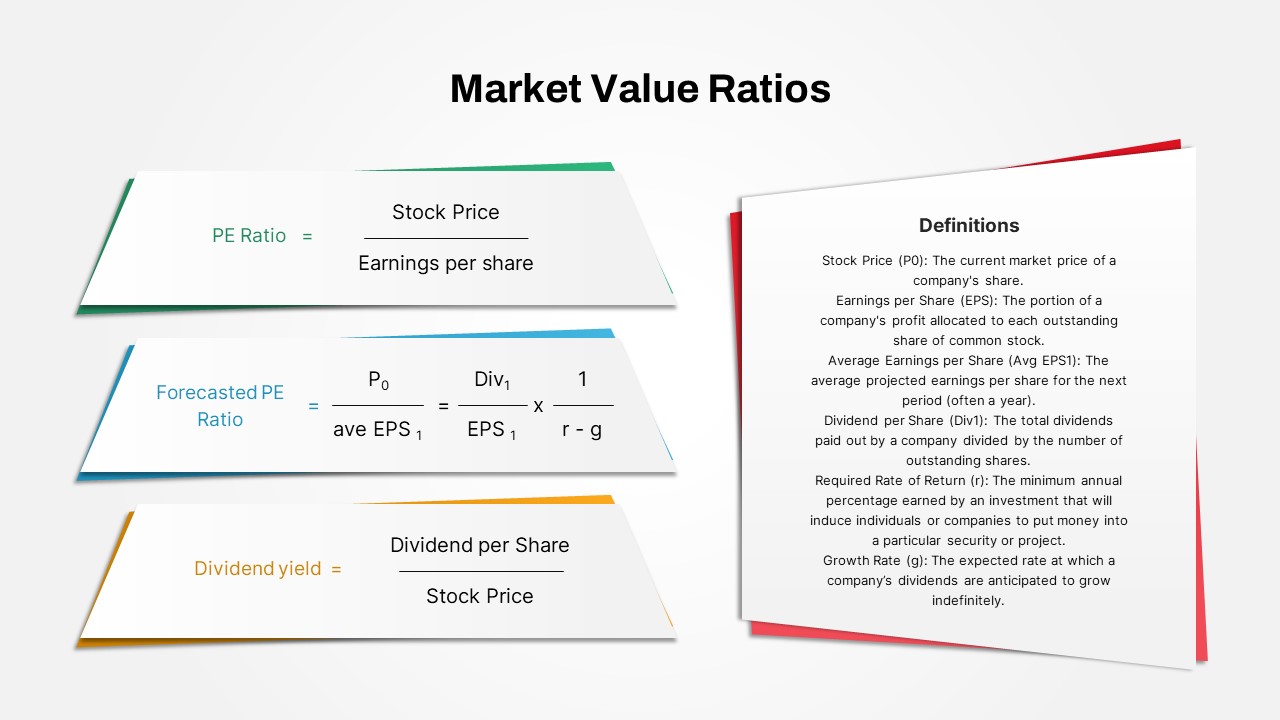
Market Value Ratios Formula Overview Template for PowerPoint & Google Slides
Business Report
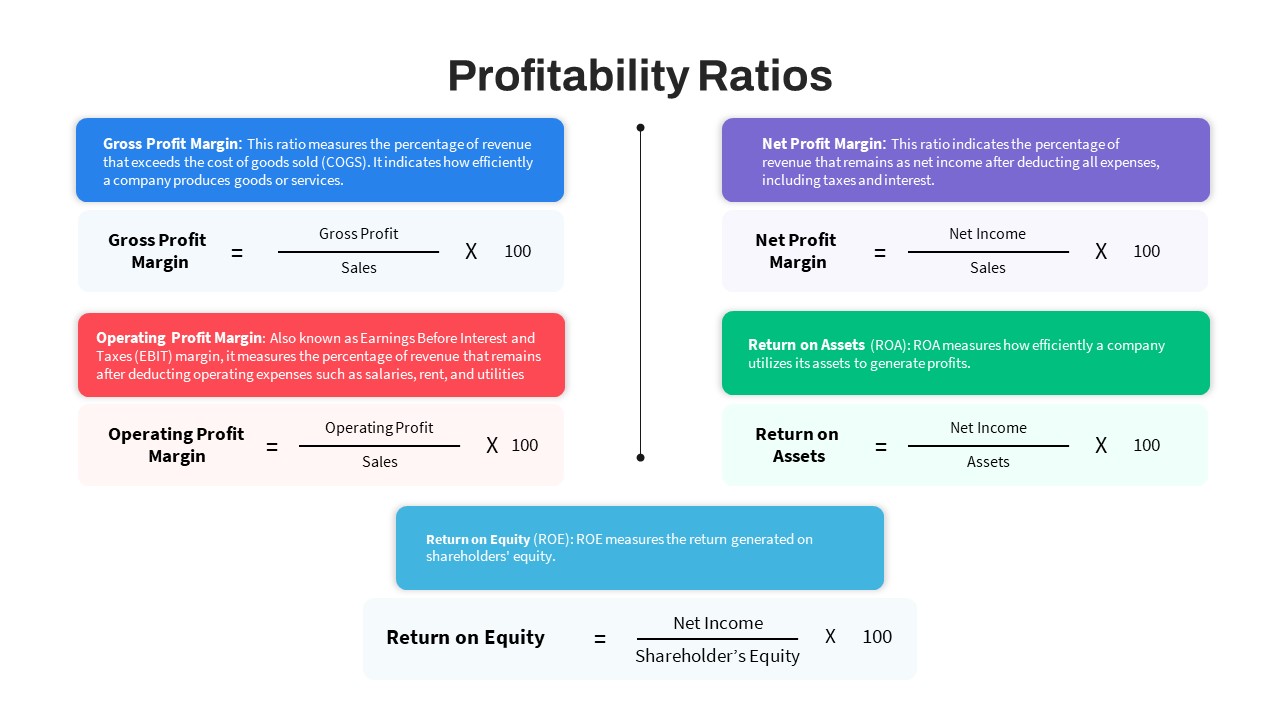
Profitability Ratios Formula Overview Template for PowerPoint & Google Slides
Revenue