Heat Map Infographics Template Dark


Description
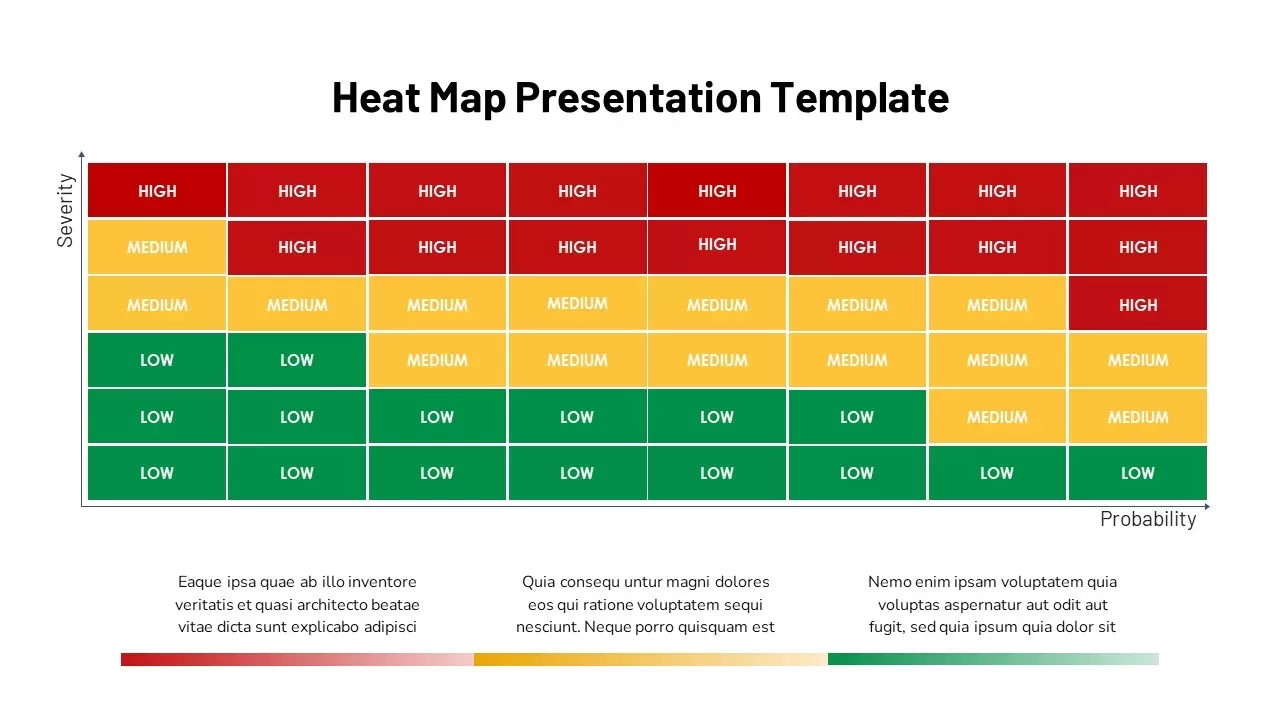
This slide delivers a comprehensive risk heat map to visualize the relationship between severity and probability for robust risk assessment. A crisp white background and bold black header “Heat Map Presentation Template” set the stage, while a grid of color-coded cells spans five severity levels against eight probability tiers. High-risk zones appear in vivid red, medium-risk in yellow, and low-risk in green, allowing audiences to instantly identify critical threat areas.
Beneath the chart, three evenly spaced text blocks feature placeholder copy above a seamless gradient scale bar that transitions from red through yellow to green. Each block supports concise commentary—use them to call out key insights, actionable recommendations, or threshold definitions. Subtle drop shadows and clean axis labels (“Severity” on the vertical axis, “Probability” on the horizontal) enhance readability without clutter.
Built on editable master slides, this template offers drag-and-drop replacement of chart graphics and text placeholders, global color swapping, and font adjustments with one click. Alignment guides and margin indicators ensure perfect placement on widescreen formats in both PowerPoint and Google Slides. Vector-based elements—including the gradient bar, cell outlines, and axis arrows—can be recolored to match corporate brand palettes, while chart data tables are ready for direct import of risk metrics or KPI values.
Ideal for boardroom briefings, safety audits, or strategic planning workshops, this slide streamlines communication of complex risk data. Whether you’re presenting to executive stakeholders, compliance teams, or project managers, the high-contrast color scheme and minimalist layout focus attention on the most critical issues. Duplicate this layout across multiple slides to break down segmented risk profiles, regional analyses, or time-series comparisons, delivering a professional, data-driven narrative with clarity and impact.
Who is it for
Risk managers, compliance officers, project leaders, safety engineers, and finance executives will benefit from this heat map slide when conducting risk assessments, audit reviews, or strategic decision-making sessions.
Other Uses
Repurpose this design for hazard analyses, audit findings, incident tracking dashboards, or portfolio risk comparisons. Adapt the grid to illustrate performance KPIs, market opportunity matrices, or decision-support frameworks across any business presentation.
Login to download this file


