Revenue by Region PowerPoint Template

Description
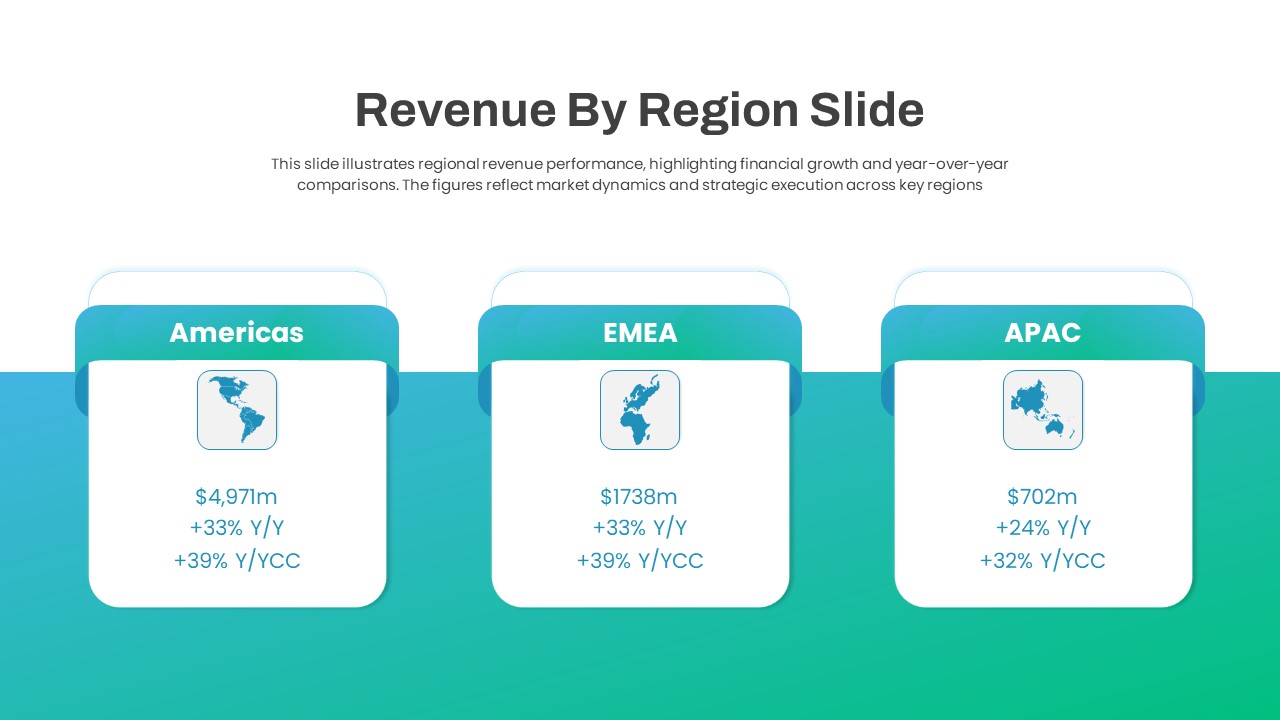
Use this infographic slide to illustrate revenue performance across three major regions—Americas, EMEA, and APAC—with precision and clarity. The design features three side-by-side cards set on a horizontal gradient band, each topped with a bold, pill-shaped header bearing the region name. Inside every card, a map icon sits above editable text placeholders for total revenue (in millions), year-over-year growth percentage, and year-over-year currency-comparable growth. Soft rounded corners, subtle drop shadows, and a modern blue-to-green gradient background ensure high visual appeal while maintaining a clean, professional look. The symmetrical arrangement guides the audience’s eye from left to right, facilitating quick comparisons and making key metrics instantly digestible.
Fully customizable, this template supports master slides, vector icons, and grouped shapes—so you can swap icons, adjust color stops, or update figures in seconds without disrupting alignment. Built-in Smart Guides and ruler lines help maintain pixel-perfect placement, while compatibility with both PowerPoint and Google Slides guarantees consistent rendering across devices and platforms.
Optimized for fast editing, the slide lets you adapt corporate color palettes, relabel region names, or duplicate cards to accommodate additional markets. Whether you’re presenting quarterly results, conducting investor roadshows, or preparing executive dashboards, this template accelerates slide creation and drives stakeholder alignment.
Who is it for
Financial analysts, investor relations teams, and regional sales managers will benefit from using this slide to communicate market dynamics and growth trends. C-suite executives, board members, and strategy consultants can leverage it in earnings calls, board presentations, and strategic reviews.
Other Uses
Beyond revenue comparisons, repurpose the layout for KPI dashboards, market share overviews, product launch rollouts, or geographic footprint analyses. Simply relabel headers and adjust icons to craft slides for cost breakdowns, customer segmentation, or competitive benchmarking.
Login to download this file


