


Project Gantt Chart Presentation Slide for PowerPoint & Google Slides

Description
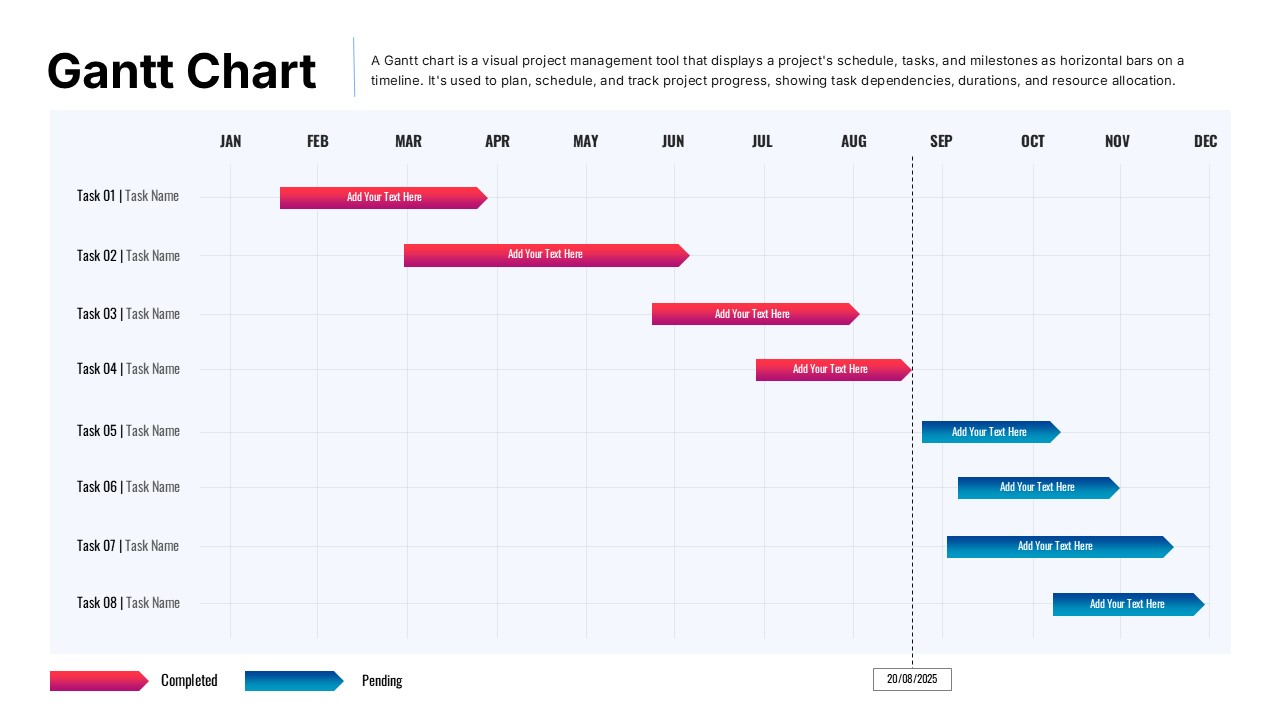
This fully editable Gantt chart slide lets you plan, schedule, and track project tasks with precision. A horizontal timeline spans January to December, overlaid with gradient bars: red for completed tasks and blue for pending ones. Each task row is clearly labeled (Task 01–Task 08) and bars feature arrowheads to indicate direction. A dashed vertical line marks the current date (20/08/2025), while a concise legend clarifies status colors. The slide’s light grid background and bold “Gantt Chart” heading ensure clarity and professional polish.
Built for PowerPoint and Google Slides, the template includes master slides for consistent styling, editable color themes, and drag-and-drop bar adjustments. Swap task names, shift start/end dates, and tweak gradients or fonts in seconds. Subtle alignment guides and a clean white canvas maintain focus on project progress, making this asset ideal for status updates and timeline reviews.
Who is it for
Project managers, product owners, and team leads will find this Gantt chart indispensable for visualizing schedules, communicating deadlines, and monitoring task dependencies. Consultants and operations teams can use it in stakeholder presentations to showcase milestones and resource allocation.
Other Uses
Beyond project schedules, repurpose this slide for event planning timelines, marketing campaign roadmaps, editorial calendars, or training session schedules. Adjust labels and bar colors to map any time-based workflow or progress tracking scenario.
Login to download this file

Item ID
SB05458Designed By
Nithya