search

Essentials

Must-have decks for quick wins

By Industry

Professionally tailored slides for every sector

By Style

Minimal, modern and creative designs

By Topic

Explore slides curated by purpose and theme

TimelineTimelineRoadmapRoadmapStrategyStrategyGoalsGoalsTableTableComparisonComparisonSWOTSWOTAgendaAgendaArrowArrowWorld MapWorld MapMapsMapsProcessProcessFunnelFunnelTeamTeamOrg ChartOrg ChartPyramidPyramidCircularCircular

Business PlanBusiness PlanBusiness StrategyBusiness StrategyBusiness ProposalBusiness ProposalBusiness ModelsBusiness ModelsDigital MarketingDigital MarketingMarketing FunnelMarketing FunnelCustomer ExperienceCustomer ExperienceProject StatusProject StatusGantt ChartGantt ChartRecruitmentRecruitmentEmployee PerformanceEmployee PerformanceLeadershipLeadershipAIAIMachine LearningMachine Learning

AI Presentation Maker

Install the Windows plugin for quick access to templates and design tools.

AI Infographics Maker

Use our Office 365 add - in to access templates directly from the cloud.

Exe Version

Install the Windows plugin for quick access to templates and design tools.

Office 365

Use our Office 365 add - in to access templates directly from the cloud.

Mac Version

Get the Mac plugin to easily browse, insert, and customize templates and visuals within PowerPoint.

Pennsylvania State Map PowerPoint Template featured image
This template is part of a deck featuring multiple slides. To check out all slides, click on See All. See All round right arrow

Description

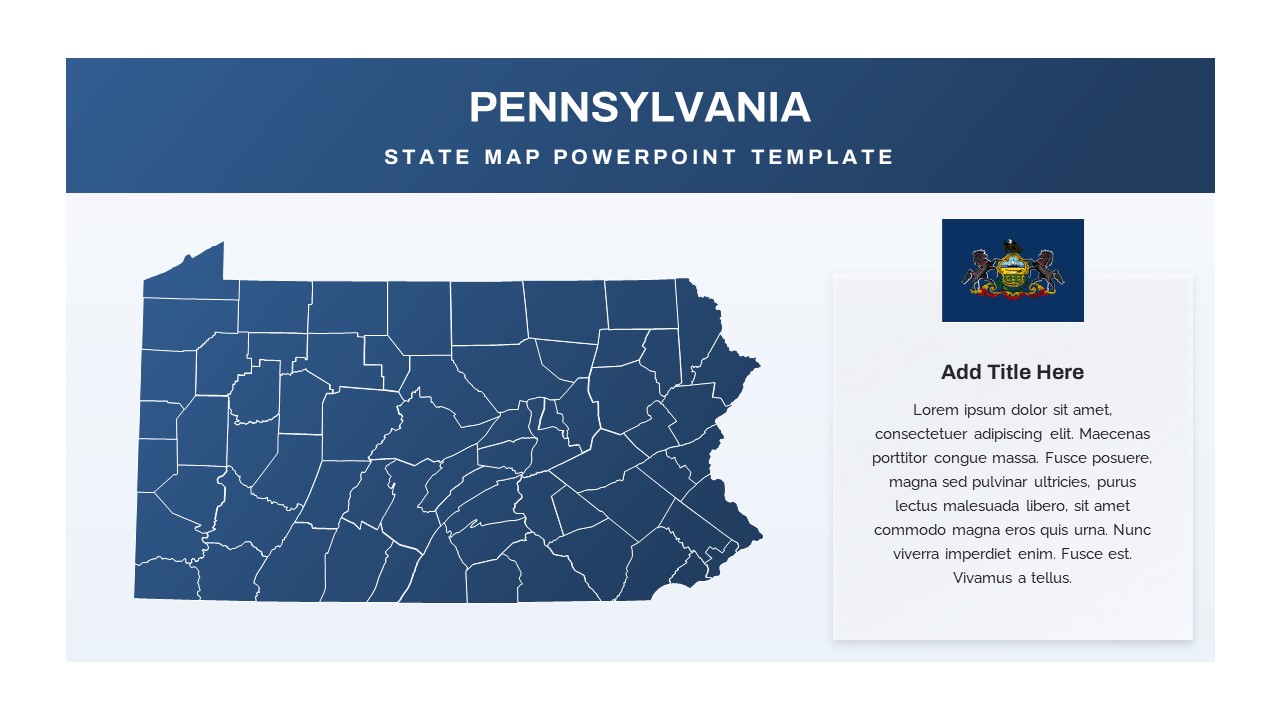
Bring geographic insights to life with this Pennsylvania state map slide, featuring precise county demarcations on a clean blue backdrop. The slide’s upper banner displays a modern gradient header and clear title placeholder, while the main canvas highlights a dark-blue vector map of Pennsylvania divided into counties by white borders. To the right, a dynamic content panel includes the state flag and editable text box for headings and descriptions. Designed with master slides, vector shapes, and intuitive placeholders, users can easily adjust fill colors for individual counties, swap the flag icon, and update labels in seconds. The flat design aesthetic ensures maximum clarity, while subtle drop shadows and gradient accents add depth without distraction. Compatible with both PowerPoint and Google Slides, this asset preserves high-resolution graphics and maintains formatting consistency across devices, eliminating export issues and version discrepancies.

Use this slide to visualize demographic data, election outcomes, regional sales performance, or resource distribution. Each county region can be individually highlighted with custom color fills or data-driven charts, making it simple to emphasize target areas. The integrated ruler and alignment guides ensure precise element placement, while editable text styles adapt to corporate branding guidelines. Ideal for executives presenting regional performance metrics, educators teaching U.S. geography, or government officials reporting on public policy, this state map offers both aesthetic appeal and functional versatility. The clean white panel on the side provides balanced negative space for narrative copy, making this template a cohesive asset for both digital and print presentations. All vector elements are optimized for low file sizes, ensuring smooth performance even in large corporate decks or online webinars.

Who is it for

Marketing analysts, sales managers, and regional planners can use this slide to present market territories or sales distributions. Government agencies, educators, and consultants will also benefit from the customizable map when reporting on demographic trends or policy initiatives.

Other Uses

Beyond state-level reporting, repurpose this design for visualizing project zones, service areas, or outbreak tracking. Turn the county map into a heat map for performance dashboards, training materials, or interactive quizzes in educational and corporate training settings.

Login to download this file

Add to favorites

Add to collection