Guyana Map PowerPoint Template


Description
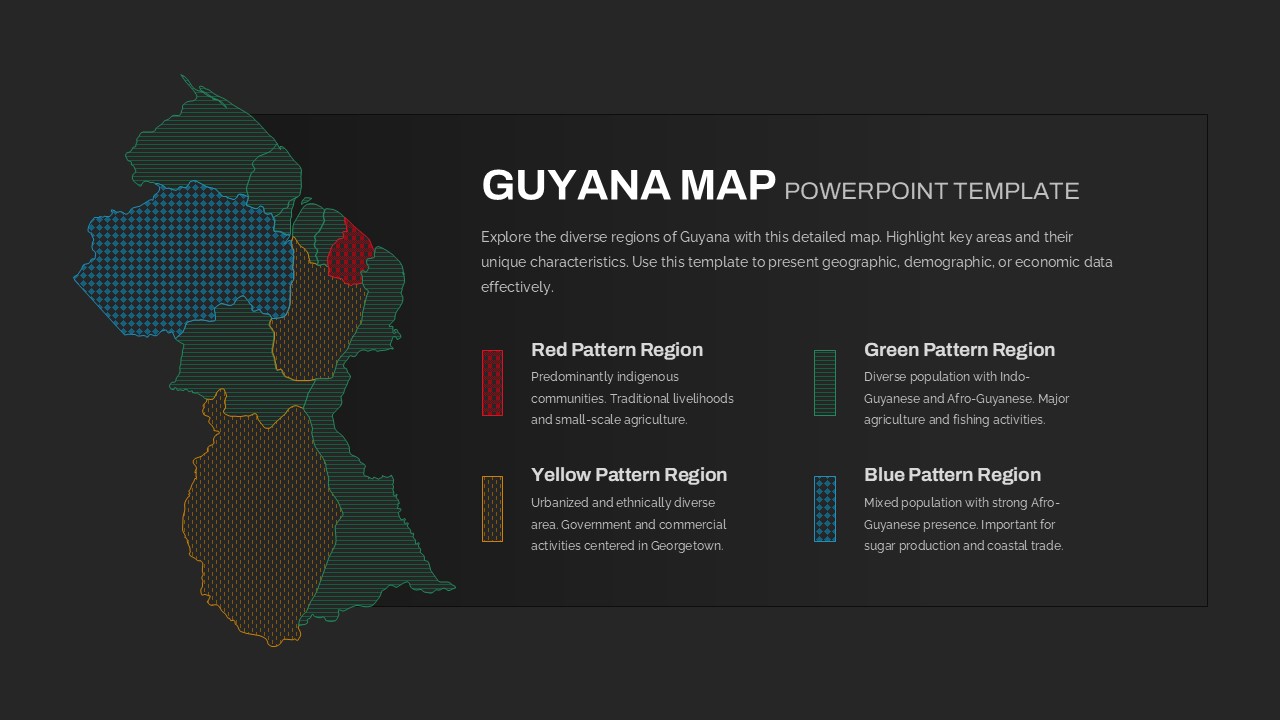
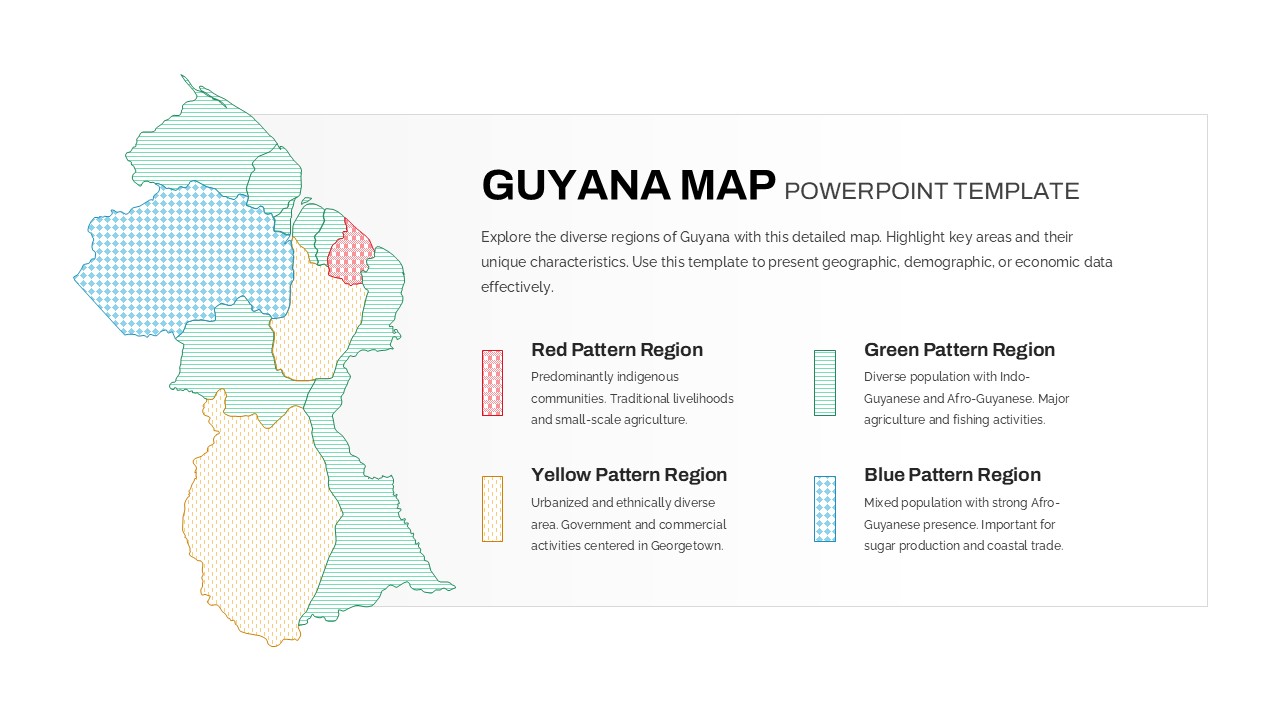
This template features a stylized vector map of Guyana divided into four uniquely patterned regions—red crosshatch for indigenous zones, green horizontal lines for agricultural areas, yellow dotted fill for urban centers, and blue diamond patterns for coastal districts—set against a neutral grey backdrop for non-highlighted provinces. Numbered circular markers connect each region to corresponding legend entries, which include region name placeholders and subtitle text blocks. The slide employs clean sans-serif typography, slim connector arrows, and minimalist callout icons to ensure clarity and sustained audience focus.
All map segments, pattern fills, and callouts are fully editable PowerPoint and Google Slides vector objects linked to master slides and theme color palettes. Users can swap pattern styles, adjust marker positions, or recolor shapes in seconds via drag-and-drop placeholders. Connector arrows feature adjustable stroke weights and customizable arrowhead options, while text boxes support word wrap, hyperlinks, and rich formatting. Snap-to alignment guides and slide grid settings guarantee precise placement and uniform spacing across all elements.
The layout offers optional infographic overlays: insert bar charts, pie graphs, or pictograms directly onto map regions using built-in placeholders. Gradient background toggles and light/dark theme variants accommodate diverse branding requirements. Preconfigured simple animations allow sequential reveal of each region’s data points, and detailed slide notes include presenter cues for seamless delivery. Export settings ensure high-resolution fidelity on widescreen displays, printed posters, and PDF handouts without any loss of detail.
Presenters can also layer route lines to illustrate transport corridors, highlight infrastructure projects, or display statistical overlays by grouping region shapes and linking custom SVG icons. Adapt the template for boardroom briefings, academic research, or market-entry strategies with equal ease.
Who is it for
Regional development agencies, tourism boards, and market researchers will find this slide indispensable when presenting localized insights and strategic plans. Travel agencies, educational institutions, and government planners can leverage its clear, color-coded layout to communicate geographic data effectively to stakeholders.
Other Uses
Use this template to map sales territories, distribution networks, or demographic trends. Adapt the callout text to display climate zones, resource allocations, infrastructure projects, or historical landmarks, making it ideal for consulting presentations, public policy briefings, and classroom assignments.
Login to download this file


