Observation and Recommendation Template for PowerPoint & Google Slides
Observation and Recommendation PowerPoint and Google Slides Template
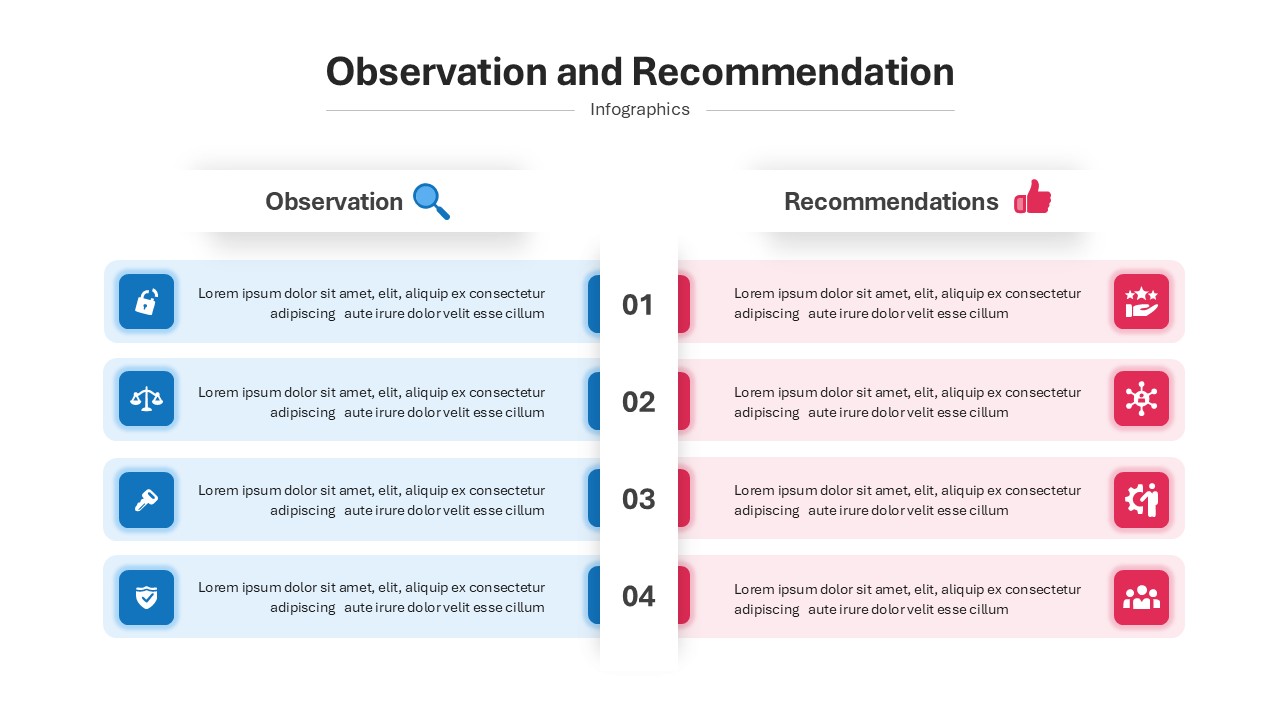
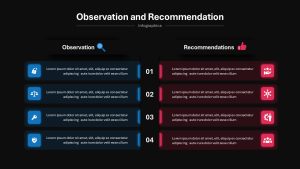
Presenting audit findings, sharing consulting assessments, comparing operational observations with actionable solutions, or delivering compliance reviews requires a structured side-by-side framework. This observation and recommendation PowerPoint template equips management consultants, compliance officers, QA auditors, and project leaders with a clear two-column comparison diagram. By pairing analytical observations directly with strategic recommendations across a central numbered spine, this slide helps speakers deliver persuasive business evaluations during stakeholder reviews and executive briefings.
Key slide components and visual highlights include:
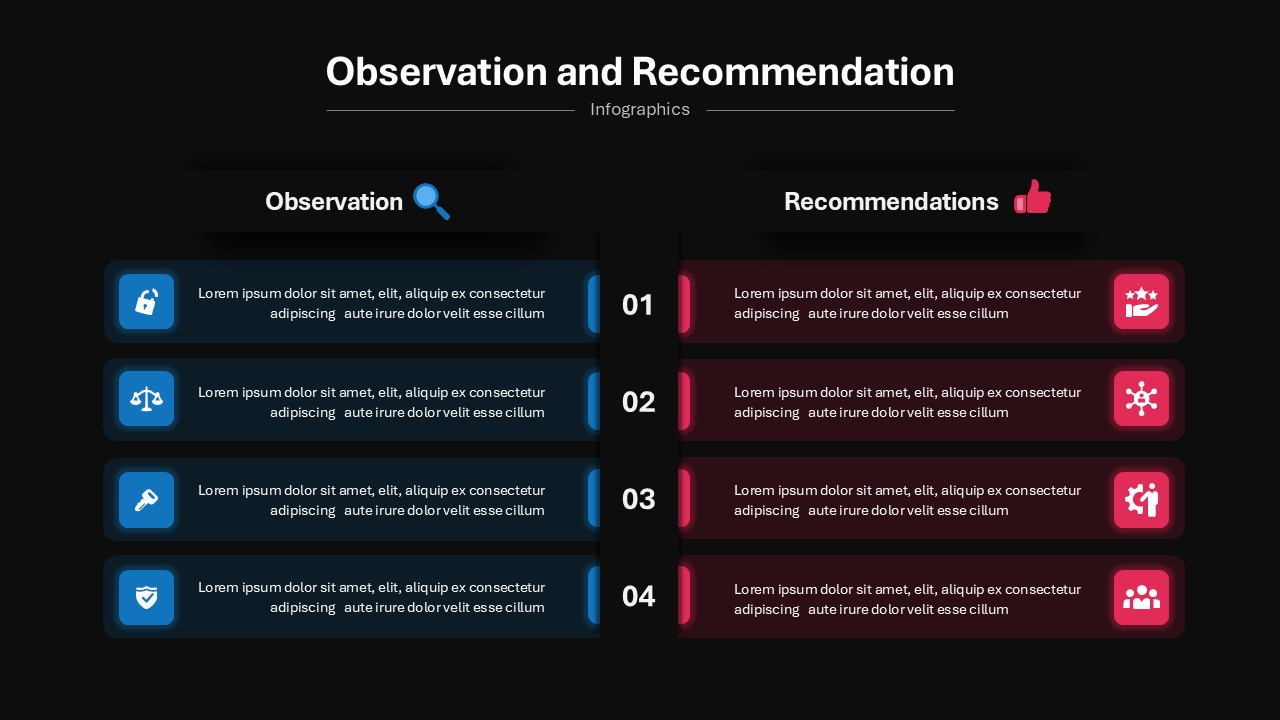
- A balanced two-column comparative architecture dividing assessments into dedicated Observation and Recommendations sections.
- A central vertical numbered dividing pillar aligning four comparative rows labeled 01 through 04 for step-by-step analysis.
- A left-side observation track styled in soft blue horizontal cards with darker blue square icon badges representing security, regulatory balance, operational mechanics, and protection.
- A right-side recommendation track styled in light rose cards with vibrant magenta-red icon badges highlighting customer ratings, interconnected workflows, process engineering, and team collaboration.
- Clear category headers featuring visual cues, including a blue magnifying glass for observations and a red thumbs-up icon for recommendations.
- Crisp white presentation background engineered for high contrast and sharp visibility across digital screens and conference room displays.
- 100% editable vector shapes that let presenters customize color schemes, adjust row quantities, swap icons, and update text descriptions directly within PowerPoint or Google Slides.
Login to download this file

Item ID
SB04775