Net Zero Emissions Template for PowerPoint & Google Slides
Description
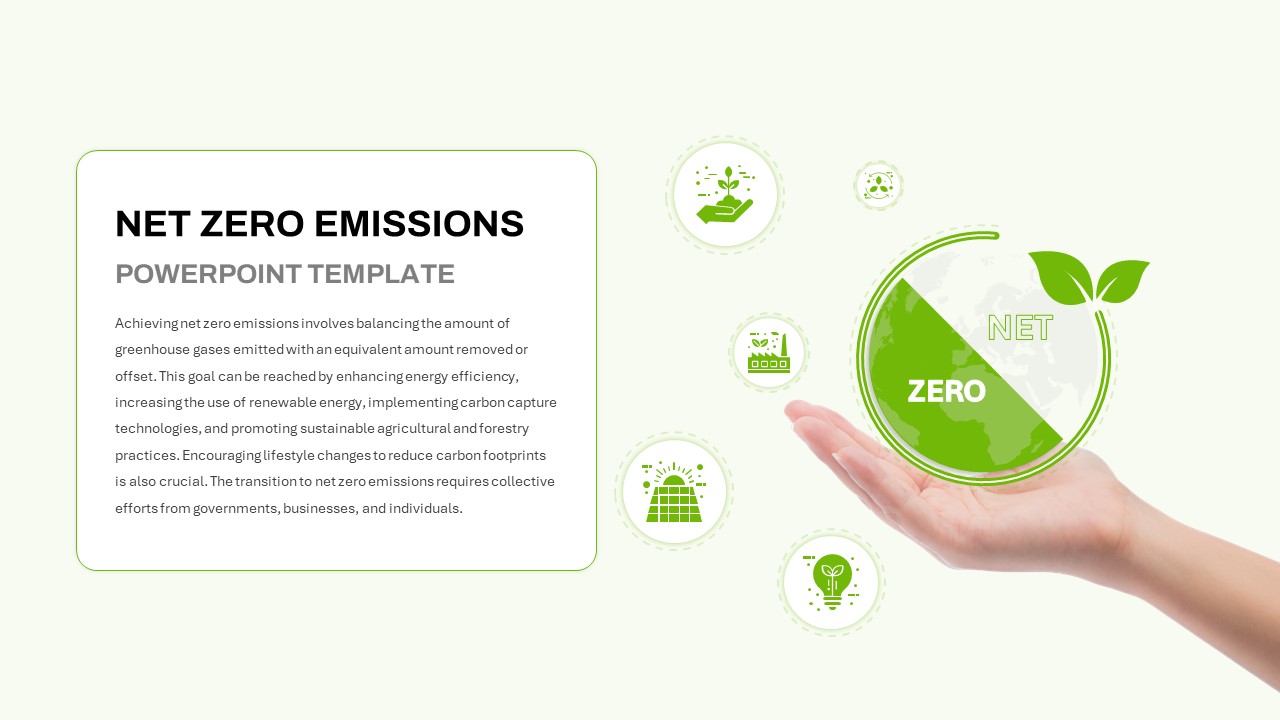
Use this engaging Net Zero Emissions slide to visualize your organization’s greenhouse gas reduction goals with clarity and style. On the right, a semi-circular pie diagram labeled “NET ZERO” is layered over a subtle world map and supported by a realistic hand image, underscoring the human role in sustainability. Surrounding the main chart are five icon containers—representing renewable energy, carbon capture, sustainable agriculture, circular economy, and green innovation—each enclosed in a dashed circle for emphasis. The left panel features a clean text box with a bold title and placeholder body copy for describing net zero strategies, including energy efficiency, carbon offsets, and stakeholder engagement.
Fully editable via master slides, every element is vector-based and customizable. Easily swap icons, adjust colors, or replace the world map graphic to align with your brand. Modify the pie segment proportions to reflect actual metrics, update the title text, or insert your own imagery with built-in placeholders. The slide’s consistent grid structure and layered objects ensure pixel-perfect scaling on any display, while subtle drop shadows and spacing presets maintain a balanced, modern aesthetic.
Optimized for both PowerPoint and Google Slides, this template streamlines collaboration and eliminates formatting issues. Use the layered objects panel to animate each icon or chart segment for dynamic slide entrances, or export static frames as social media assets. Ideal for sustainability reports, corporate presentations, and investor briefings, the slide accelerates alignment on ESG goals and carbon management plans.
Leverage this asset to drive stakeholder engagement, illustrate progress toward carbon neutrality, or introduce your organization’s climate action roadmap with maximum visual impact.
Who is it for
Sustainability officers, ESG managers, and corporate communications teams presenting carbon reduction strategies. Consultants, project leaders, and C-suite executives can leverage the clear infographic design to secure stakeholder buy-in and report on environmental performance.
Other Uses
Repurpose this layout for circular economy overviews, renewable energy roadmaps, or resource management dashboards. Adjust the icons and chart labels to showcase waste reduction metrics, water conservation targets, or corporate social responsibility initiatives.
Login to download this file

Item ID
SB04370
Related Templates

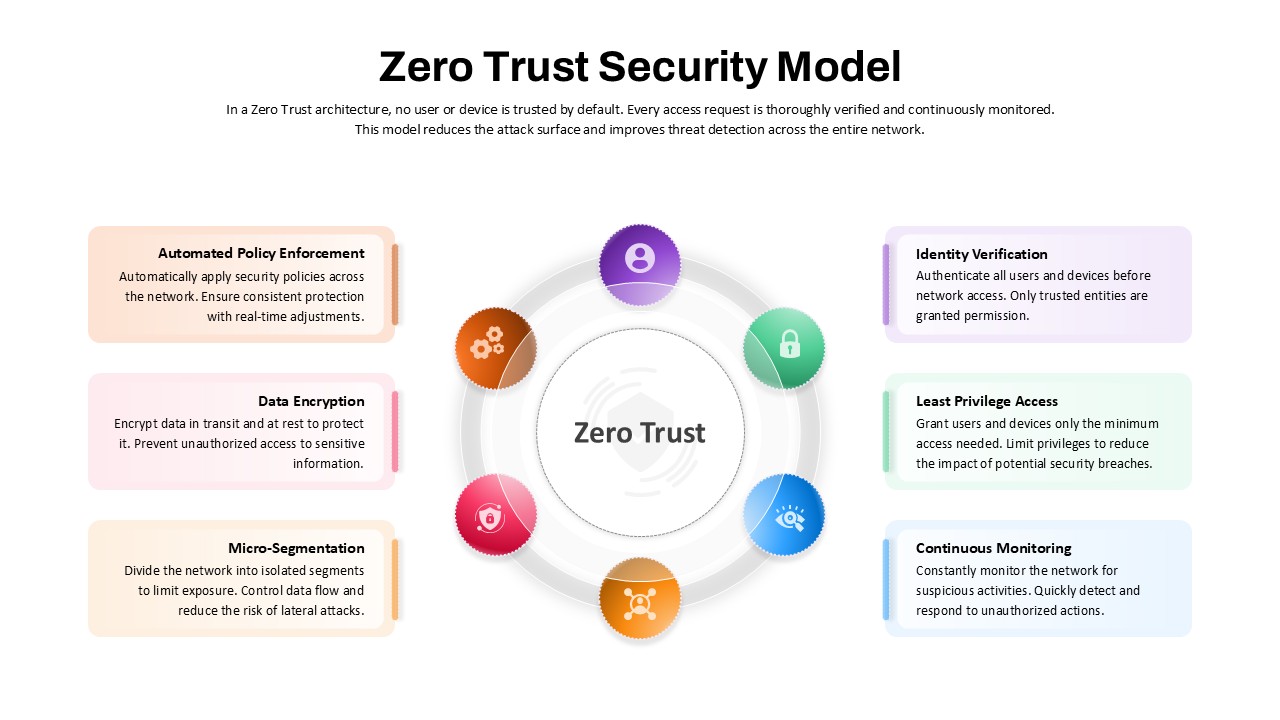
Zero Trust Security Model Overview template for PowerPoint & Google Slides
Infographics
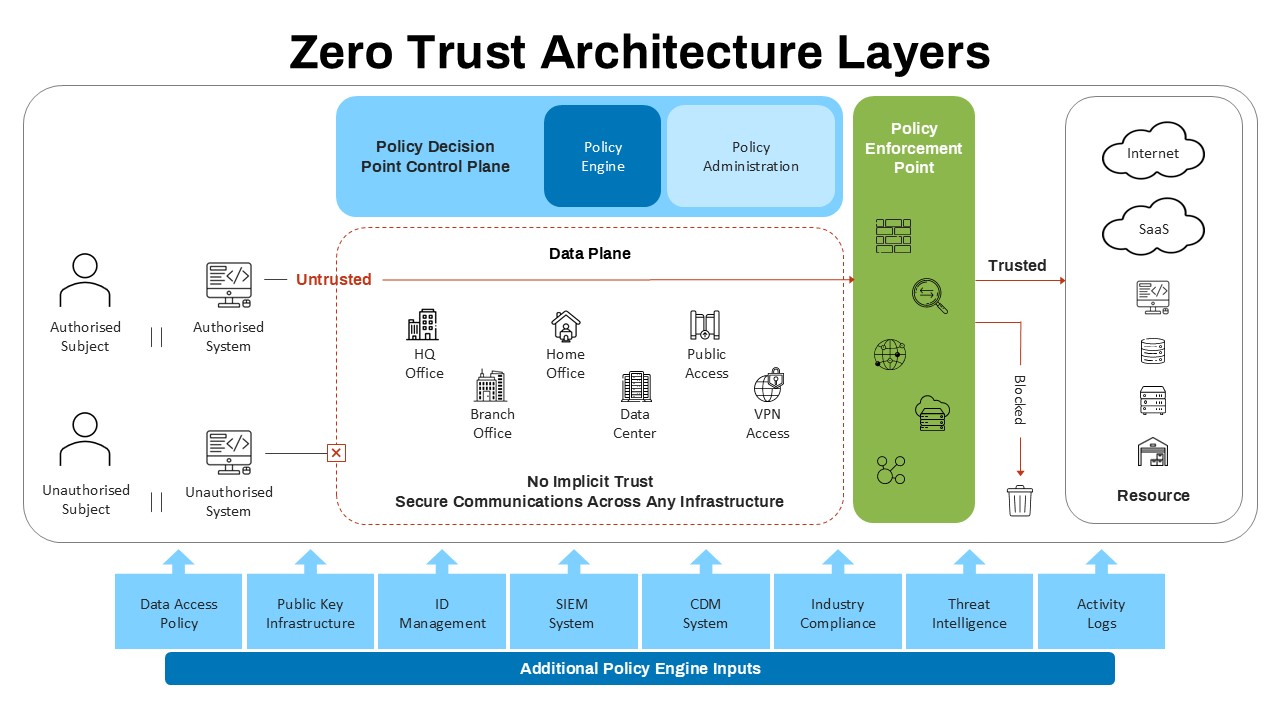
Zero Trust Architecture Layers template for PowerPoint & Google Slides
Technology
Zero Trust Security Model Overview template for PowerPoint & Google Slides
Risk Management

Net Promoter Score Dashboard Template for PowerPoint & Google Slides
Customer Experience

Quarterly Net Interest Income Growth Template for PowerPoint & Google Slides
Bar/Column
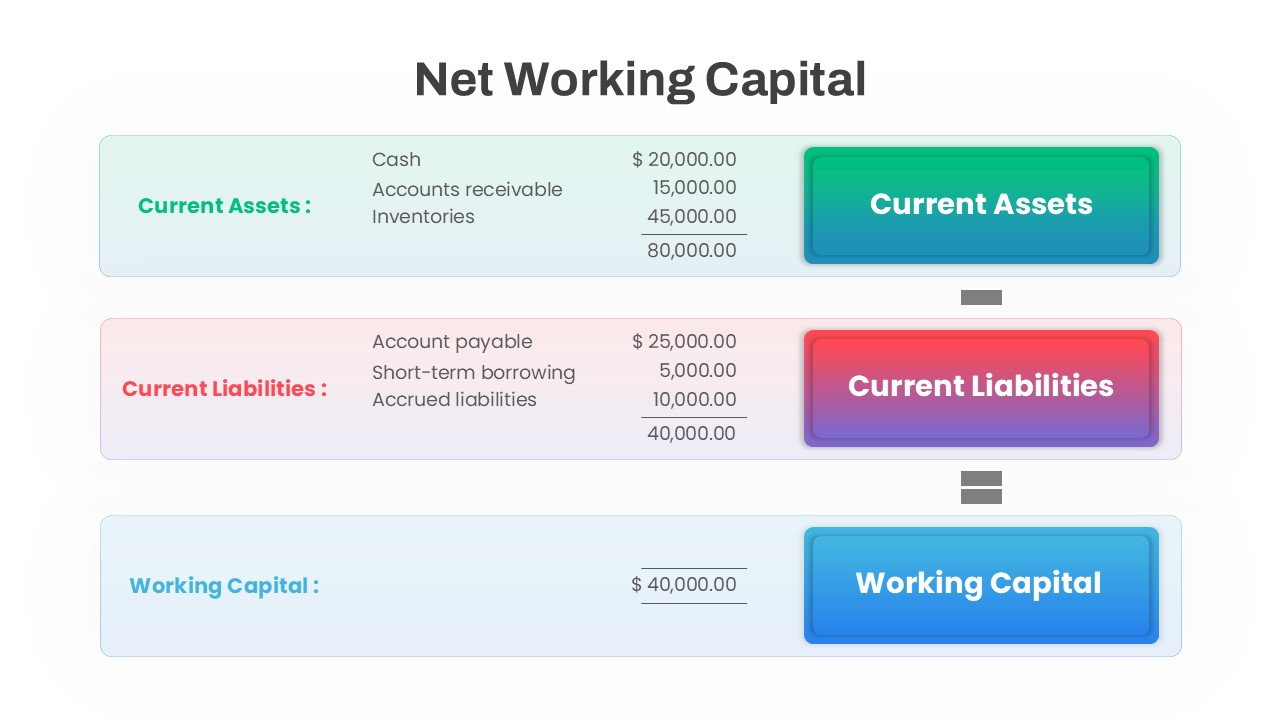
Net Working Capital Calculation Template for PowerPoint & Google Slides
Finance