Net Working Capital Calculation Template for PowerPoint & Google Slides

Description
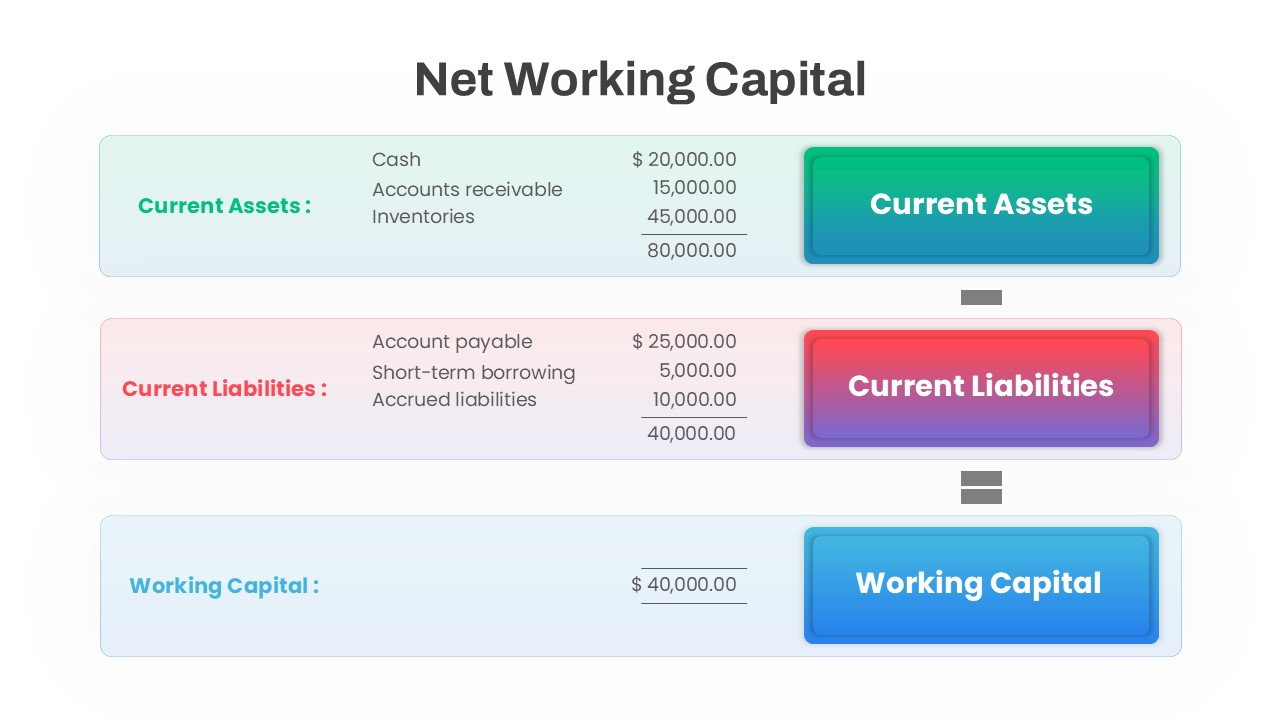
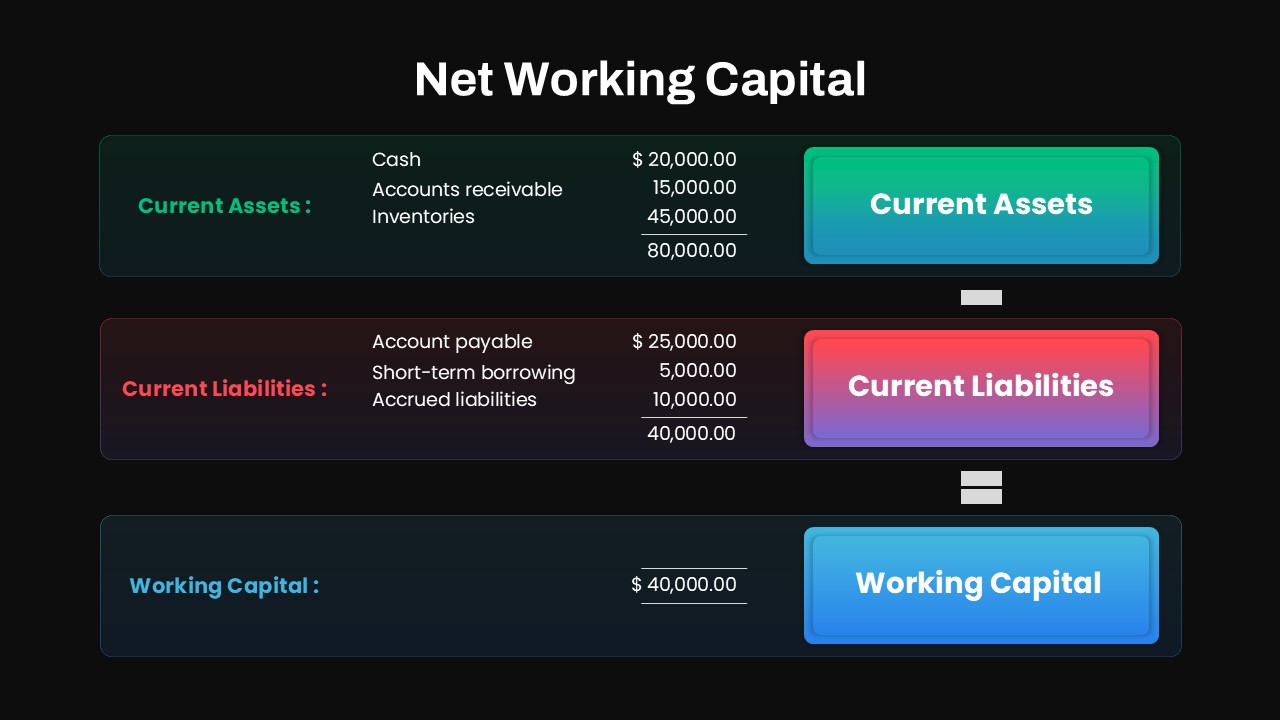
Download this comprehensive net working capital slide template to illustrate your company’s liquidity position with precision and professional design. The slide is arranged in three horizontal panels—Current Assets, Current Liabilities, and Working Capital—each with editable line items and subtotal lines. In the Current Assets panel, input cash, accounts receivable, and inventories; the Current Liabilities panel captures accounts payable, short-term borrowing, and accrued liabilities. A bold minus symbol between the first two panels and an equals symbol above the Working Capital panel visually reinforce the calculation flow. To the right of each panel, a gradient-filled button highlights the section label—emerald for assets, crimson for liabilities, and azure for working capital—enhancing visual hierarchy. Soft pastel backgrounds, subtle drop shadows, and clean sans-serif fonts deliver a modern, minimalist aesthetic that balances data density with readability. Fully editable in PowerPoint and Google Slides, this template uses vector shapes, master slides, and customizable text placeholders so you can adjust amounts, labels, and color schemes in seconds. You can switch between light and dark variants, swap gradient colors to match your branding, and duplicate panels to extend the model for additional financial metrics. Whether you need to present to executive stakeholders, analyze quarterly liquidity trends, or compare working capital scenarios, this slide ensures consistency across devices and resolutions and helps audiences quickly grasp critical figures for faster decision-making.
Who is it for
Financial analysts, CFOs, controllers, and business managers will use this template to communicate liquidity metrics, support budget reviews, and drive stakeholder alignment. Consulting teams, investors, and operational leaders can leverage it in board meetings and strategic workshops.
Other Uses
Repurpose the layout to calculate and display other subtractive metrics such as net profit margins, free cash flow, or segment-level liquidity analyses. Embed it within financial dashboards, investor pitch decks, or quarterly business reviews to streamline your presentation of key performance indicators.
Login to download this file

Item ID
SB04454
Related Templates

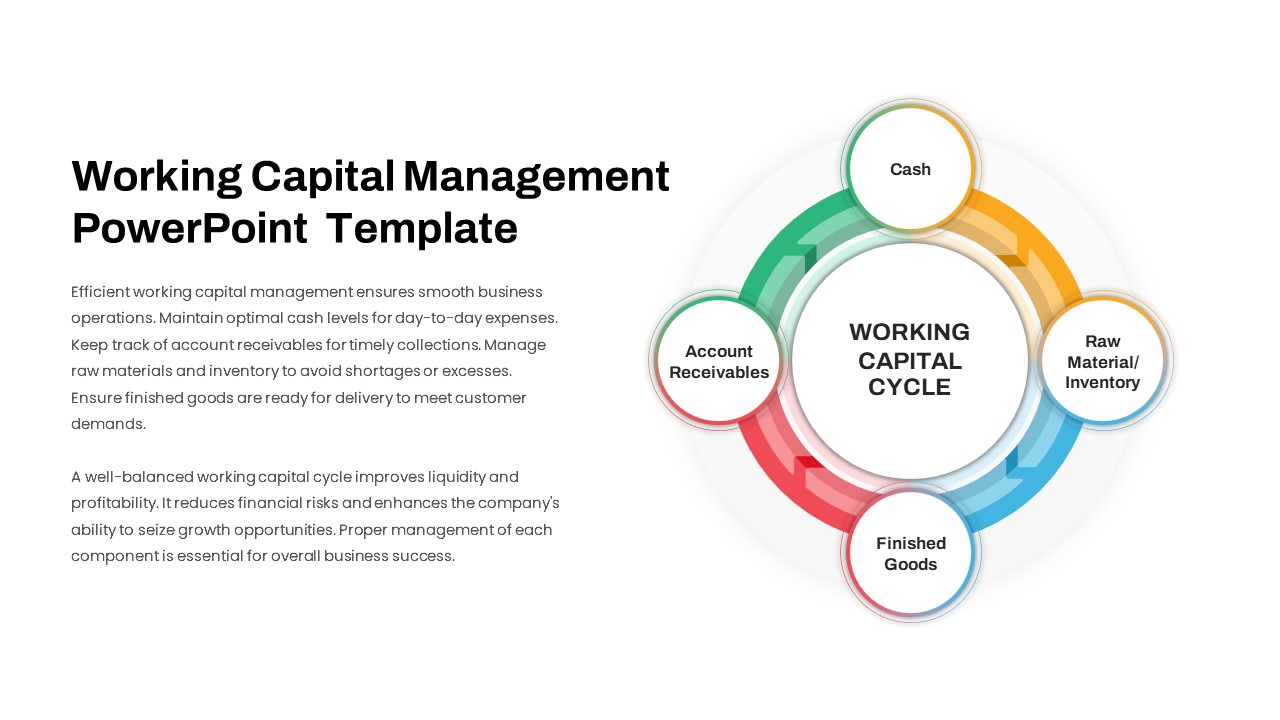
Working Capital Cycle Diagram Template for PowerPoint & Google Slides
Circular
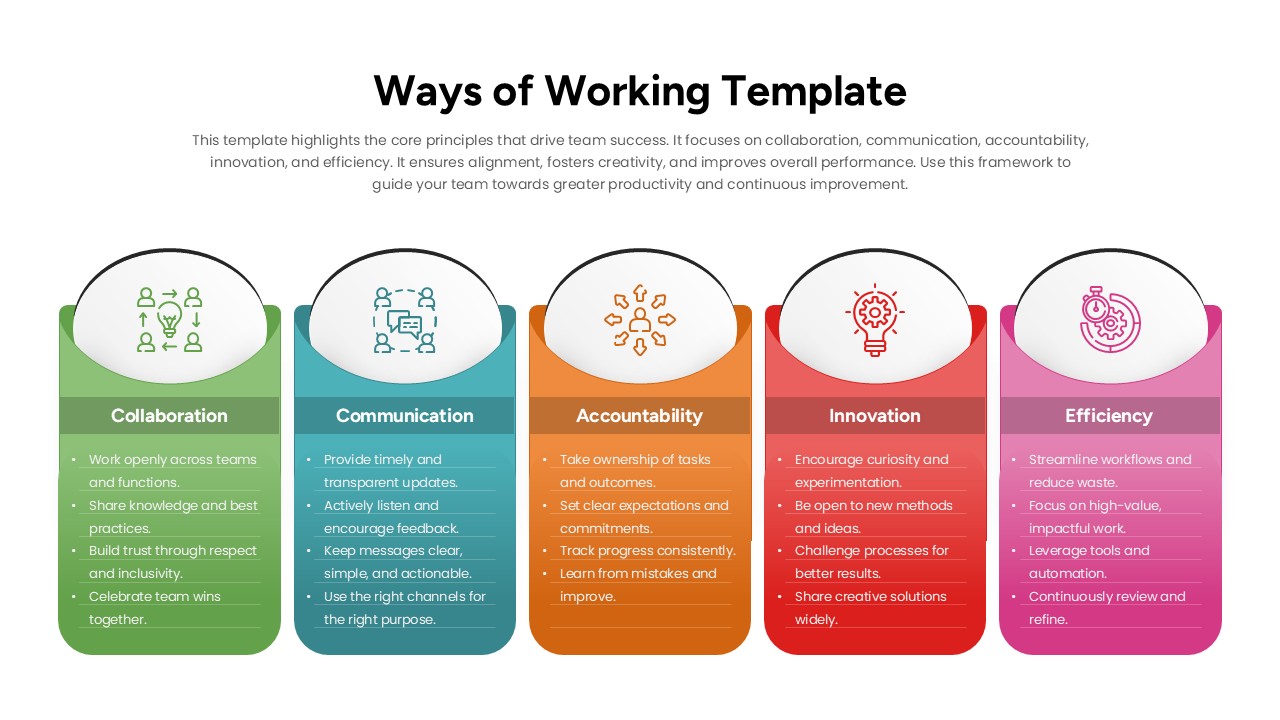
Ways of Working Principles Framework Slide Template for PowerPoint & Google Slides
Leadership

Net Promoter Score Dashboard Template for PowerPoint & Google Slides
Customer Experience

Quarterly Net Interest Income Growth Template for PowerPoint & Google Slides
Bar/Column
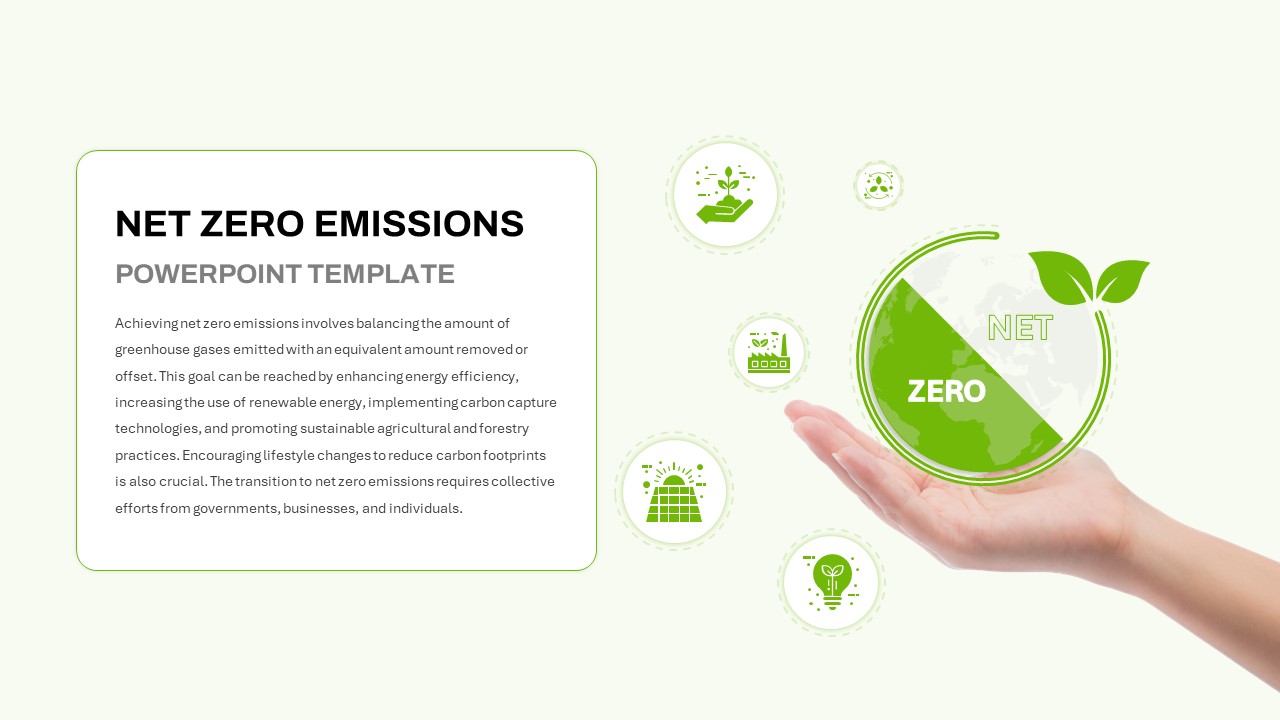
Net Zero Emissions Template for PowerPoint & Google Slides
Graphics
Capital Structure Dynamic Split Chart Template for PowerPoint & Google Slides
Comparison Chart
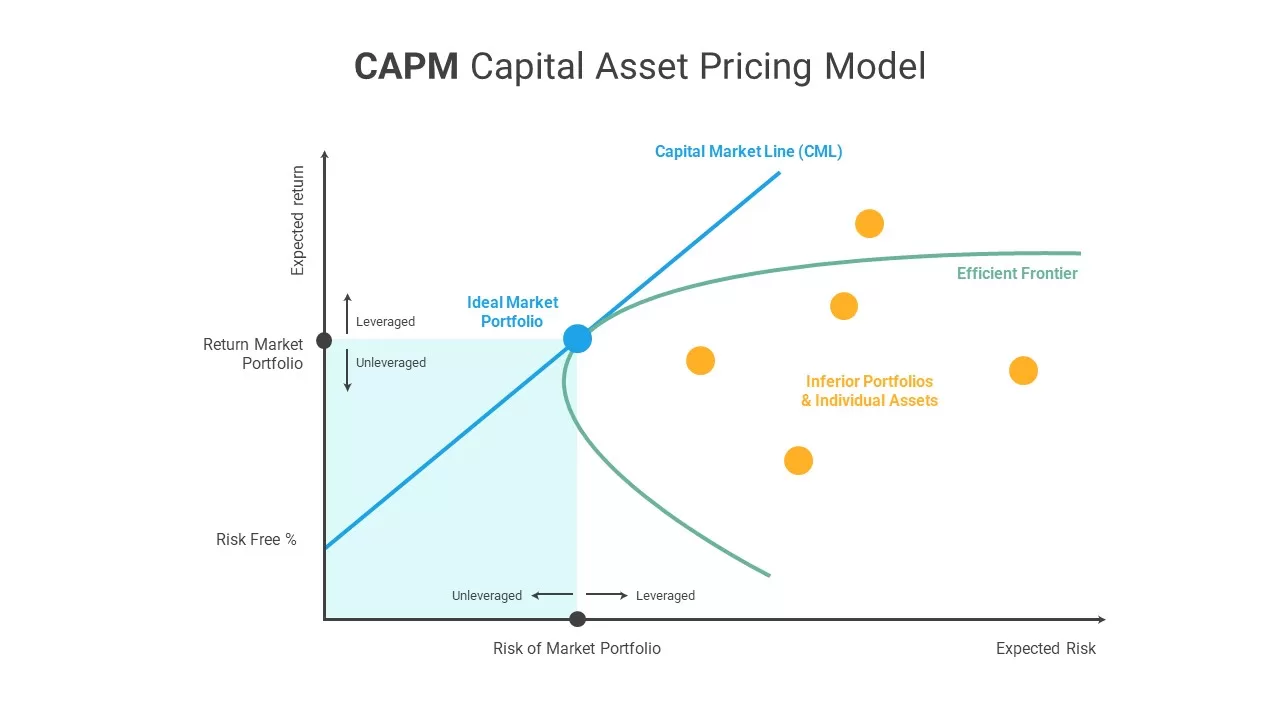
CAPM Capital Asset Pricing Model template for PowerPoint & Google Slides
Finance
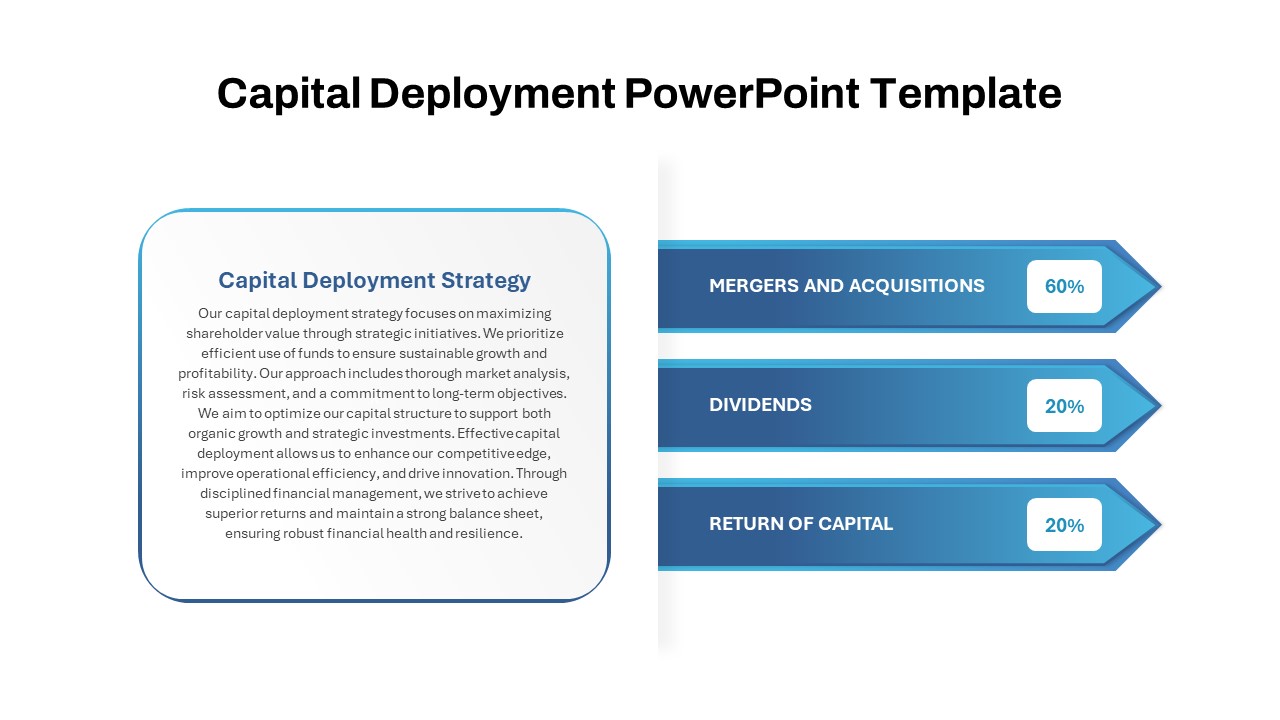
Capital Deployment Percentage Breakdown Template for PowerPoint & Google Slides
Pitch Deck
Capital Investments Process Flow Diagram Template for PowerPoint & Google Slides
Process
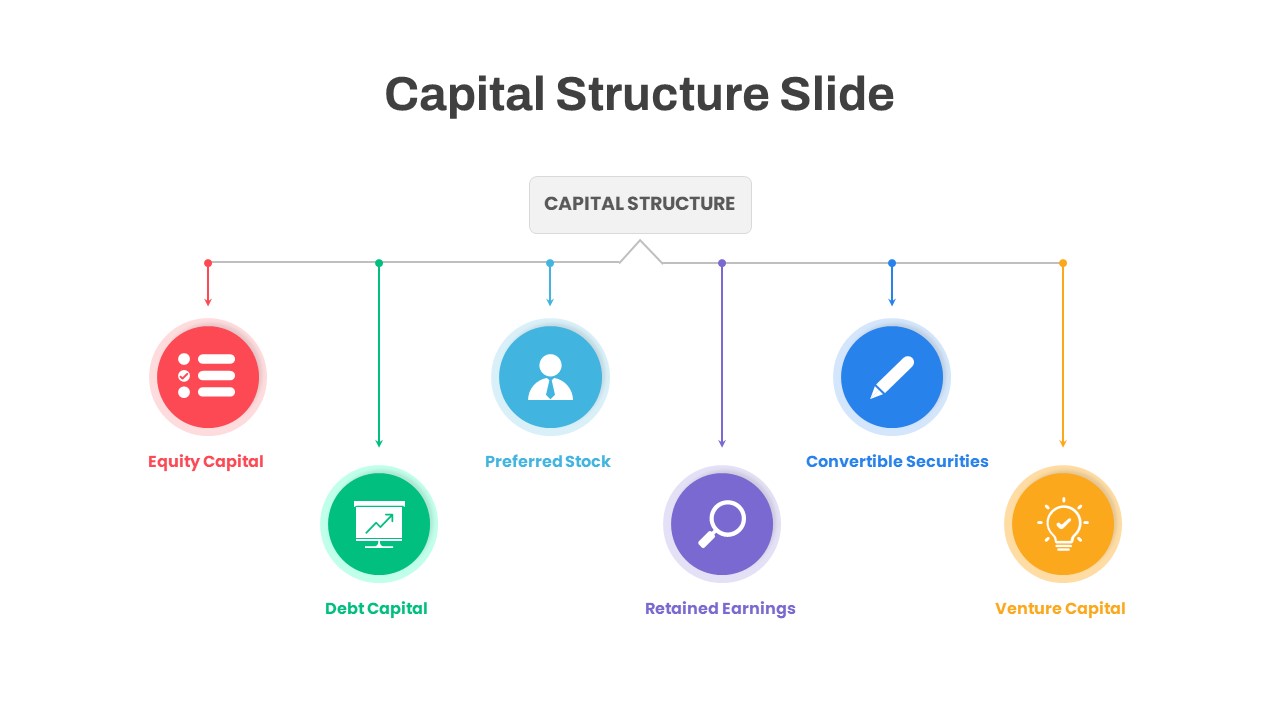
Capital Structure Hub & Spoke Diagram Template for PowerPoint & Google Slides
Process
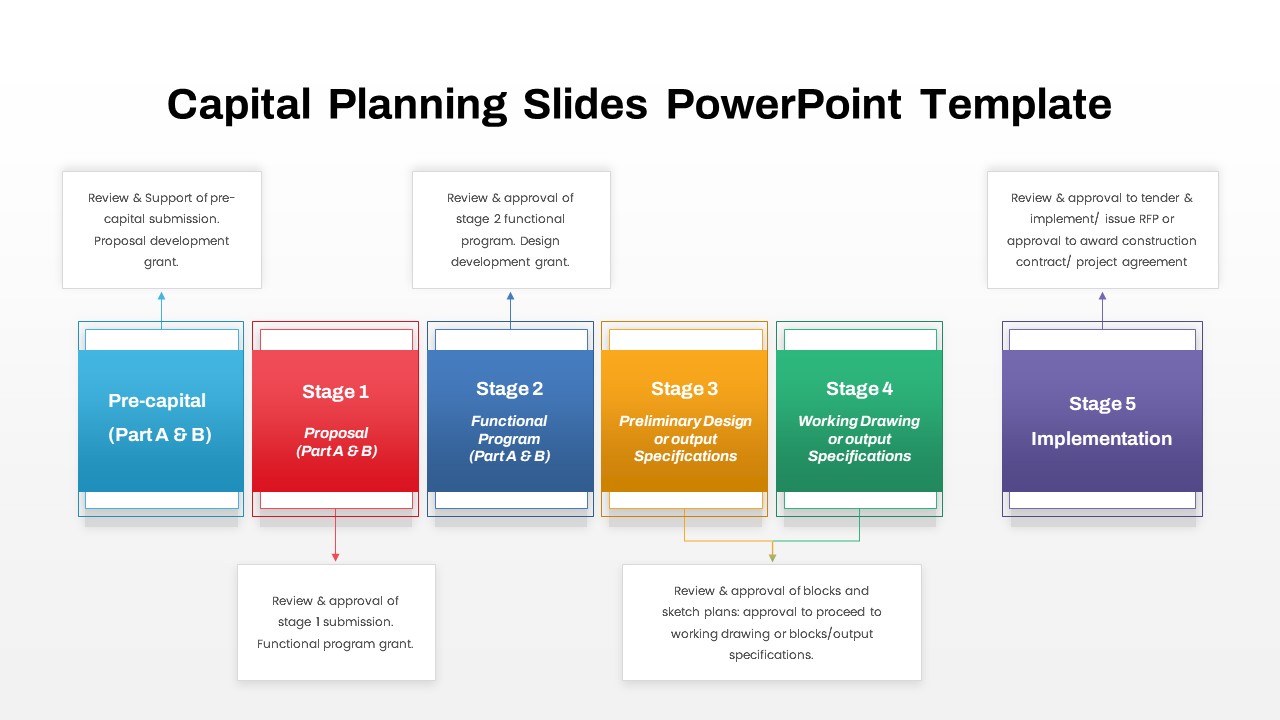
Capital Planning Five-Stage Process template for PowerPoint & Google Slides
Process
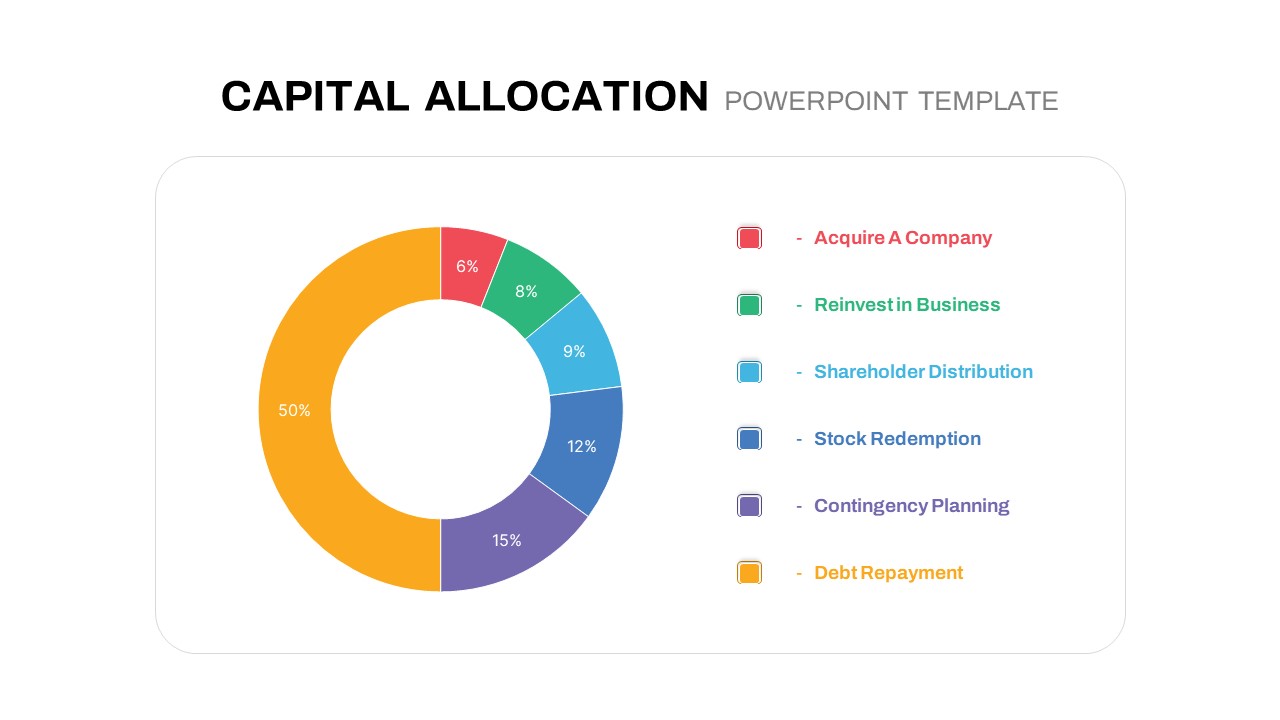
Circular Capital Allocation Diagram Template for PowerPoint & Google Slides
Business Models
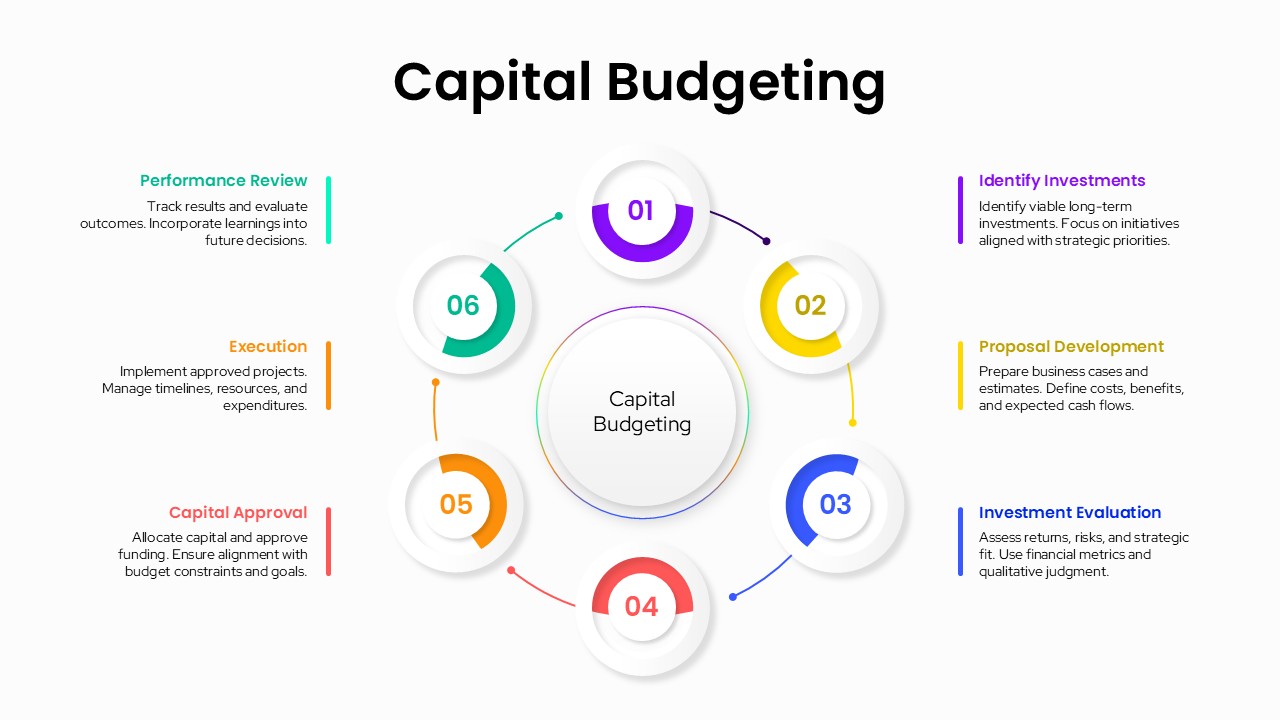
Capital Budgeting Template for PowerPoint & Google Slides
Finance