NAFTA Map PowerPoint Template featured image

Description
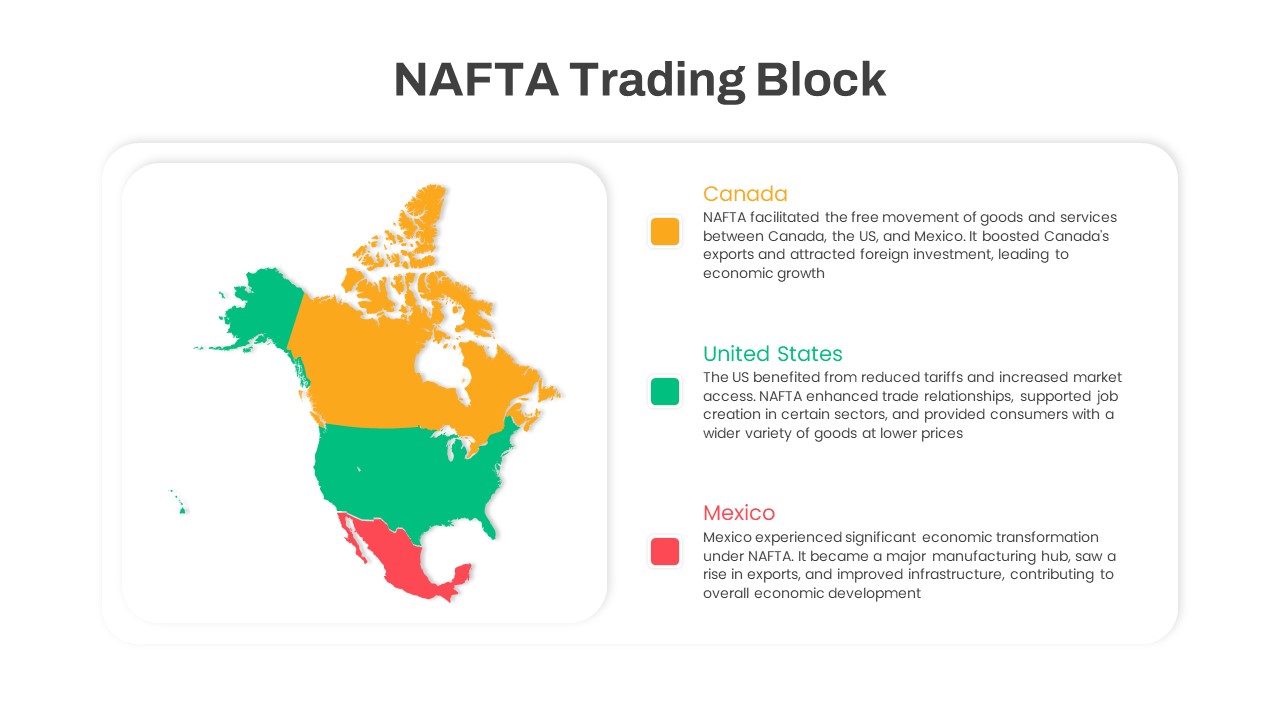
Leverage this high-impact regional map infographic to showcase NAFTA’s three member countries—Canada, the United States, and Mexico—each distinctly color-coded (orange, green, red) for instant visual differentiation. The slide features a clean, fully editable vector map on the left, framed by a soft-corner container, and a corresponding legend panel on the right. Each legend entry combines a colored square marker, bold country headline, and concise impact summary text to articulate NAFTA’s benefits: trade liberalization, tariff reduction, job creation, and infrastructure development. Readable sans-serif fonts, ample white space, and subtle drop shadows deliver a modern, professional aesthetic. All vector shapes, text fields, and color schemes are linked to master slides and intuitive placeholders, enabling effortless customization. Whether resizing the map, swapping colors, or integrating brand fonts, users can adapt the layout in seconds. Optimized for both PowerPoint and Google Slides, this slide ensures consistent formatting across platforms and devices, with high-resolution clarity maintained in presentations, printed materials, and large-screen displays.
Who is it for
Economic analysts, trade policy advisors, and corporate strategists will find this template essential for presenting cross-border trade agreements and market performance overviews. C-suite executives and investor relations teams can leverage it to highlight NAFTA’s economic contributions during board meetings and capital-raising events. Educators and students specializing in economics, international business, or political science can also use it as a clear teaching aid or project submission asset.
Other Uses
Beyond NAFTA, repurpose this framework to visualize any regional alliance—EU, ASEAN, MERCOSUR, or custom trade blocs—by updating country highlights and text. It is ideal for sales territory breakdowns, regional performance metrics, demographic distribution maps, and competitive landscape analyses. Duplicate legend cards to compare multiple variables, or integrate additional data points like GDP figures, export volumes, or market share. This adaptable design streamlines complex storytelling and enhances audience engagement across industries.
Login to download this file


