peak line graph powerpoint


Description
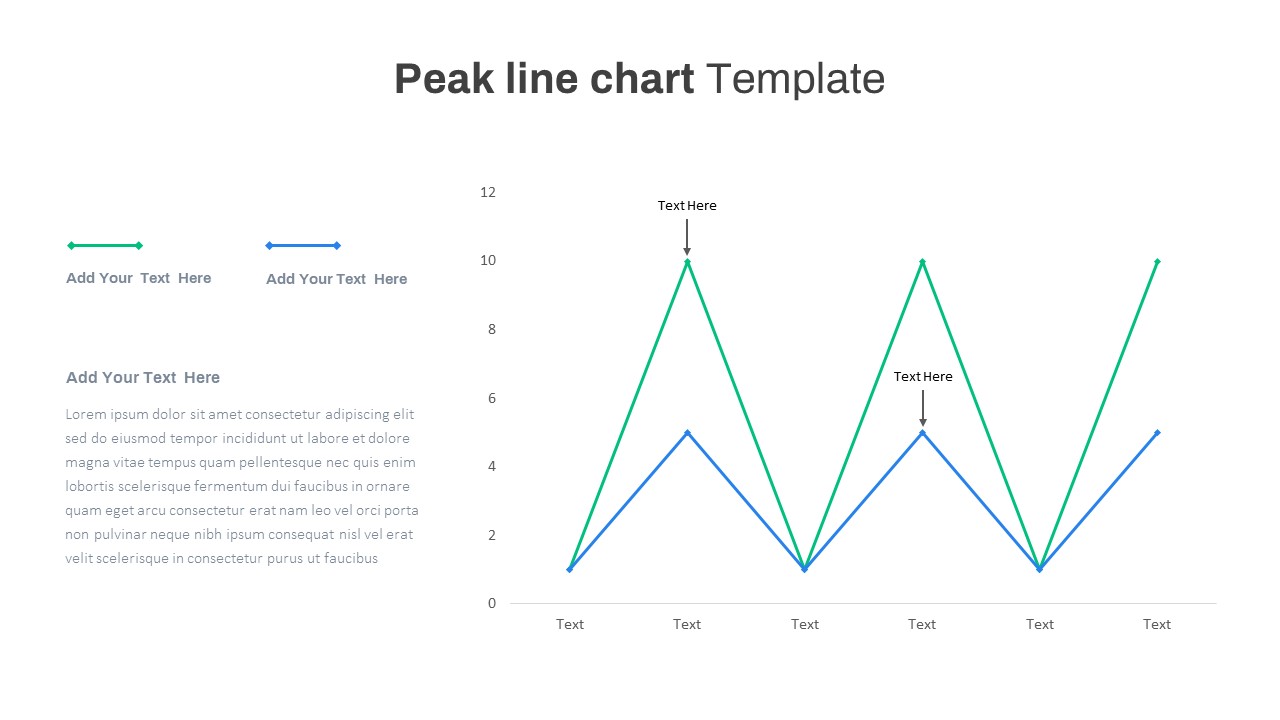
Drive deeper insights with this editable multi-series peak line chart slide, designed to showcase comparative data trends and key performance indicators with precision. The slide features two distinct line series—one in vibrant green and another in crisp blue—each marked with diamond endpoints to highlight data points. Vertical annotations at peak values provide clear callouts for critical milestones, while a simple horizontal axis labeled with customizable categories ensures your audience can easily follow fluctuations over time. A clean white background, subtle gridlines, and minimalist typography combine to create a professional and distraction-free canvas for your data narrative.
Leveraging master slides and fully editable elements, you can quickly adjust line colors, swap data labels, or reposition annotations to fit your brand guidelines. The left panel includes a dedicated text placeholder for contextual summaries or insights, making it easy to pair visuals with narrative explanations. Whether you need to emphasize seasonal peaks, compare product performance, or track resource utilization, this slide’s adaptable structure empowers you to present complex data in a straightforward, visually engaging manner.
Optimized for both PowerPoint and Google Slides, this asset maintains high resolution clarity and consistent formatting across platforms. Simply duplicate the slide within your deck, update your data series, and customize axis labels to align with your reporting period.
Who is it for
Business analysts, marketing managers, and financial planners will value this slide for tracking trends, comparing performance metrics, and highlighting critical data points. Project managers, consultants, and C-suite executives can leverage the clear visual hierarchy to support data-driven decision-making in team meetings, board presentations, and stakeholder briefings.
Other Uses
Beyond KPI tracking, repurpose this layout for project timeline highlights, sales funnel overviews, budget vs. actual comparisons, and resource allocation reviews. Use the dual-series format to contrast year-over-year data, benchmark departmental outputs, or showcase A/B test results with equal clarity.
Login to download this file


