Muda 7 Wastes Recycling Bin Metaphor Template for PowerPoint & Google Slides
Description
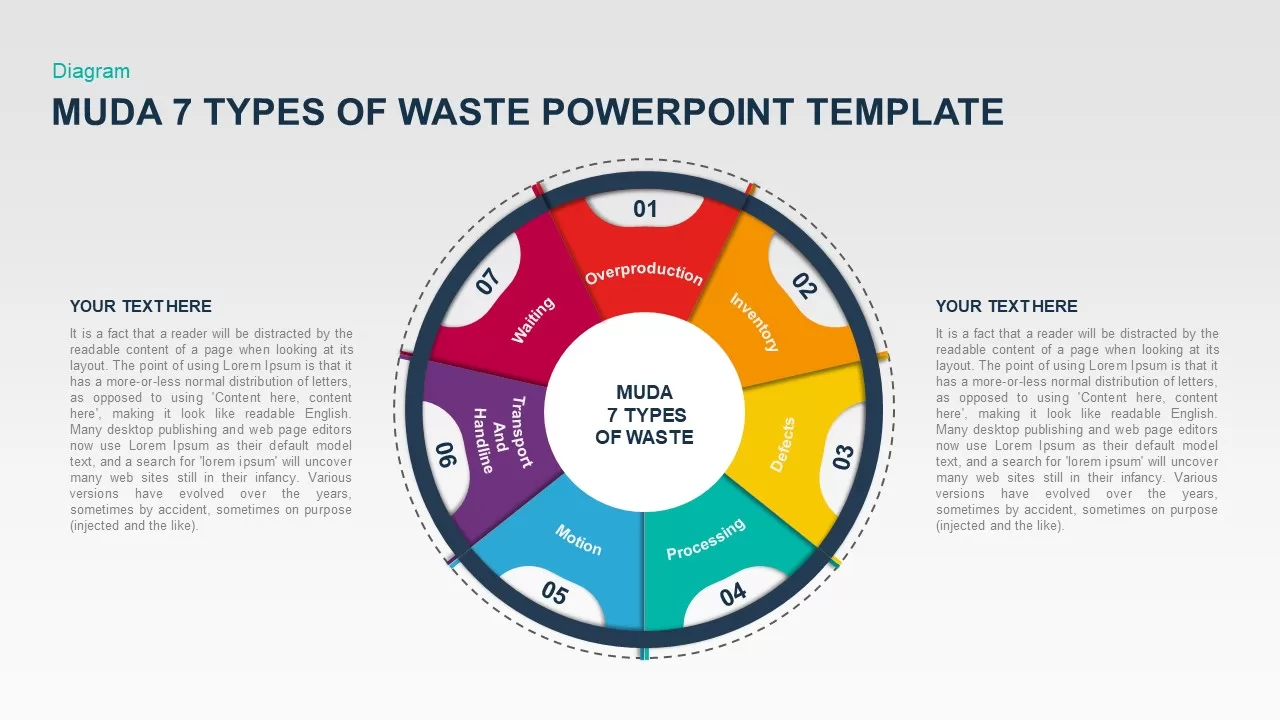
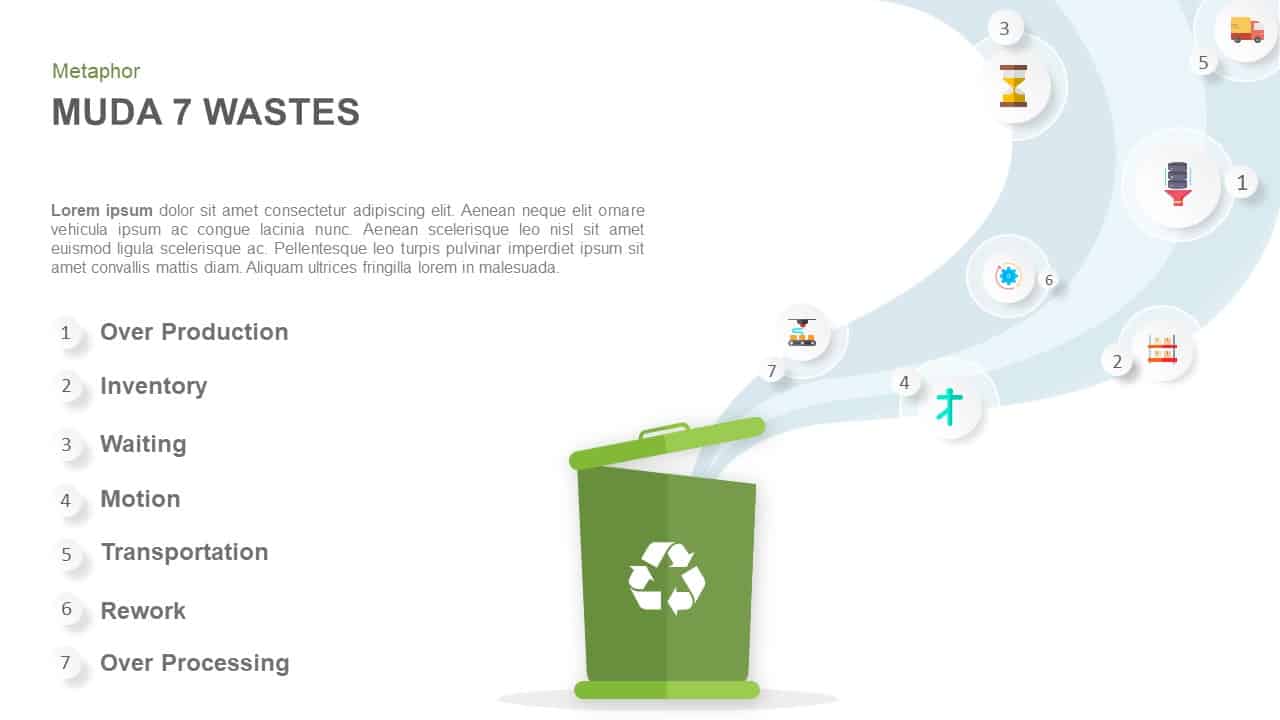
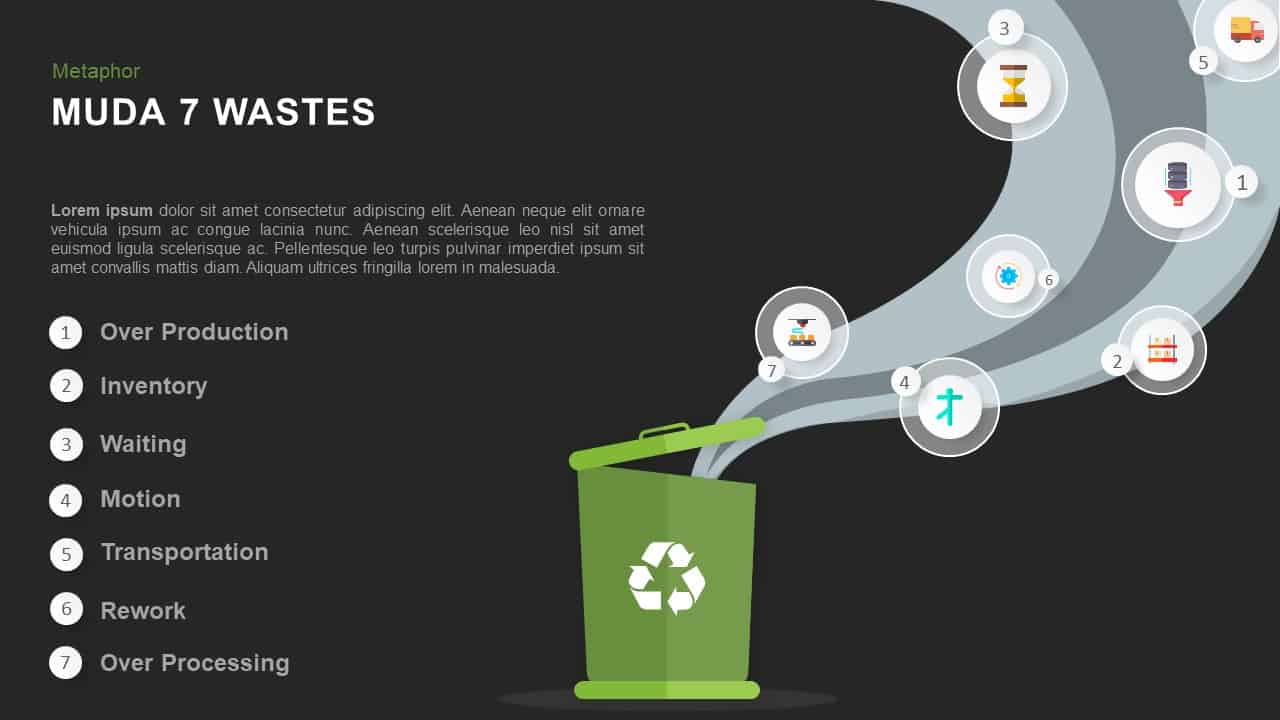
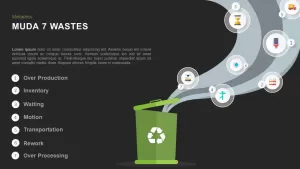
Use this Muda 7 Wastes slide to illustrate the key lean manufacturing wastes within a recycling bin metaphor. The diagram features a central bin with numbered icon bubbles swirling outward along curved pathways, each corresponding to a waste type: Over Production, Inventory, Waiting, Motion, Transportation, Rework, and Over Processing. The numbered icons provide intuitive visual cues, while the left-aligned list offers space for detailed definitions, metrics, or elimination strategies. A clean white backdrop, flat icon shading, and subtle shadows deliver high readability in boardroom presentations and printed handouts.
Designed entirely with editable vector shapes and master layouts, this template offers complete customization without compromising slide integrity. Swap icons to represent alternative waste categories, recolor swirl paths or the bin to match brand palettes, or adjust icon positions to suit narrative flow. Use built-in entrance animations to sequentially introduce each waste, apply fade or zoom effects to emphasize critical areas, or overlay data tables alongside callouts to correlate waste metrics and cost impacts. The modular structure allows duplication of the bin element to compare baseline versus post-improvement scenarios.
Optimized for seamless compatibility with PowerPoint and Google Slides, this slide preserves vector fidelity, formatting precision, and animation timing across devices. Project managers, Lean consultants, and continuous improvement teams can integrate KPI charts, root cause analyses, or action plans directly onto the slide, streamlining workshop facilitation and stakeholder alignment. Duplicate the layout to create multiple scenario comparisons, adjust the swirl radius to fit different icon counts, or collapse the list for high-level overviews.
Whether you’re conducting value stream mapping, Lean training, or performance reviews, this versatile Muda 7 Wastes infographic drives clarity and engagement. It simplifies communication of complex process inefficiencies, promotes data-driven decision-making, and accelerates consensus on waste elimination strategies.
Who is it for
Lean consultants, process improvement specialists, and operations managers will benefit from this slide when facilitating kaizen workshops, conducting waste audits, or presenting continuous improvement initiatives. Project leads, manufacturing engineers, and quality teams can leverage its clear breakdown to align stakeholders and drive action.
Other Uses
Repurpose this bin metaphor to visualize defect categories, risk classification tiers, or stages of a corrective action plan. Use the numbered callouts to illustrate project milestones, safety incident types, or customer feedback categories in any process-driven presentation.
Login to download this file

Item ID
SB00983
Related Templates

MUDA Seven Types of Waste Diagram Template for PowerPoint & Google Slides
Circular
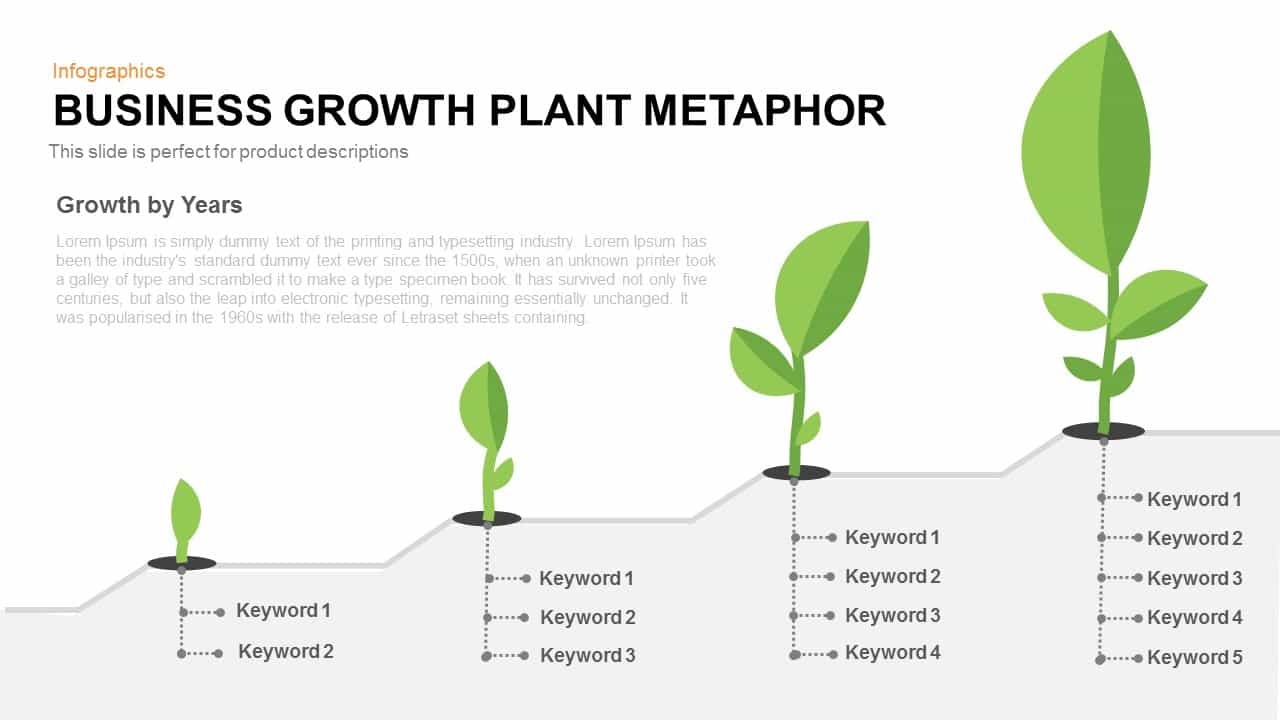
Business Growth Plant Metaphor Timeline Template for PowerPoint & Google Slides
Business Strategy

Discover Metaphor Concept Slide Template for PowerPoint & Google Slides
Infographics

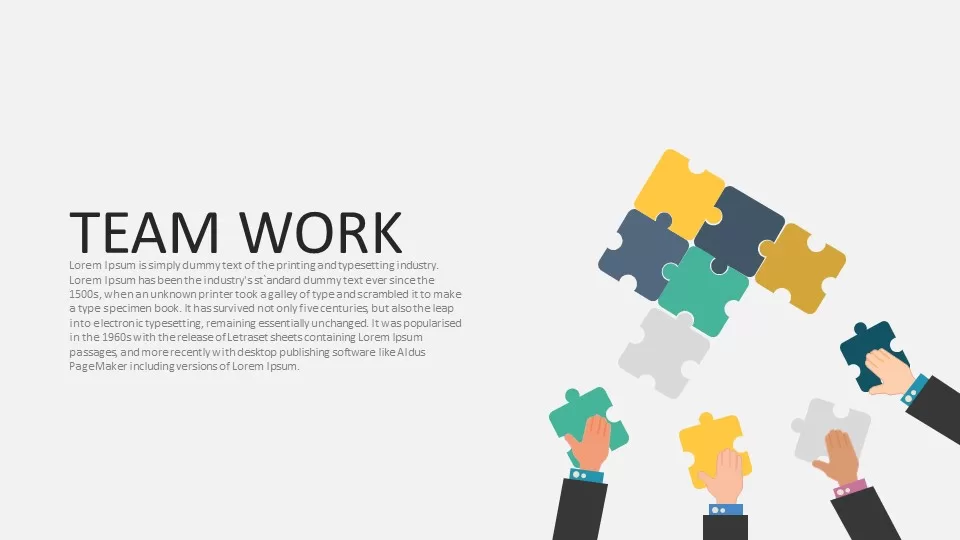
Teamwork Puzzle Metaphor Slide Template for PowerPoint & Google Slides
Our Team
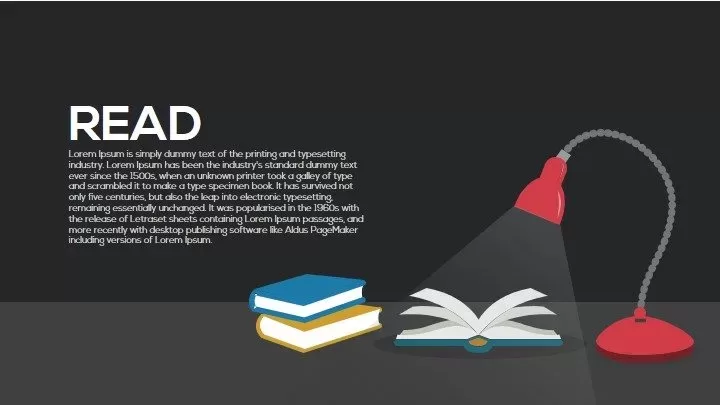
Read Metaphor Concept Illustration Slide Template for PowerPoint & Google Slides
Infographics
Metaphor Light Bulb Idea Concept Template for PowerPoint & Google Slides
Infographics
Leadership Metaphor Presentation Slide Template for PowerPoint & Google Slides
Leadership
Megaphone Communication Metaphor Template for PowerPoint & Google Slides
Advertising
Metaphor Multitasking Illustration Template for PowerPoint & Google Slides
Business
Metaphor Knowledge Illustration Slide Template for PowerPoint & Google Slides
Infographics
Strength Metaphor Dumbbell Diagram Template for PowerPoint & Google Slides
Accomplishment
Rebuild Brick Wall Metaphor Slide Template for PowerPoint & Google Slides
Infographics
Efficiency KPI Dashboard Metaphor Template for PowerPoint & Google Slides
Infographics
Destination Roadmap Pin Metaphor Template for PowerPoint & Google Slides
Roadmap
Metaphor Speed Template for PowerPoint & Google Slides
Process
Scale Metaphor Metrics Comparison Template for PowerPoint & Google Slides
Charts
Key Metaphor Infographic Slide Template for PowerPoint & Google Slides
Process
Mustard and Navy Balance Scale Metaphor Template for PowerPoint & Google Slides
Comparison
Shield Metaphor Security and Protection Template for PowerPoint & Google Slides
Risk Management
Magnifying Glass Research Metaphor Template for PowerPoint & Google Slides
Process
Business Opportunity Metaphor Slide Template for PowerPoint & Google Slides
Opportunities Challenges
Productivity Metaphor Clock Icon Template for PowerPoint & Google Slides
Graphics
Explore Binoculars Metaphor Slide Template for PowerPoint & Google Slides
Process
Guide Metaphor Navigation Infographic Template for PowerPoint & Google Slides
Process
Office Workspace Metaphor Slide Template for PowerPoint & Google Slides
Business Proposal
Operation Process Metaphor Diagram Template for PowerPoint & Google Slides
Process
Professional Security Metaphor Diagram Template for PowerPoint & Google Slides
Information Technology
Navigation Compass Metaphor Slide Template for PowerPoint & Google Slides
Vision and Mission
Deadline Metaphor Timeline & Hourglass Template for PowerPoint & Google Slides
Project
Planning Metaphor Flowchart Slide Template for PowerPoint & Google Slides
Process
Product Shipping Metaphor Diagram Template for PowerPoint & Google Slides
Process
Competition Metaphor Podium Diagram Template for PowerPoint & Google Slides
Business
News Metaphor Media Communication Slide Template for PowerPoint & Google Slides
Business Report
Improvement Growth Arrow Metaphor Template for PowerPoint & Google Slides
Bar/Column
Process Improvement Metaphor Diagram Template for PowerPoint & Google Slides
Process
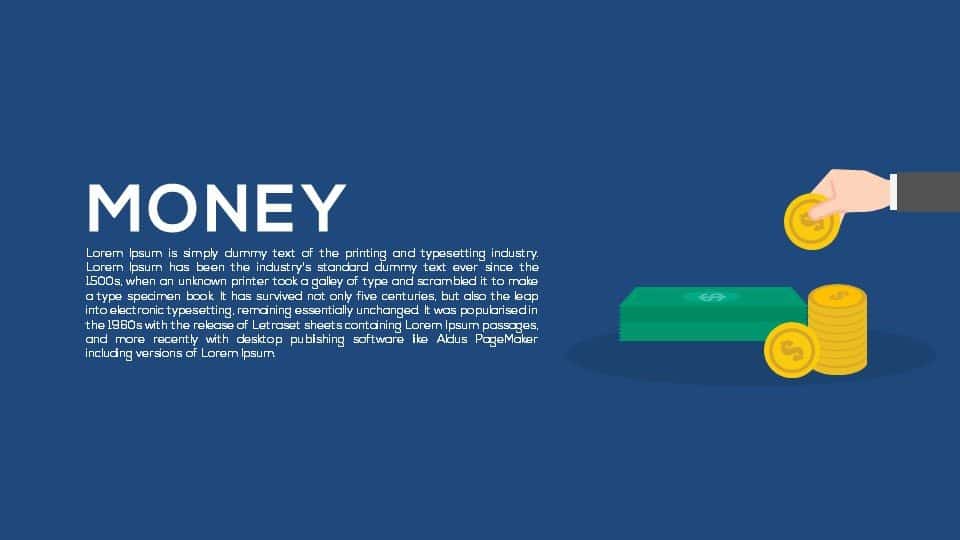
Money Metaphor Financial Overview Template for PowerPoint & Google Slides
Finance
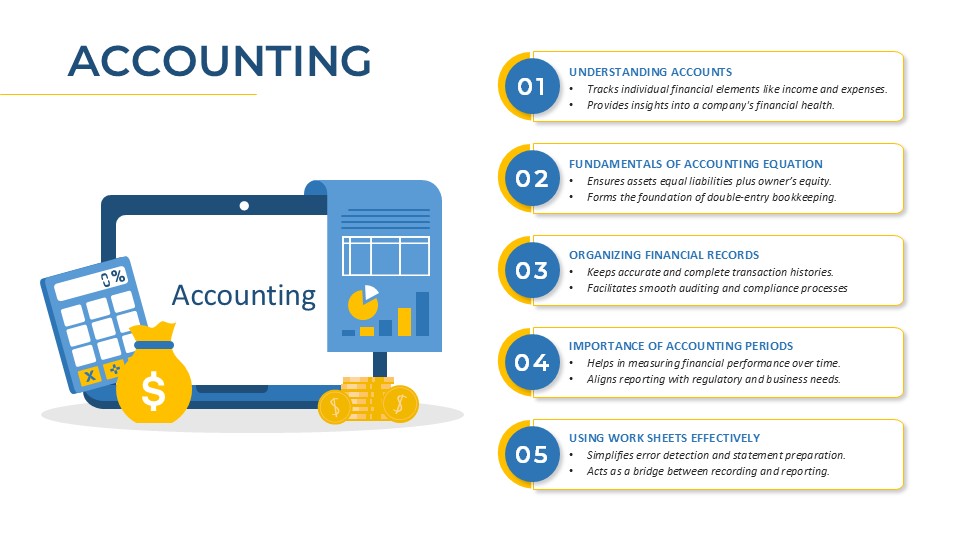
Accounting Process Metaphor Diagram Template for PowerPoint & Google Slides
Accounting
Dual Percentage Comparison Metaphor Template for PowerPoint & Google Slides
Comparison

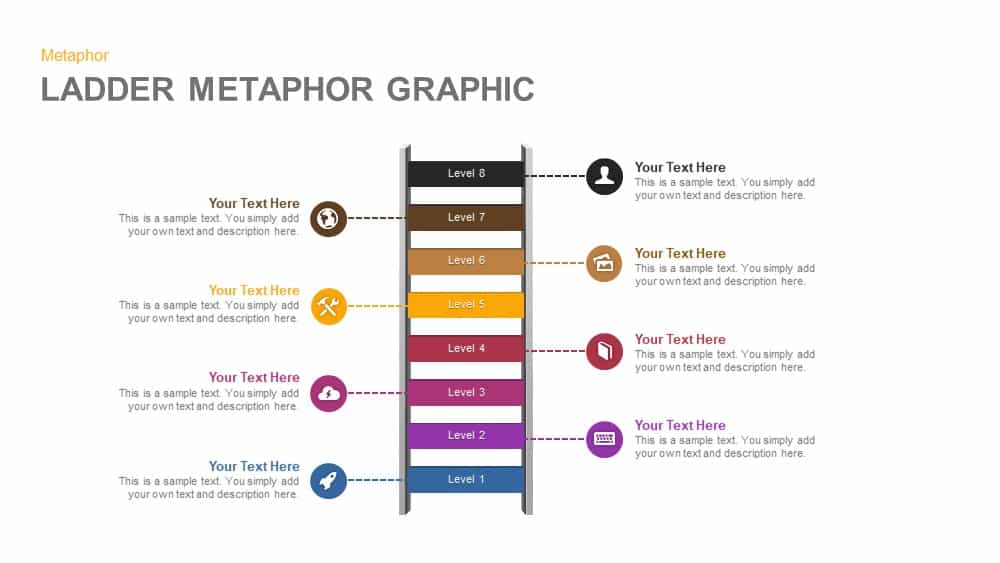
Eight-Level Ladder Metaphor Graphic Template for PowerPoint & Google Slides
Process
Business Decision-Making Metaphor Template for PowerPoint & Google Slides
Leadership
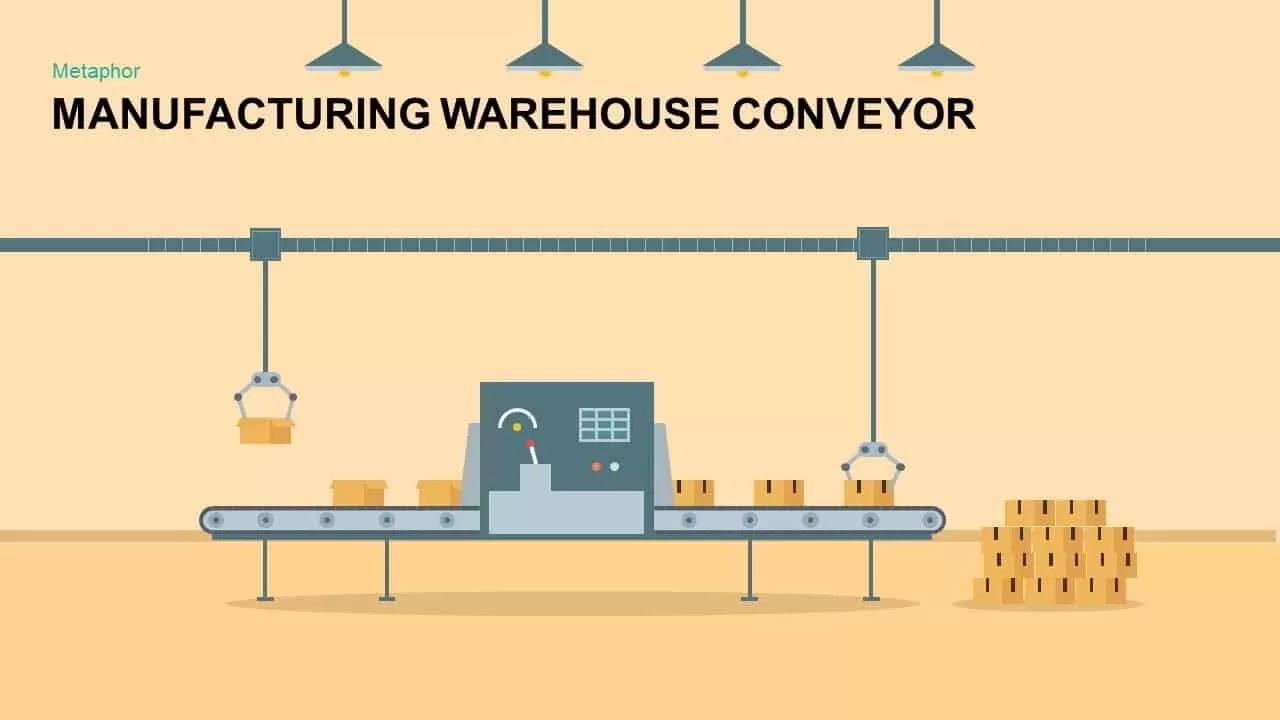
Warehouse Conveyor Process Metaphor Template for PowerPoint & Google Slides
Process
Cyber Security Metaphor Diagram Template for PowerPoint & Google Slides
Risk Management
Developer Icons Metaphor Slide Template for PowerPoint & Google Slides
Software Development
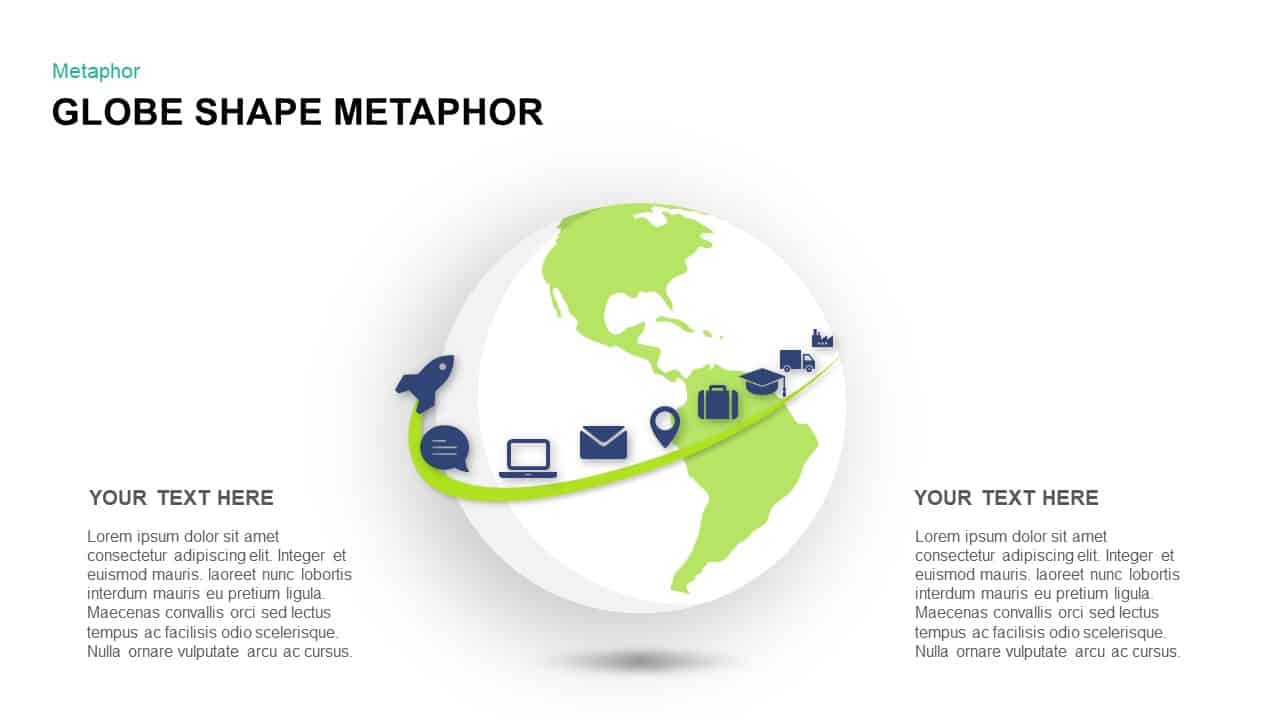
Global Business Pathway Metaphor Template for PowerPoint & Google Slides
Opportunities Challenges

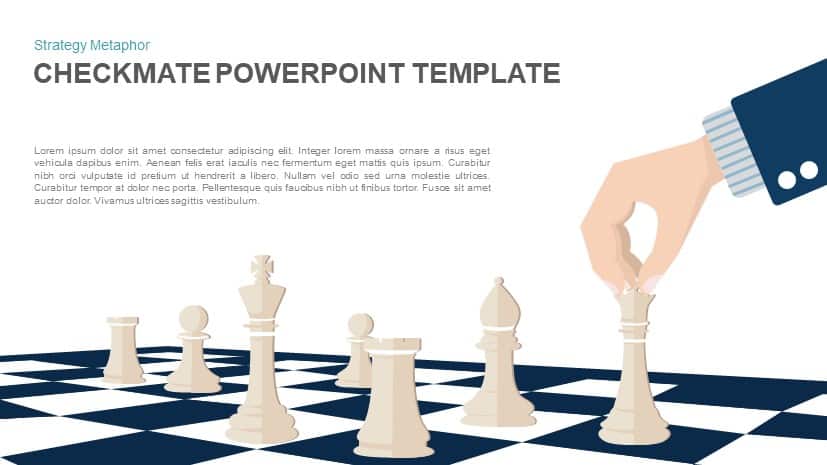
Checkmate Strategy Chess Metaphor Template for PowerPoint & Google Slides
Opportunities Challenges
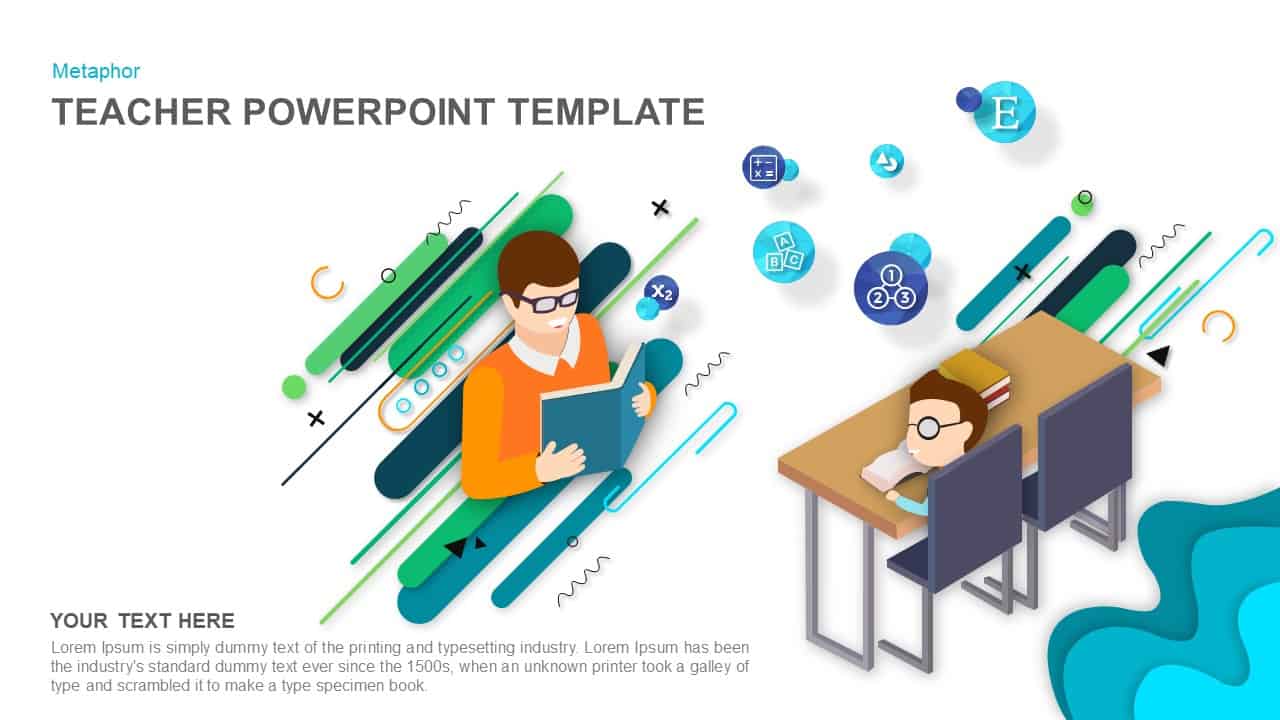
Teacher Illustration Metaphor Slide Template for PowerPoint & Google Slides
Process

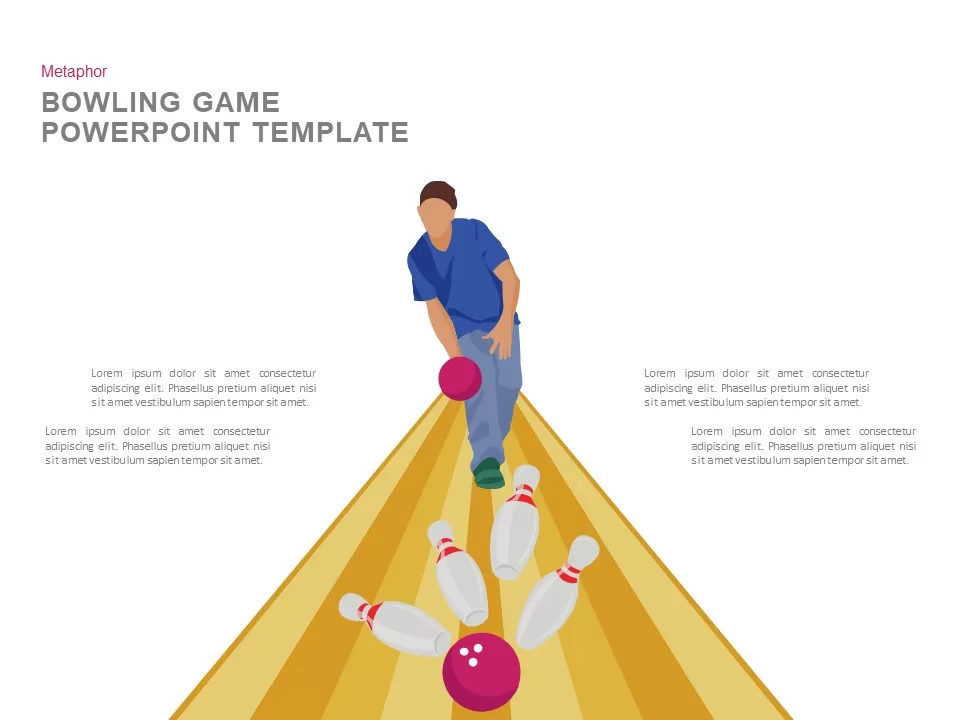
Bowling Game Illustration Metaphor Template for PowerPoint & Google Slides
Process
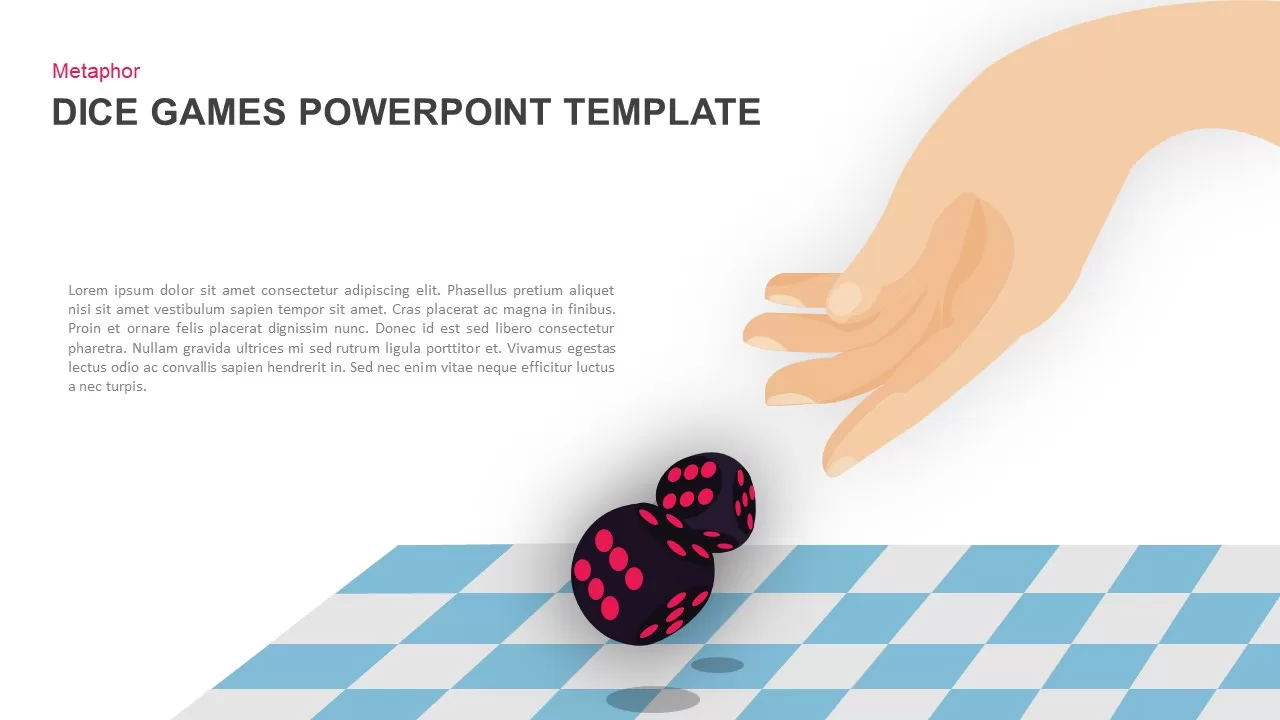
Dice Game Throwing Metaphor Slide Template for PowerPoint & Google Slides
Process
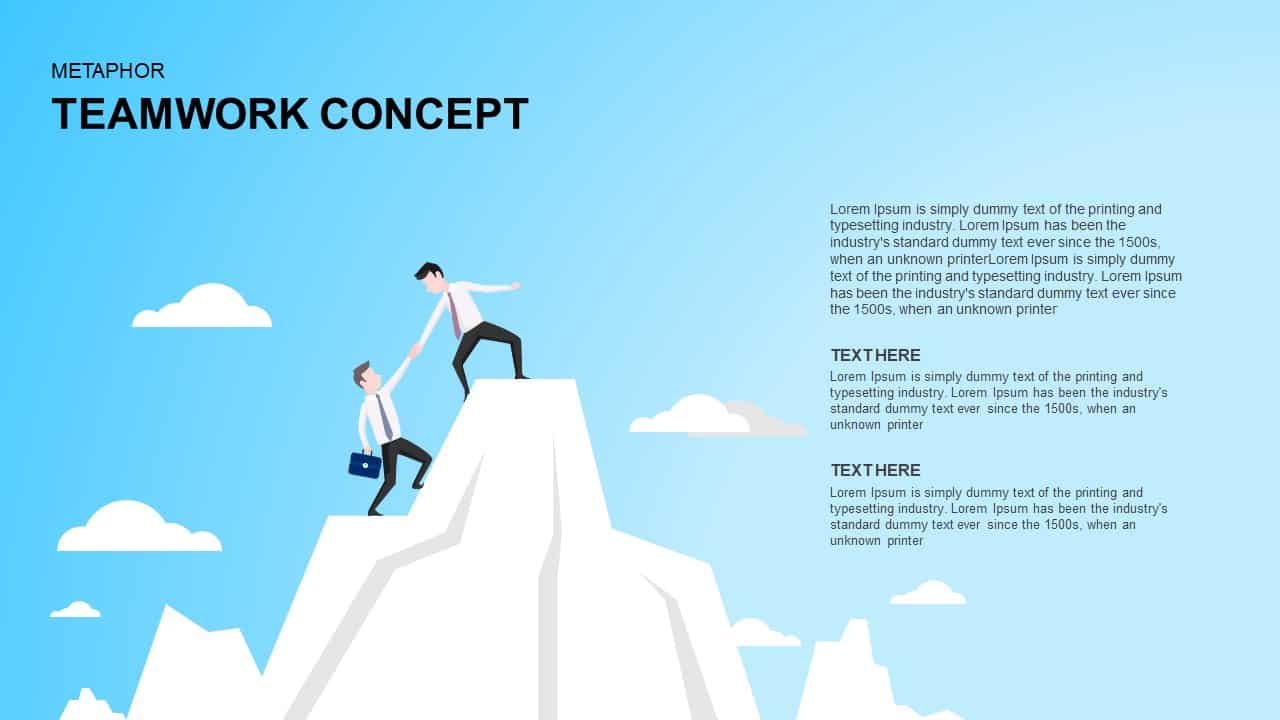
Teamwork Concept Metaphor Template for PowerPoint & Google Slides
Leadership
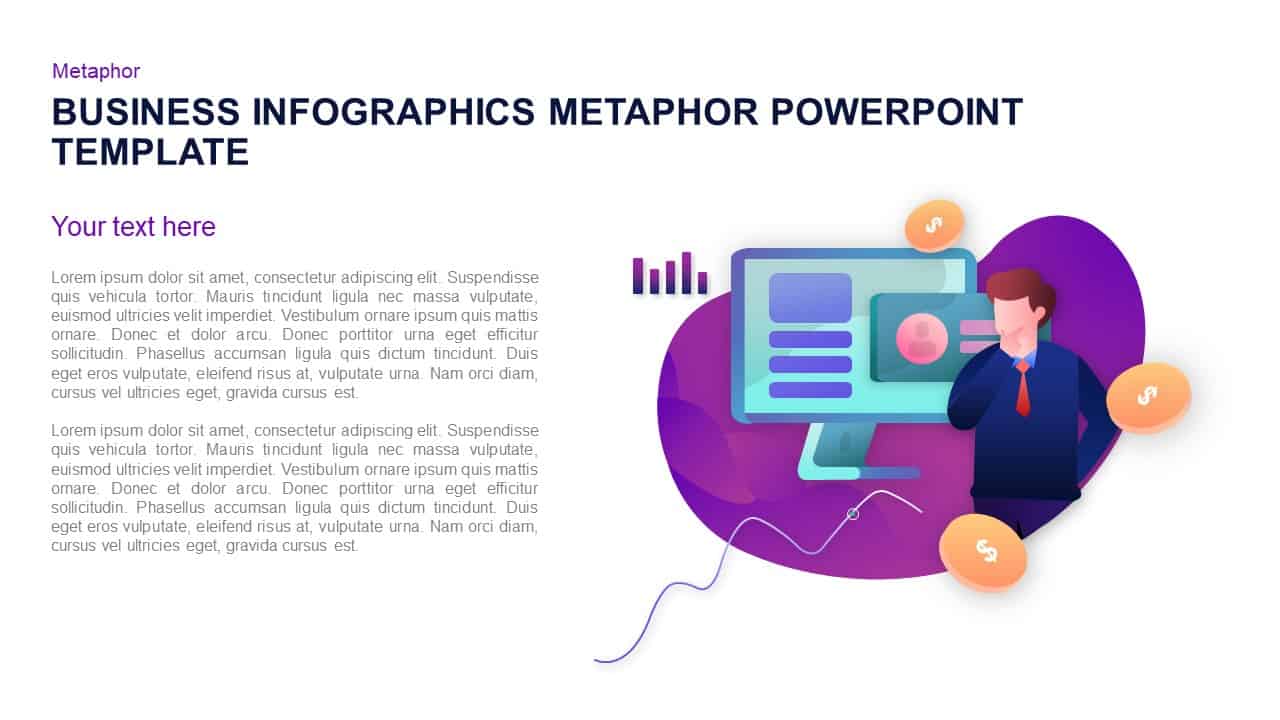
Business Growth Infographic Metaphor Template for PowerPoint & Google Slides
Revenue
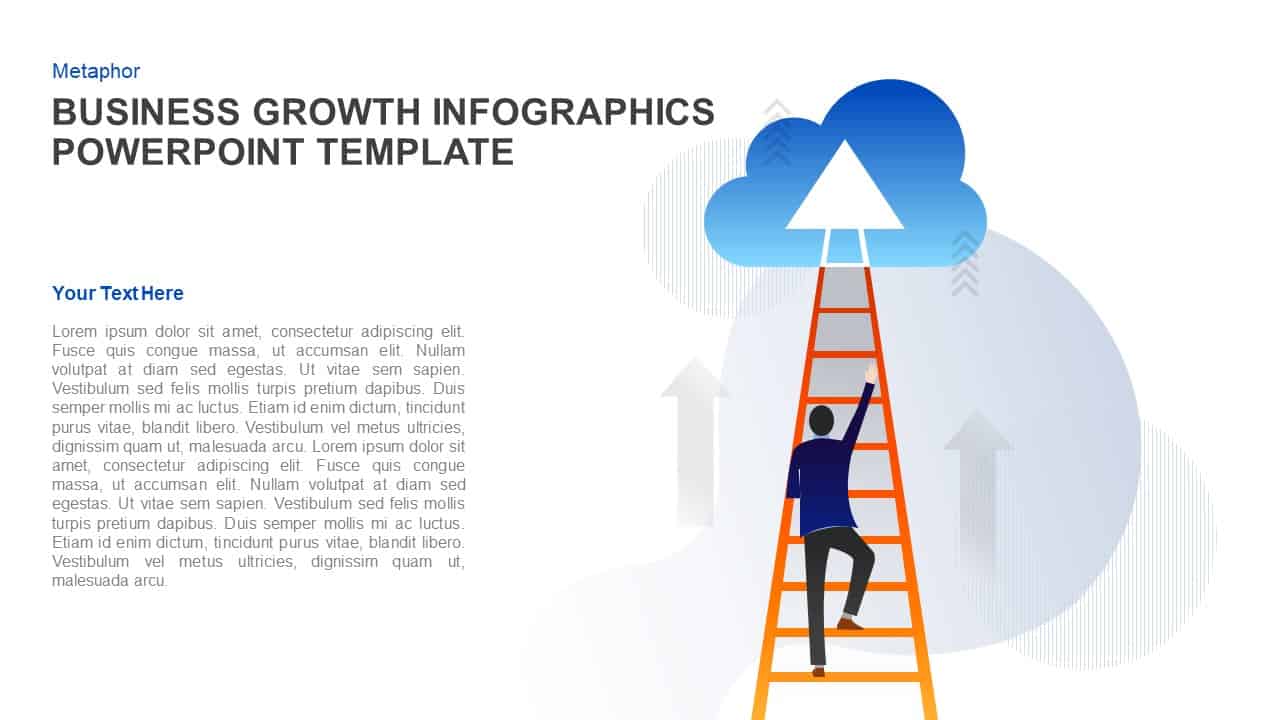
Business Growth Ladder to Cloud Metaphor Template for PowerPoint & Google Slides
Vision and Mission
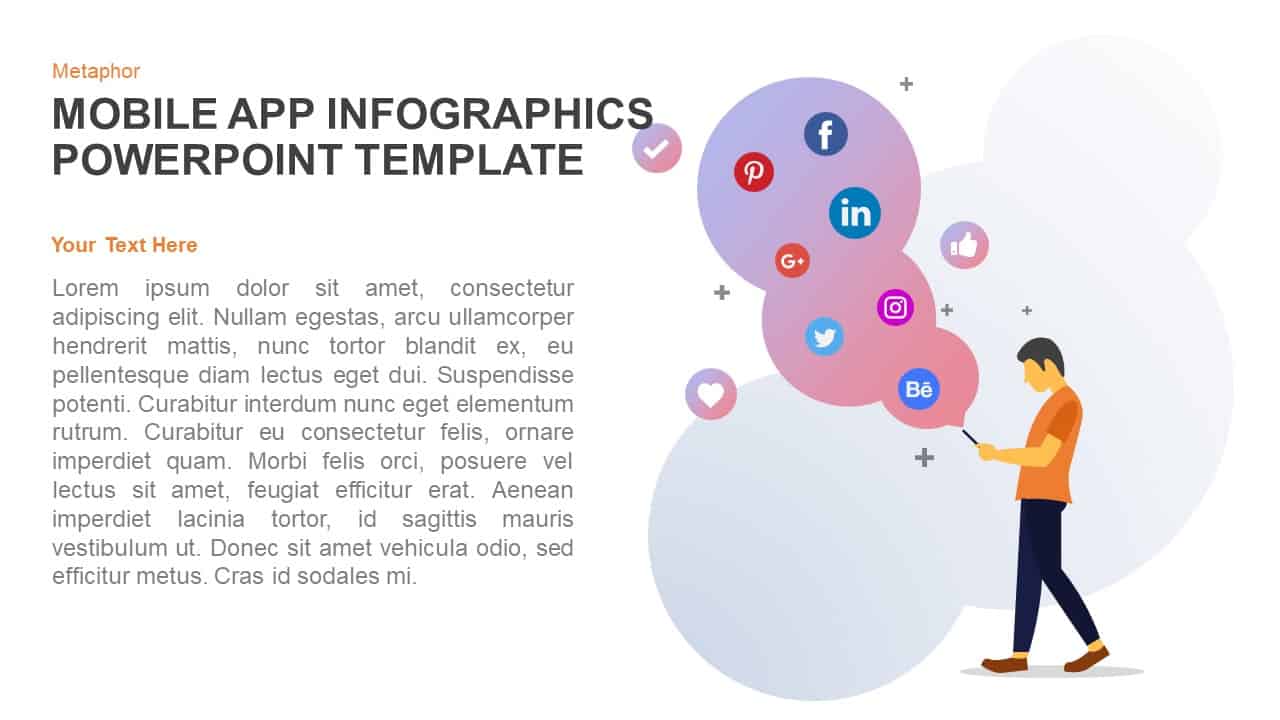
Mobile App Social Media Metaphor Template for PowerPoint & Google Slides
Infographics
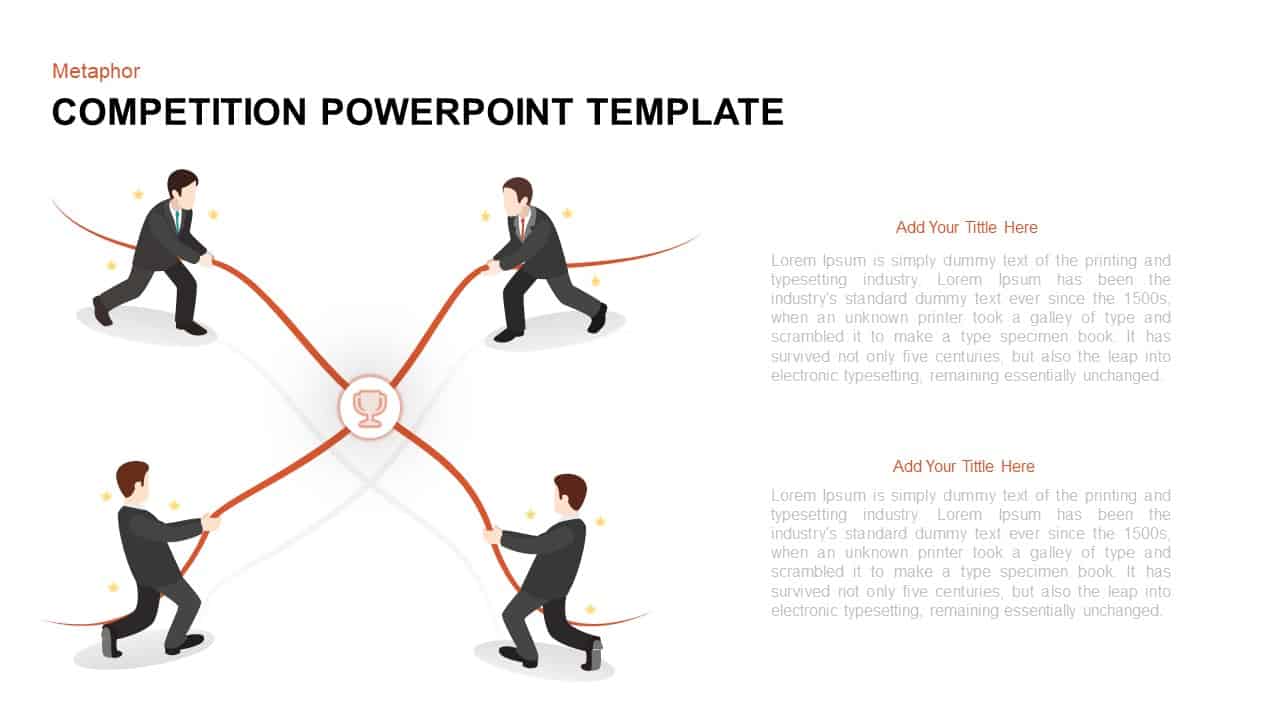
Competitive Tug-of-War Metaphor Template for PowerPoint & Google Slides
Business Strategy
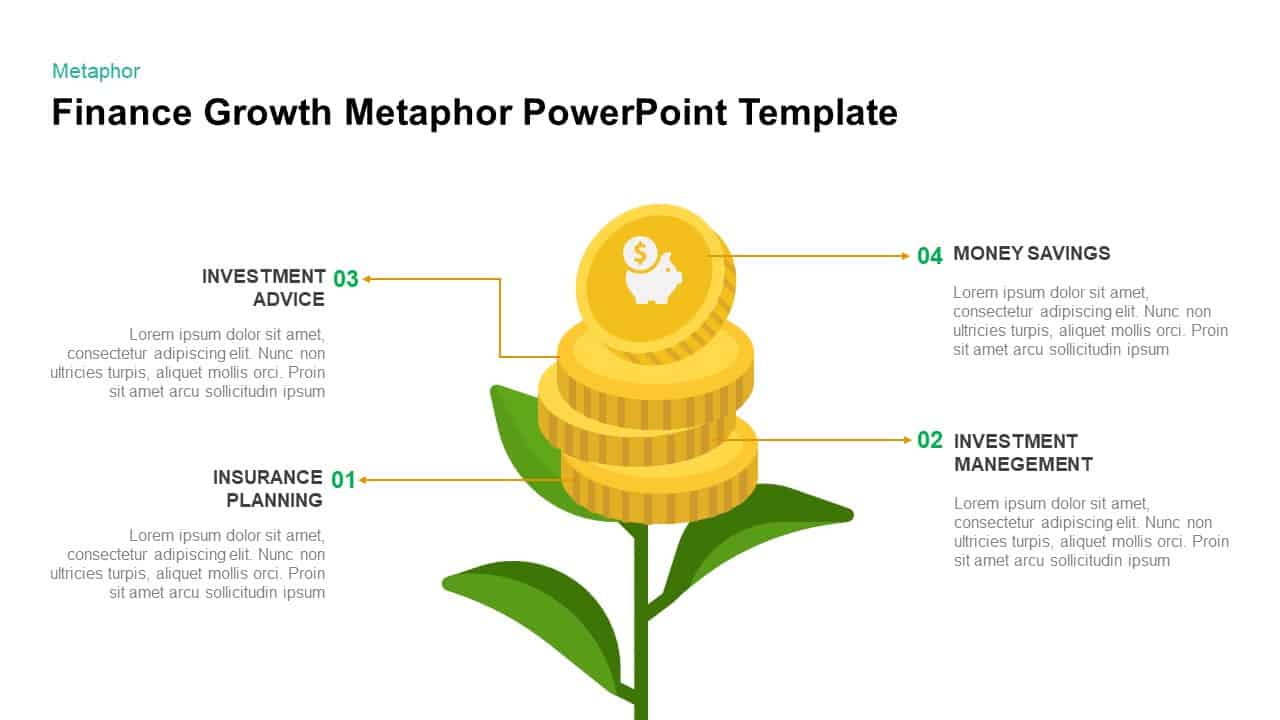
Finance Growth Plant Metaphor Slide Template for PowerPoint & Google Slides
Finance
Collaborative Teamwork Metaphor Illustration Template for PowerPoint & Google Slides
Leadership
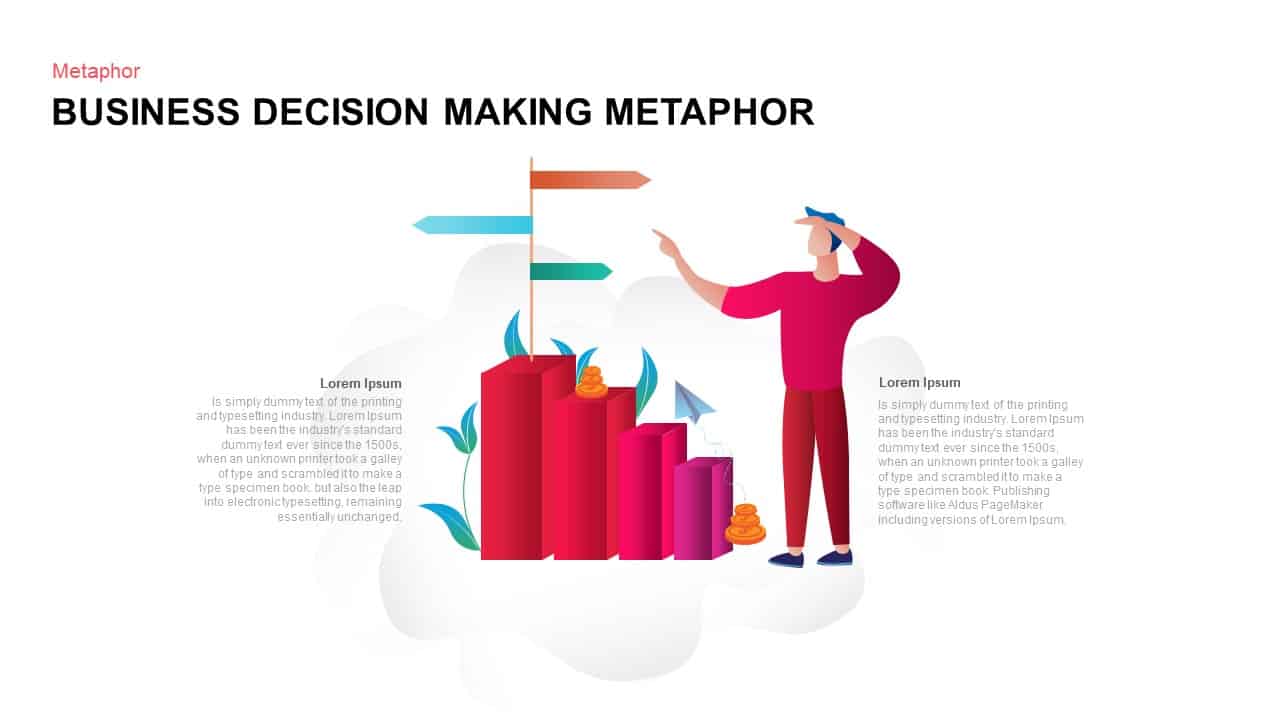
Business Decision Making Metaphor Template for PowerPoint & Google Slides
Arrow
Social Media Metaphor Illustration Template for PowerPoint & Google Slides
Digital Marketing
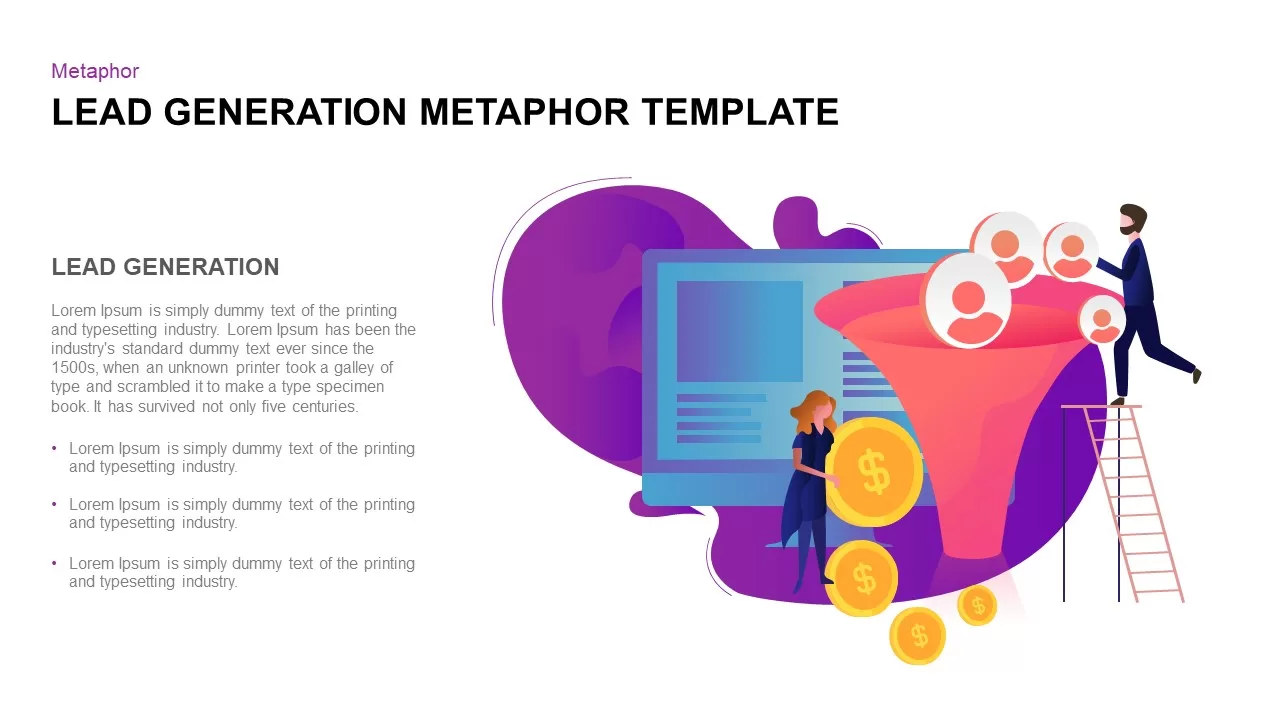
Lead Generation Funnel Metaphor Template for PowerPoint & Google Slides
Marketing Funnel
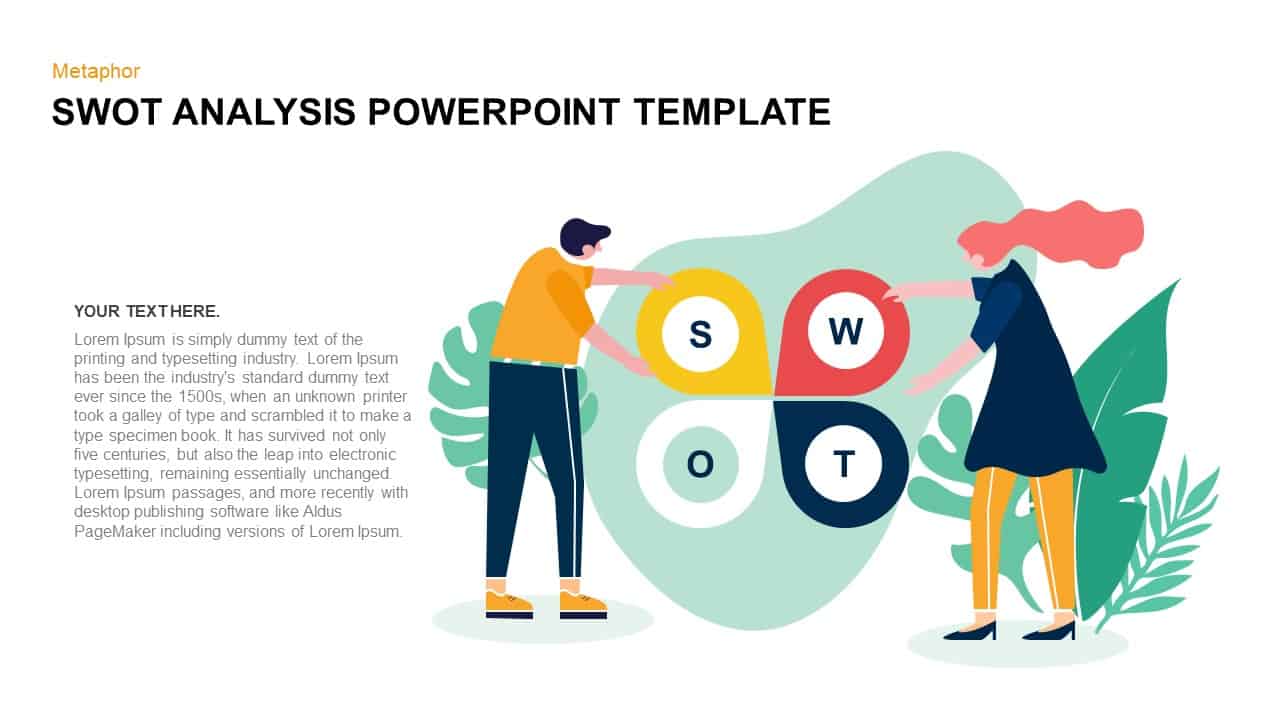
SWOT Analysis Metaphor Illustration Template for PowerPoint & Google Slides
SWOT
Vibrant Digital Marketing Metaphor Template for PowerPoint & Google Slides
Advertising
Collaborative Teamwork Metaphor Slide Template for PowerPoint & Google Slides
Our Team
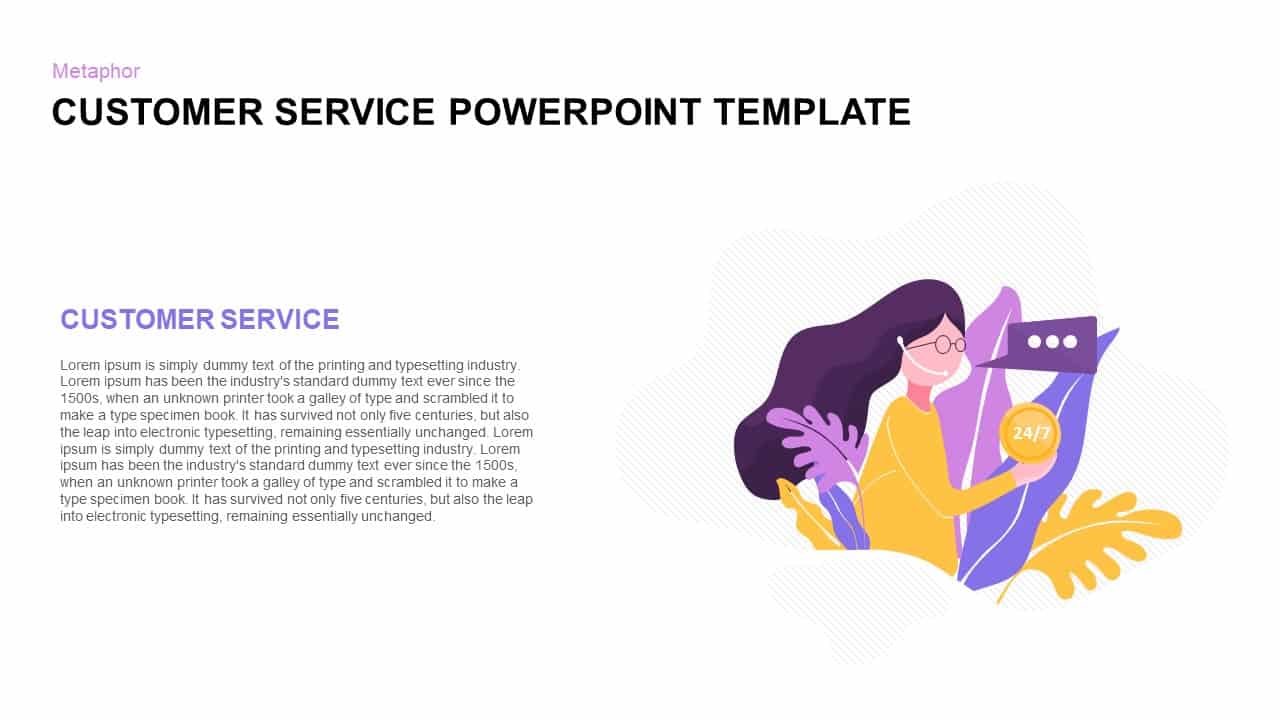
Customer Service Metaphor Infographic Template for PowerPoint & Google Slides
Customer Experience
Financial Report Metaphor Illustration Template for PowerPoint & Google Slides
Finance
Business Growth Metaphor Chart Template for PowerPoint & Google Slides
Business
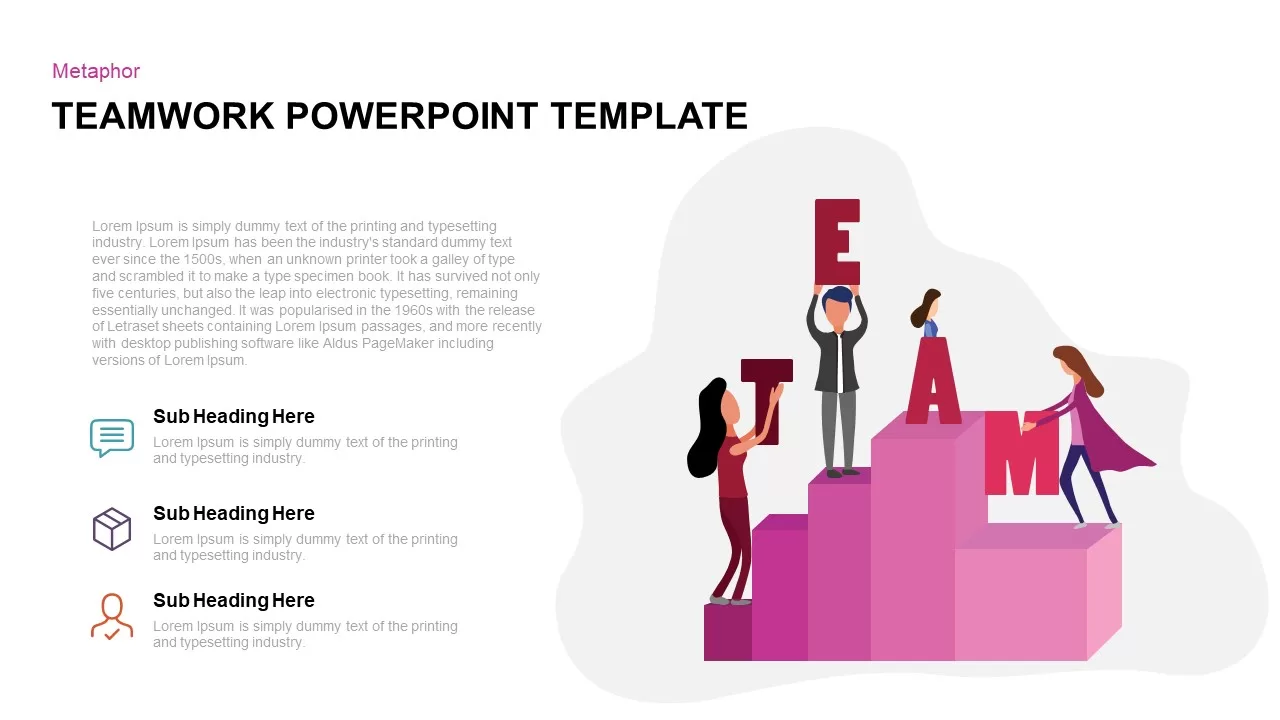
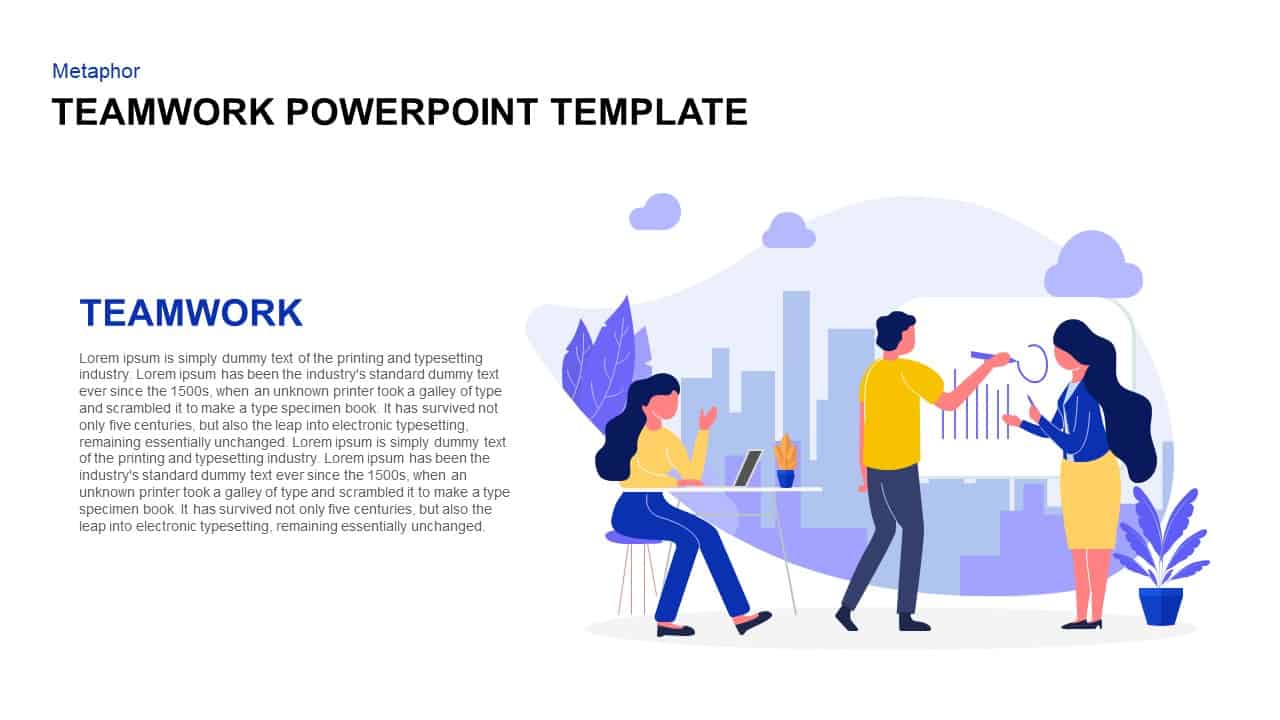
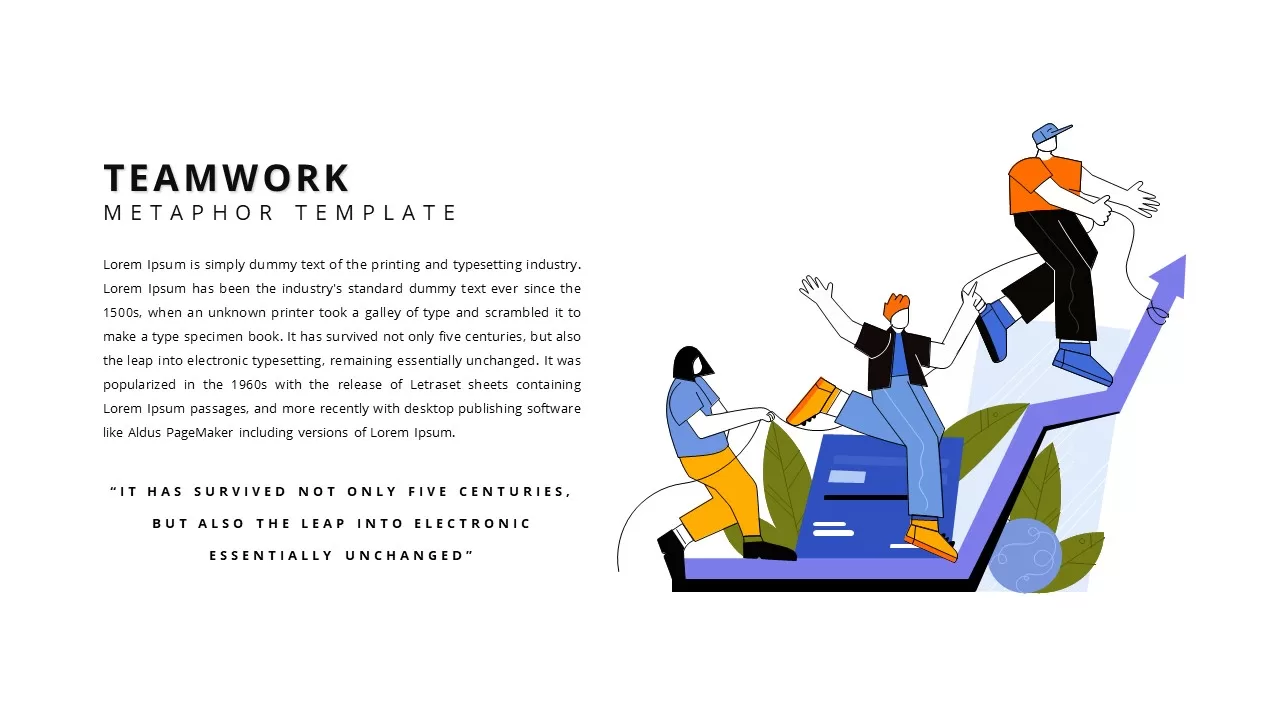
Teamwork Metaphor Illustration Template for PowerPoint & Google Slides
Leadership
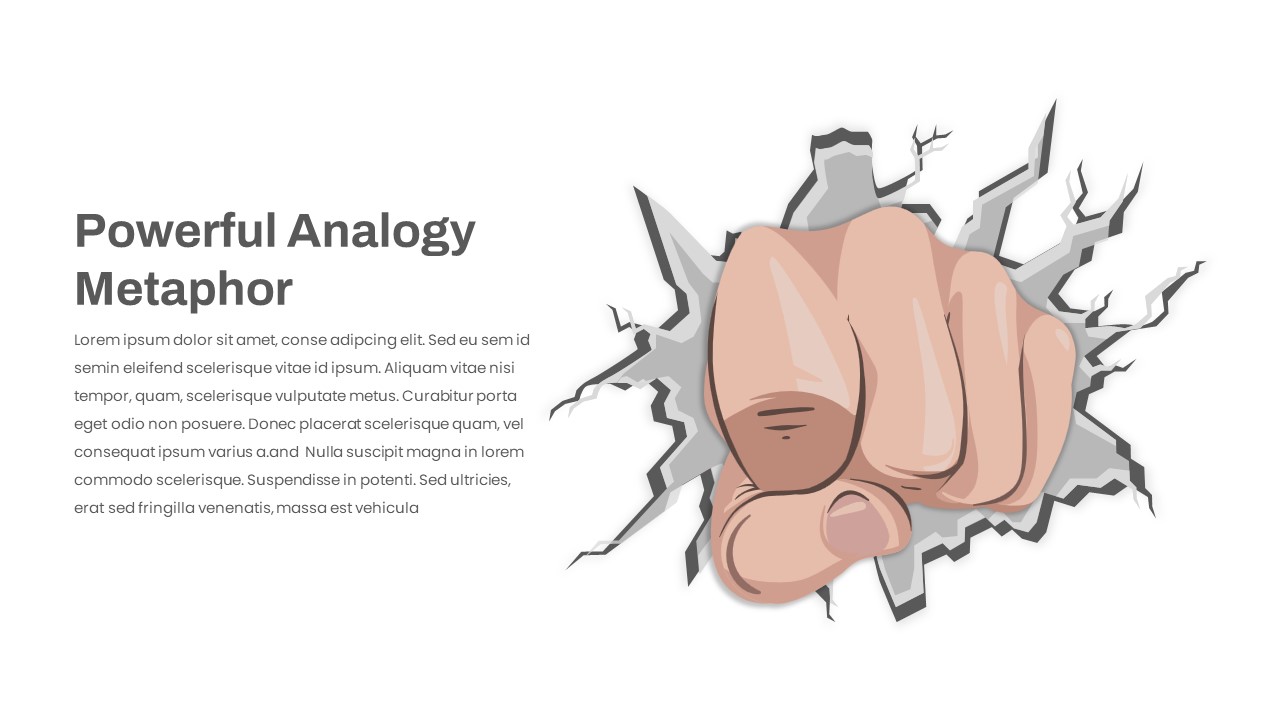
Creative Power Analogy Metaphor Slide Template for PowerPoint & Google Slides
Leadership
Powerful Visual Metaphor Analogy Slide Template for PowerPoint & Google Slides
Opportunities Challenges
Relay Race Metaphor for PowerPoint & Google Slides
Accomplishment
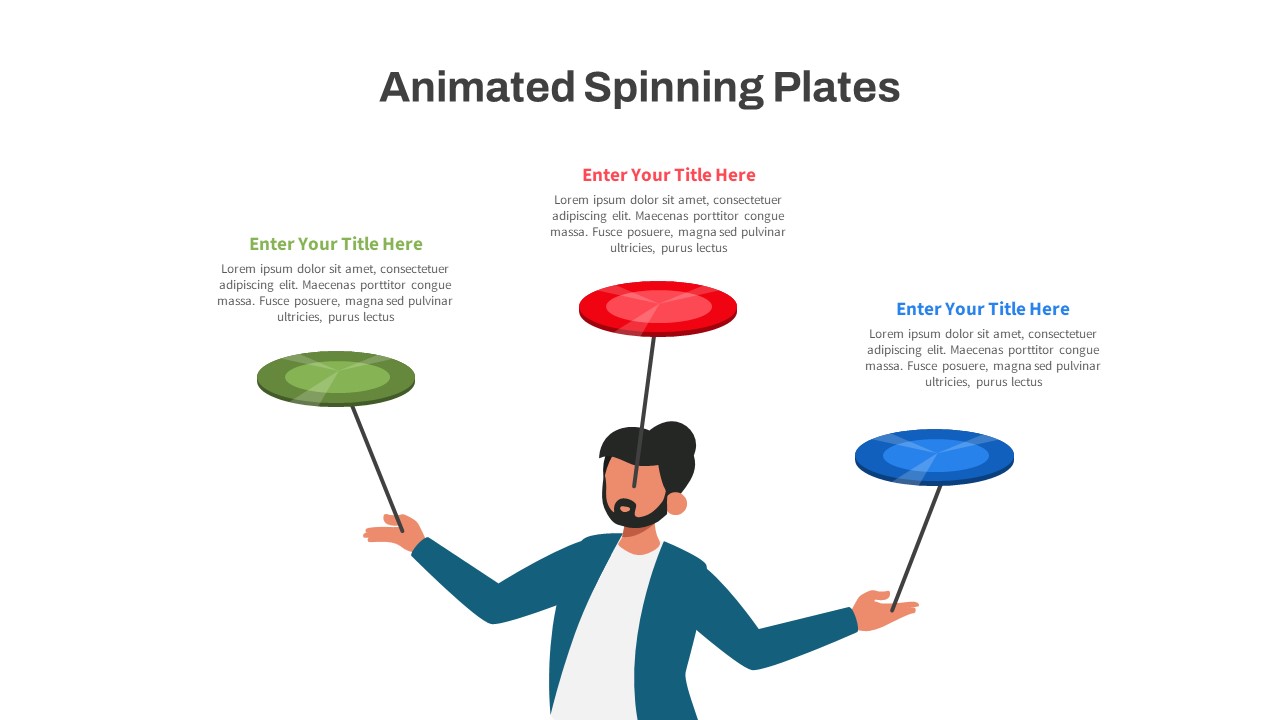
Animated Spinning Plates Metaphor Slide for PowerPoint & Google Slides
Infographics
Metaphor Partnership PowerPoint Template and Keynote Template
Opportunities Challenges
4 Step Process PowerPoint & Google Slides Template for PowerPoint & Google Slides
Process