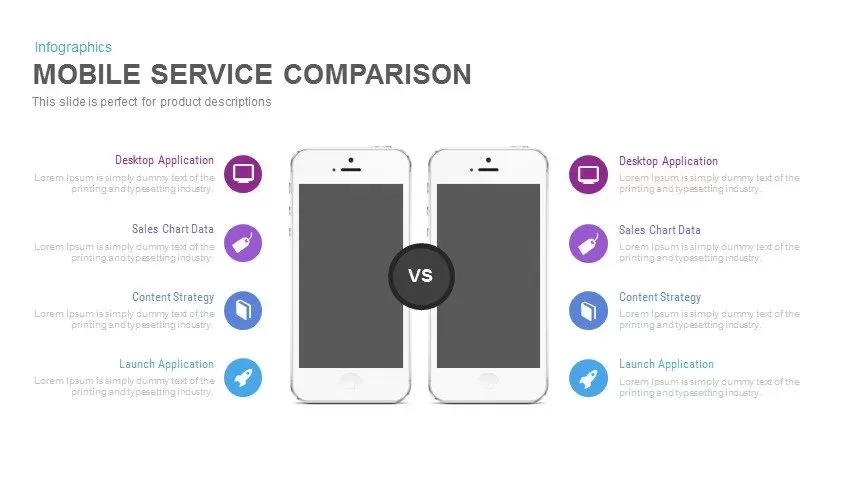
Mobile Service Comparison Powerpoint and Keynote template

Make use of this clean mobile service comparison slide to deliver compelling side-by-side app analyses with unmatched clarity and visual appeal. The layout features dual smartphone mockups separated by a bold “VS” badge, instantly directing attention to your comparative narrative. Each device is accompanied by four customizable icon labels—Desktop Application, Sales Chart Data, Content Strategy, and Launch Application—each showcased within vibrant purple, magenta, blue, and cyan circles. A crisp white background, minimalist gray typography, and subtle drop shadows ensure a modern, polished aesthetic, allowing stakeholders to focus on your key differentiators without distraction. This style fits well with the broader comparison templates collection that helps teams present structured evaluations with ease.
Designed for maximum flexibility, this template is built on master slides with fully editable vector shapes, icons, and text placeholders. Effortlessly swap icons to match your feature set, adjust color accents to align with branding guidelines, or modify text fields for precise product descriptions. The grid-based alignment guarantees perfect spacing, while the consistent typography scale maintains legibility across screens. Fully optimized for both PowerPoint and Google Slides, this asset preserves color fidelity and layout integrity on any device, streamlining collaboration and reducing version control issues during remote or in-person presentations.
Who is it for
Product managers, UX/UI teams, mobile developers, and marketing professionals can leverage this slide to illustrate feature differentiators, pricing tiers, or A/B test results with clarity and impact.
Other Uses
Beyond mobile service comparisons, you can repurpose this slide for pricing tier analysis, competitor benchmarking, web vs mobile feature mapping, or roadmap checkpoints. The dual device layout fits many structured storytelling needs. You can guide users through flow variations with support from the yin yang comparison template when you need a more symbolic contrast. A technical or marketing deck that highlights generational shifts in product usage can pair well with the generations comparison infographic to show demographic patterns beside your mobile data story.
Login to download this file


