Milestone Chart PowerPoint slide

Description
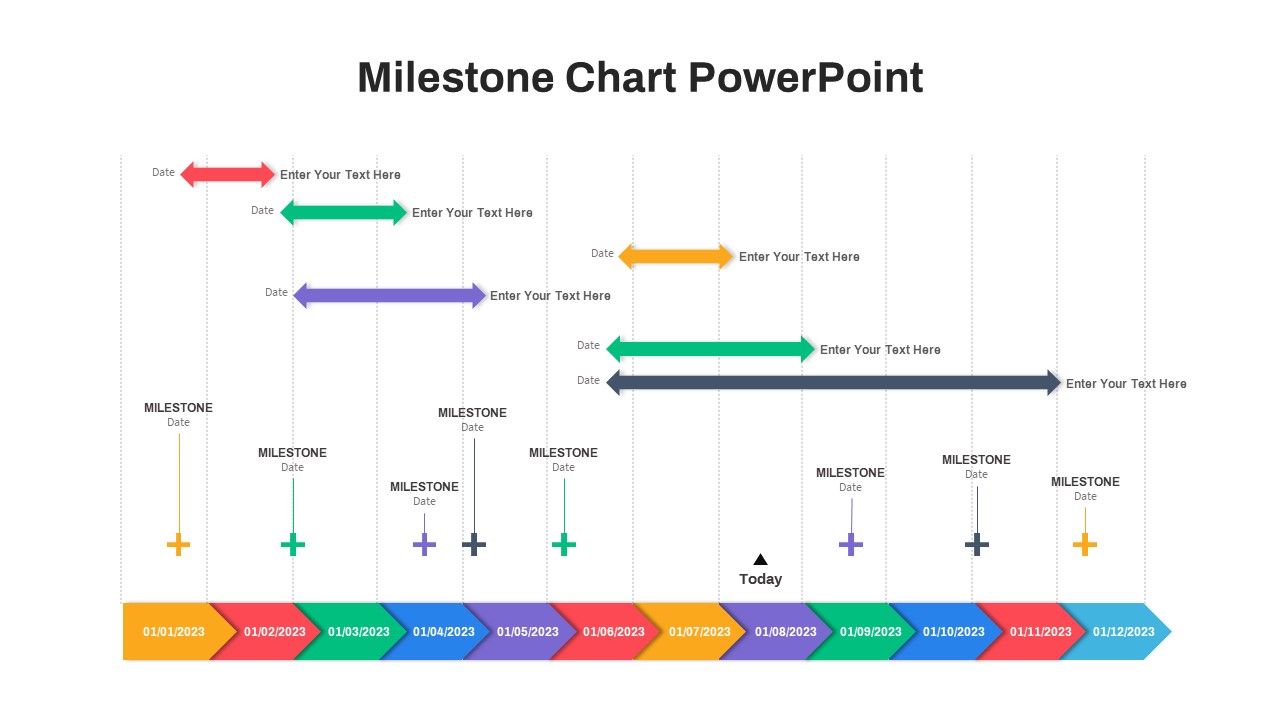
Use this milestone timeline chart template to visualize key project milestones and task durations on a horizontal timeline. The slide features color-coded bidirectional arrow bars to represent the start and end of tasks, and a sequence of chevron-style date blocks along the base. Each date block aligns with vertical guide lines and is paired with an editable icon marker and label to highlight milestone events. A distinct “Today” flag marks the current date, keeping your audience aware of progress. The clean layout, subtle drop shadows, and modern typography ensure clarity on any background, while master-slide controls let you easily modify colors, icons, and text.
Engineered for flexibility, this design supports both PowerPoint and Google Slides platforms with full resolution and responsive behavior. Customize task bars by adjusting start and end dates, swap placeholder text with project details, and use built-in guides to maintain perfect alignment. The bottom timeline can be extended or condensed to fit varying timeframes—days, weeks, or months—so you can adapt it for sprint schedules, marketing campaigns, or long-term roadmaps.
The arrowed task bars support bidirectional progress indicators and can be recolored to match brand palettes or departmental coding. Icons and markers are fully editable vector shapes, enabling you to swap in custom symbols for deliverables, approvals, or dependencies. The timeline date blocks can be resized or duplicated to accommodate longer project durations, and text placeholders allow quick updates during stakeholder meetings. With this visual asset, you can streamline reporting, enhance narrative flow, and ensure stakeholder alignment across all phases of your project.
Who is it for
Project managers, team leads, and executives will benefit from this chart when presenting progress reports, forecasting deadlines, or reviewing status updates at a glance. Consultants, analysts, and educators can leverage its structured timeline to communicate roadmaps and learning modules clearly.
Other Uses
Beyond project tracking, repurpose this template for marketing roadmaps, editorial calendars, product launch plans, or historical event timelines. Use the same layout to compare fiscal quarters, map campaign milestones, or illustrate training schedules.
Login to download this file


