Mexico-Map-With-States3


Leverage this versatile Mexico map slide deck to showcase regional insights and state-level data with clarity and professional polish. This fully editable template features a high-resolution vector map of Mexico with defined state boundaries and multiple customizable marker styles, including colored pins, bold callout panels, integrated charts, percentage data hexagons, and titled text boxes. Each of the five slide layouts supports master-slide editing for marker positions, colors, and text fields, ensuring seamless brand alignment across your presentation.
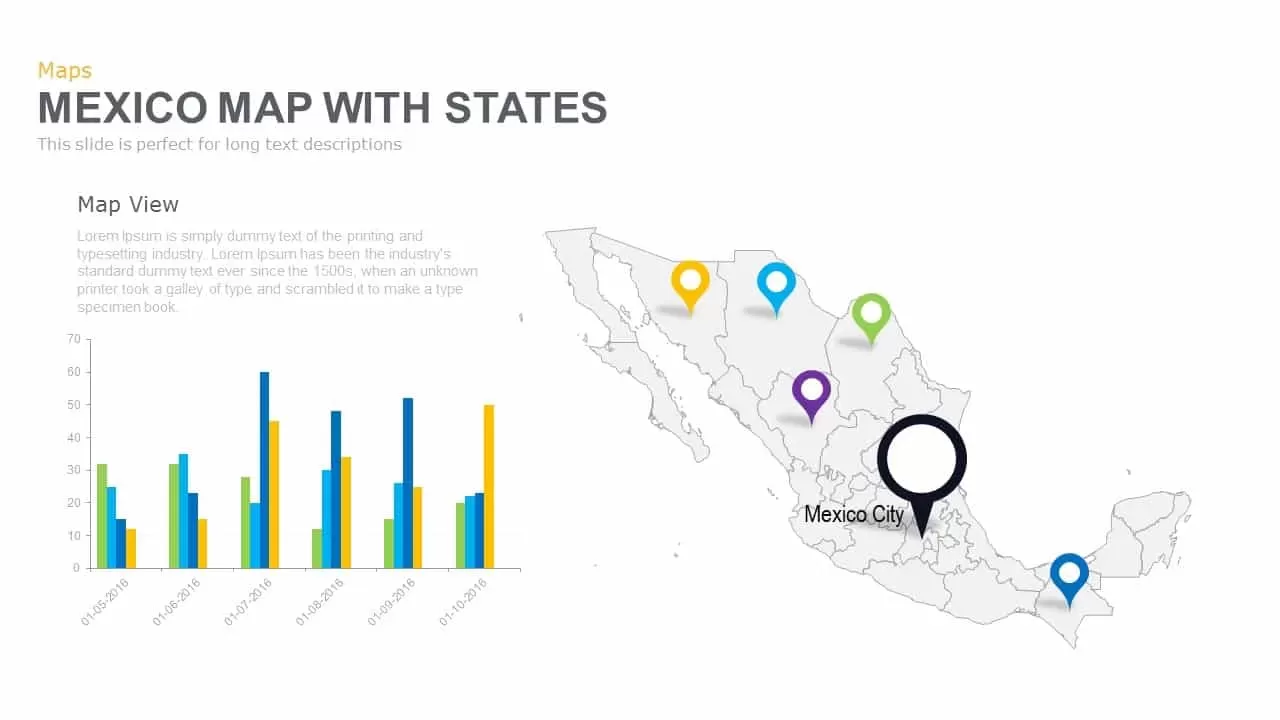
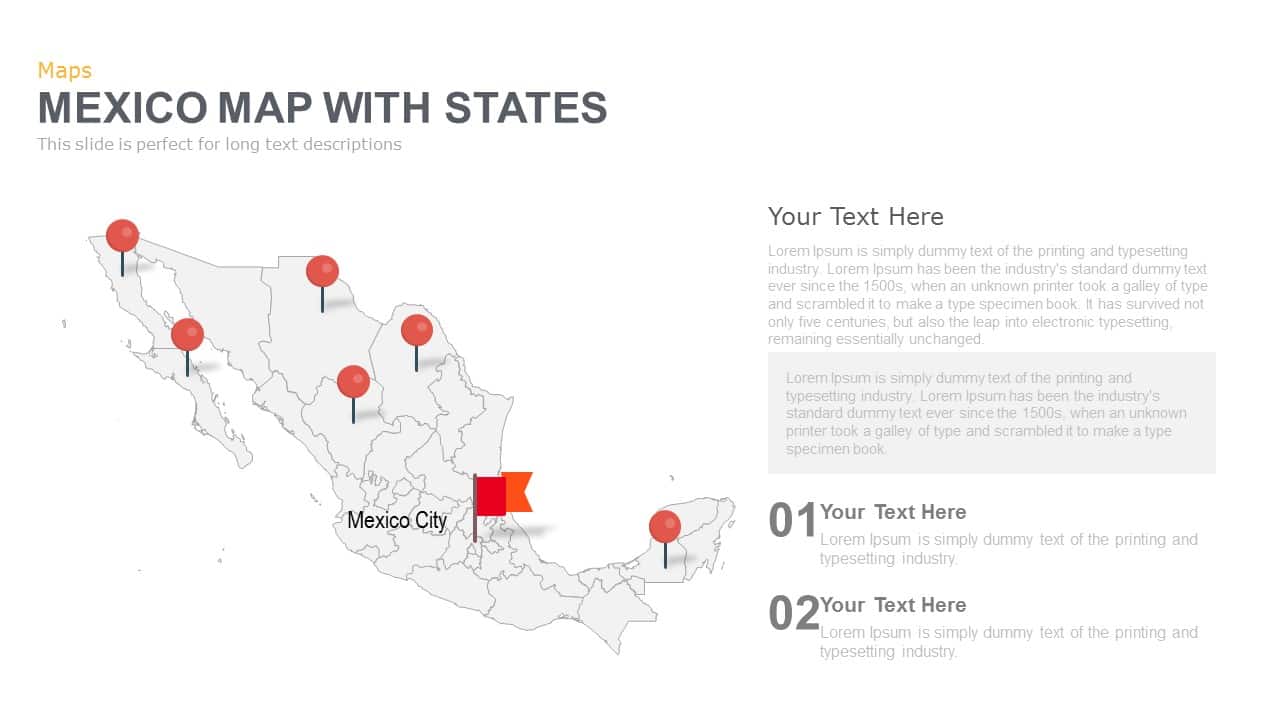
The basic marker layout lets you pinpoint up to six locations with red pin icons and subtle drop shadows for depth. The zoom-in callout slide expands any state marker into a skewed text panel for detailed annotations. The data slide combines the map with a side-by-side bar chart—adjust chart values and legend colors via data-driven placeholders. The demographic slide overlays two hexagon percentage callouts to highlight key metrics like user segments or regional performance. Finally, the titled panel layout pairs the map with a shaded text box and heading bar for long-form descriptions or policy overviews.
Built on PowerPoint and Google Slides masters, this deck guarantees consistent styling, precise alignment, and effortless theme switching between light and dark backgrounds. All vector shapes, icons, and text placeholders are grouped and labeled for rapid customization—even for non-designers. Simply swap marker colors, adjust callout panel shapes, replace icons, or update text in seconds without disrupting the layout. Animations and slide transitions can be applied to introduce markers or charts sequentially, enhancing audience engagement.
Whether you’re presenting sales territories, logistics networks, demographic analyses, or policy briefs, this Mexico map slide deck equips you with dynamic visuals and data storytelling tools to drive strategic discussions and informed decision-making.
Who is it for
Regional managers, market analysts, and consultants will use this deck to report state-by-state performance, sales territories, and logistical operations. Educators, policy advisors, and public health officials can leverage the callouts and charts for demographic studies, program rollouts, and research presentations.
Other Uses
Beyond regional reporting, repurpose this deck for supply chain mapping, electoral analysis, tourism hotspots, resource allocation plans, or educational geography modules. Duplicate slides to compare periods, overlay additional data visualizations, or adapt marker styles for stakeholder workshops and training sessions.
Login to download this file


