Mean Median Mode Template
Make statistics easier to present with the Mean Median Mode Template, a four slide PowerPoint deck created to explain the three main measures of central tendency through definitions, formulas, worked examples, and practical comparisons. Designed for teachers, tutors, students, and data professionals, the presentation moves from basic concepts to a real dataset example and finishes with a decision framework for selecting the appropriate measure. A soft grid background, hand drawn illustrations, colorful cards, and simple statistical icons give the template a classroom friendly visual style while keeping the information organized and easy to follow.
What Is a Mean Median Mode Template?
A Mean Median Mode Template is a PPT template designed to explain the mean, median, and mode in a clear and visual format. It combines formula cards, definitions, use cases, and a worked dataset to demonstrate how the three measures can produce different results from the same set of numbers. The layout is useful for statistics education, data literacy sessions, business analysis, and academic presentations where audiences need to understand both the calculation and practical application of each measure.
This PowerPoint presentation includes four slides:
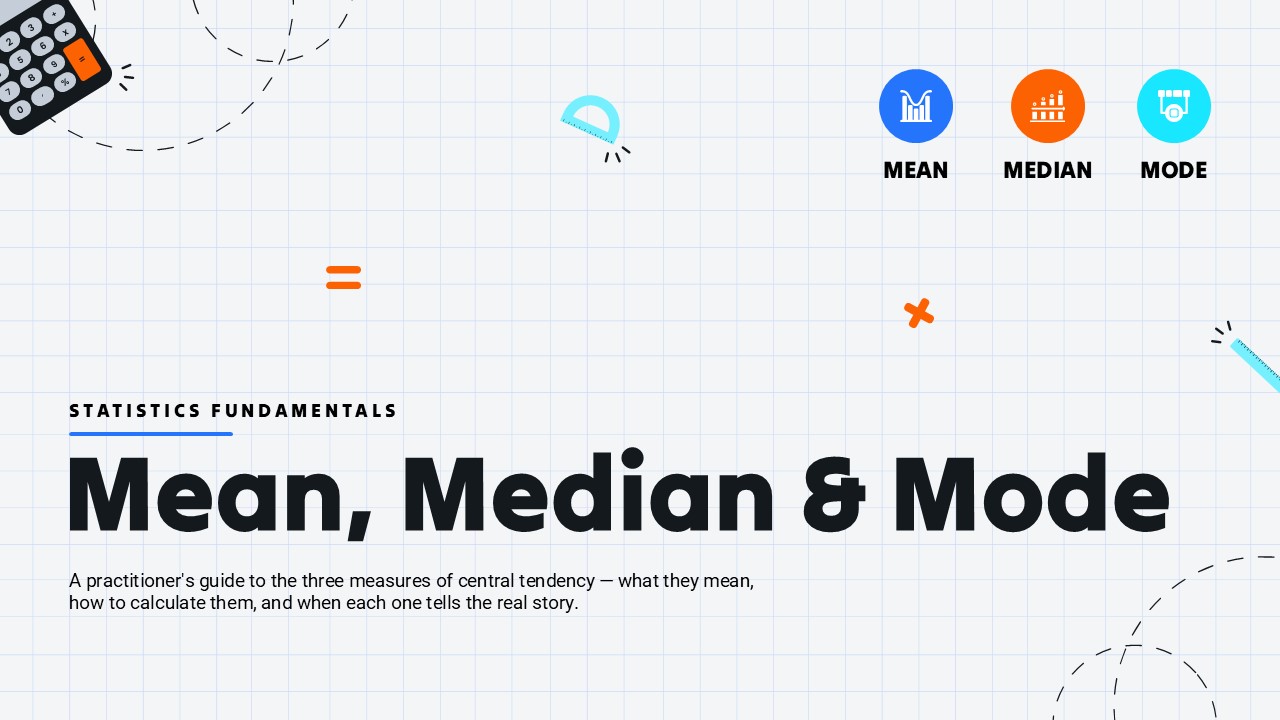
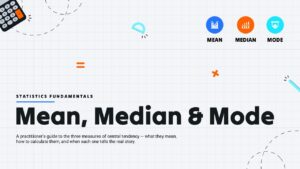
- Title Slide – introduces Mean, Median & Mode with dedicated topic icons and a clean statistics themed composition.
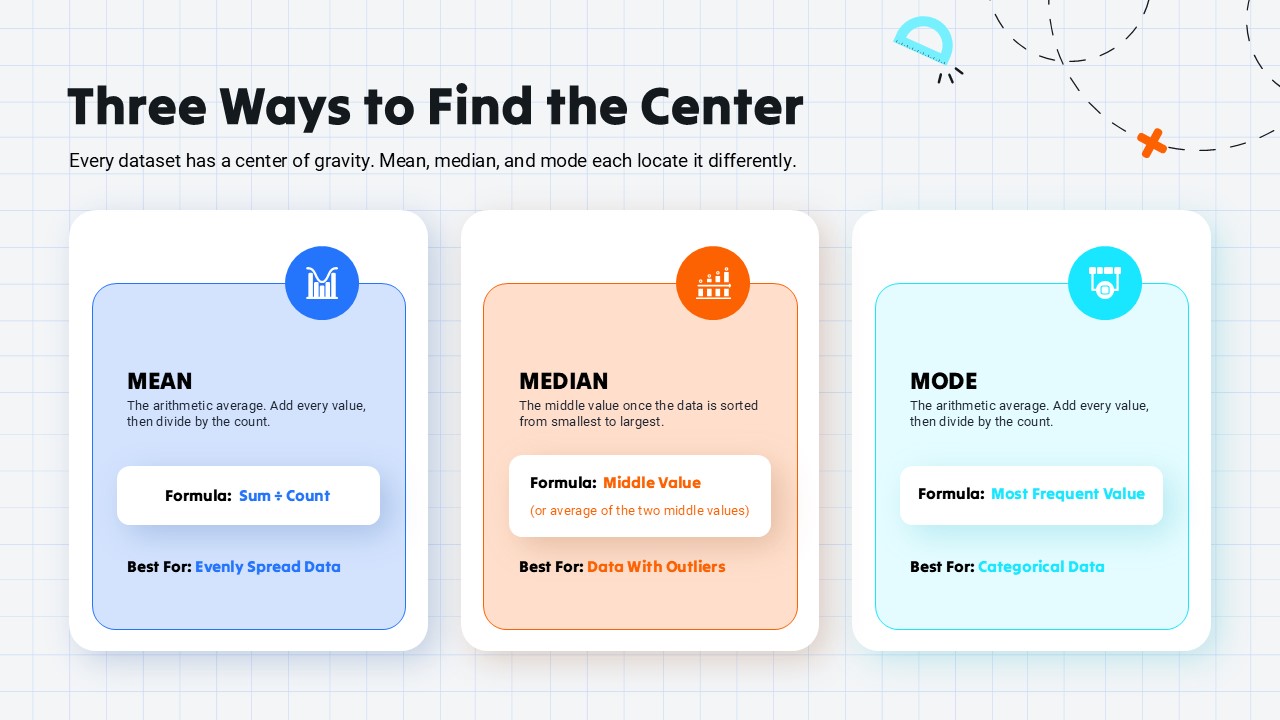
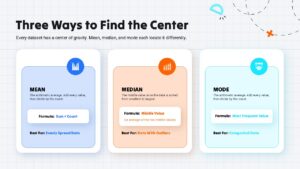
- Three Ways to Find the Center – explains the definition, formula, and suitable use case for mean, median, and mode through individual visual cards.
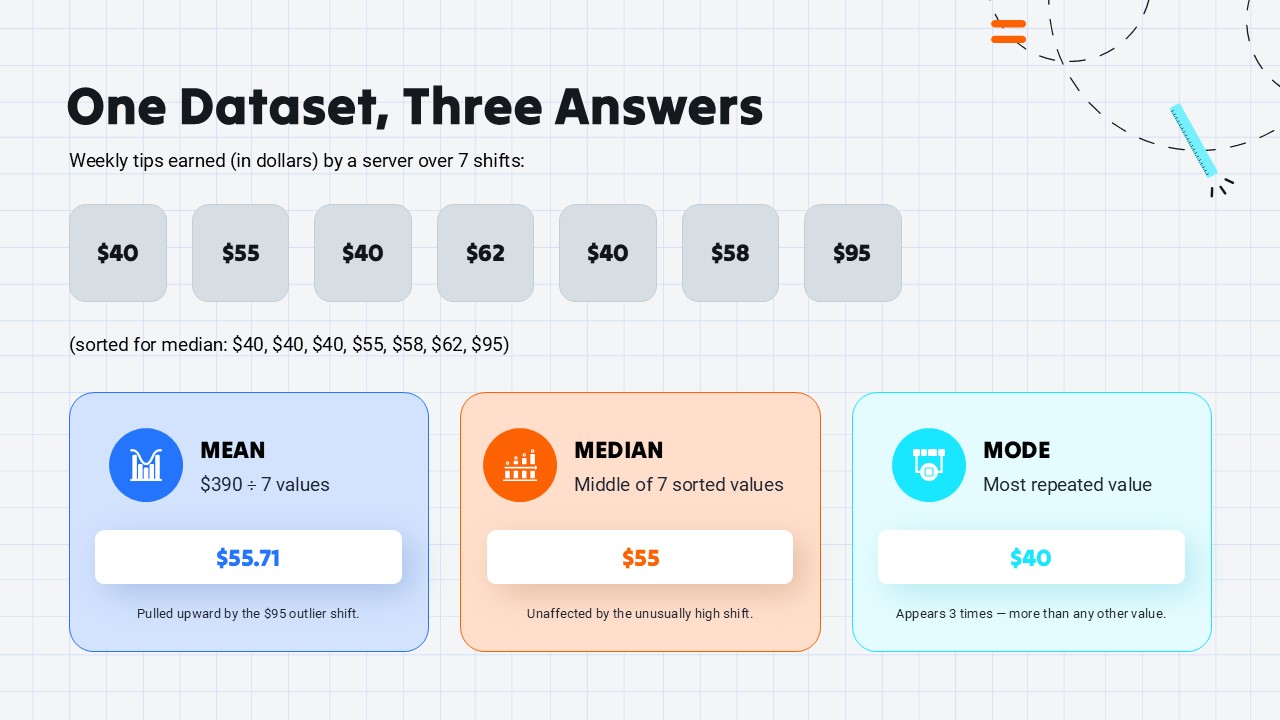
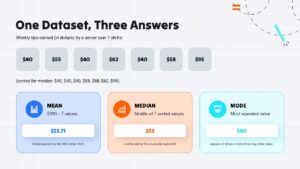
- One Dataset, Three Answers – uses seven days of tip data to demonstrate the calculation of all three measures and highlight how their results differ.
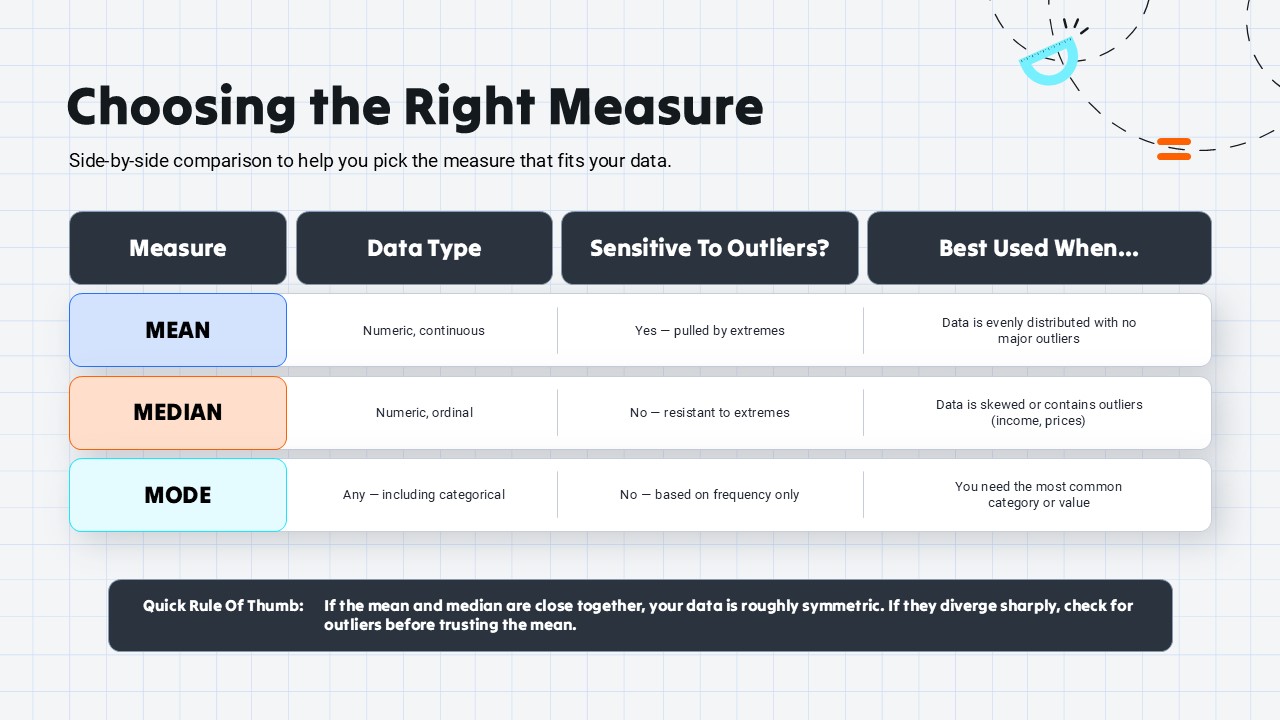
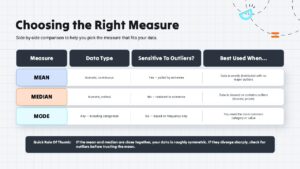
- Choosing the Right Measure – compares mean, median, and mode based on data type, outlier sensitivity, and appropriate applications, with a quick selection guide.
The worked example provides a practical way to show how central tendency behaves across a dataset. It demonstrates the calculation process, orders values for finding the median, identifies the most frequent value for the mode, and shows how an unusually high value can affect the mean. The final comparison slide reinforces the concepts with a concise reference:
- Mean – suitable for numeric continuous data, sensitive to outliers, and useful when values are relatively evenly distributed.
- Median – suitable for numeric or ordinal data, less affected by outliers, and useful for skewed datasets such as income and property prices.
- Mode – works with categorical or numeric data and identifies the most frequently occurring category or value.
Every card, formula, icon, text field, and table cell in this PowerPoint template is fully editable. Replace the sample numbers with your own dataset, modify the formulas, update the examples, or adjust the visual elements directly in Microsoft PowerPoint. The reusable structure makes it suitable for statistics classes, tutoring sessions, data presentations, business training, and educational workshops.
Get this Mean Median Mode Template for your next statistics lesson or data presentation.
Frequently Asked Questions
How many slides are included in this template?
Can I edit the dataset and formulas in the worked example slide?
Login to download this file

Item ID
SB06204Designed By
Amal


Related Templates

Code mode Startup Business Plan Presentation Template
Software Development
Failure Mode Effects Analysis (FMEA) Slide Template
Process